| Fire incidents reported |
|---|
| Sreet name | Count |
|---|
| HWY 20 HWY | 104 | | TWIN LAKES RD | 52 | | EAST CHEWUCH RD | 40 | | WOLF CREEK RD | 34 | | BEAR CREEK RD | 32 | | WEST CHEWUCH RD | 28 | | TWISPWINTHROP EASTSIDE RD | 26 | | HWY 153 HWY | 24 | | RENDEZVOUS RD | 24 | | TWISP-WINTHROP EASTSIDE RD | 20 | | PATTERSON LAKE RD | 14 | | RIVERSIDE AVE | 14 | | TWIN LAKES DR | 12 | | LIBBY CREEK RD | 10 | | CUB CREEK RD | 8 | | EVANS RD | 8 | | HILL DR | 8 | | LOWER BEAR CREEK RD | 8 | | OLD TWISP HWY | 8 | | BLACKBIRD RD | 6 | | BLUFF ST | 6 | | GOUDE GRADE RD | 6 | | HWY 20 | 6 | | KNOTTY PINE RD | 6 | | LARKSPUR | 6 |
| | | Fire incidents reported |
|---|
| Sreet name | Count |
|---|
| LITTLE COLT LN | 6 | | NORTHCOT RD | 6 | | RUST RD | 6 | | STUDHORSE MOUNTAIN RD | 6 | | TWISP RIVER RD | 6 | | VIEW RIDGE RD | 6 | | ASPEN LANE | 4 | | BALSAMROOT DR | 4 | | BEARFIGHT RD | 4 | | BENSON CREEK DR | 4 | | BENSON CREEK RD | 4 | | BRYAN RD | 4 | | CASTLE AVE | 4 | | DURANGO DR | 4 | | GOLD CREEK RD | 4 | | HAMILTON RANCH LOOP RD | 4 | | LAKE RD | 4 | | LESTER RD | 4 | | LEWISIA RD | 4 | | LINCE LN | 4 | | LOST RIVER RD | 4 | | LOWER BEAR CR. RD | 4 | | MAGERS ST | 4 | | MAUGHN RD | 4 | | |
|
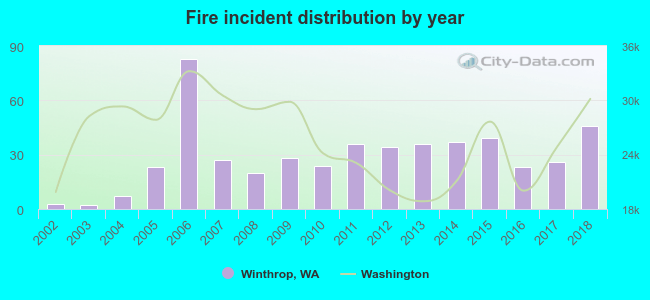 According to the data from the years 2002 - 2018 the average number of fires per year is 29. The highest number of fires - 83 took place in 2006, and the least - 2 in 2003. The data has a rising trend.
 28.5% incidents where reported in the morning and 71.5% in the evening. The most fires (16.0%) took place on Sunday, and the least (12.3%) on Thursday.
 Based on the 494 reports from years 2002 - 2018 most fires (17.0%) took place during July, and the least (1.4%) in February.
 Out of all 771 cases reported during the years 2002 - 2018, the most belonged to the categories: Fire (64.1%), Rescue & EMS (10.8%), and Good Intent Call (10.6%).
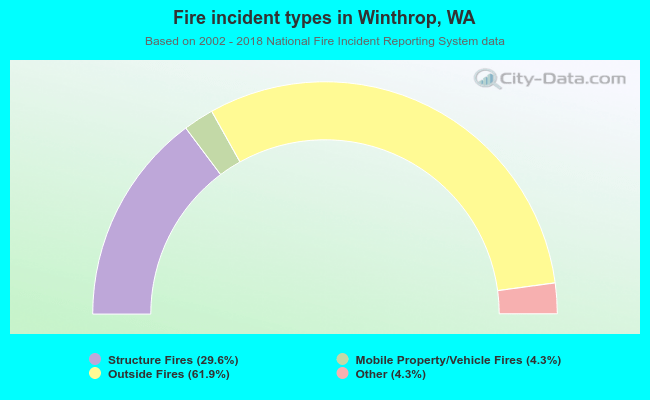 When looking into fire subcategories, the most reports belonged to: Outside Fires (61.9%), and Structure Fires (29.6%).