| Fire incidents reported |
|---|
| Sreet name | Count |
|---|
| HIGHWAY 14 | 38 | | 14 HWY | 30 | | HIGHWAY 14 HWY | 30 | | MAIN ST | 24 | | SR 14 | 14 | | HWY 14 | 12 | | BUNN ST | 10 | | RAILROAD AVE | 6 | | WISHRAM RD | 6 | | BUNN ST | 4 | | COFFIELD LN | 4 | | HWY14M.P91 | 4 | | HYW 14 | 4 | | MAIN STRE | 4 | | RAILROAD RD | 4 | | SR 14 HWY | 4 | | 1 MILE EAST | 2 | | 100 MAIN ST | 2 | | 135 MAIN ST | 2 | | 14 HL | 2 | | 208 MAIN ST | 2 | | 208 MAIN ST. | 2 | | 232 OVERLOOK DR. N BOULDER DR. | 2 | | 24 WISHRAM RD | 2 | | 400 MAIN ST | 2 |
| | | Fire incidents reported |
|---|
| Sreet name | Count |
|---|
| 78 MAIN ST. | 2 | | 9273 HIGHWAY 14 | 2 | | AVERY | 2 | | AVERY RD | 2 | | AVERY RD | 2 | | AVERY RD. HWY 14 MP 89.5 | 2 | | BLUFF RD | 2 | | BNSF BRIDGE WEST | 2 | | BOULDER DR | 2 | | BUNN | 2 | | DUMP LAKE | 2 | | DUMP LAKE RD | 2 | | DUMP LAKE RD | 2 | | FALLBRIDGE RD | 2 | | HIGHWAY 97 | 2 | | HIGHWAY 14 M.P. 91 | 2 | | HIGHWAY 14 MP 94 | 2 | | HIGHWAY 97 HWY | 2 | | HIWAY 14 | 2 | | HWY 14 AND MAIN ST | 2 | | HWY 14 HWY | 2 | | HWY 14 M.P. 94 | 2 | | HWY 14 M.P. 95 | 2 | | HWY 14 MP (AVERY) | 2 | | |
|
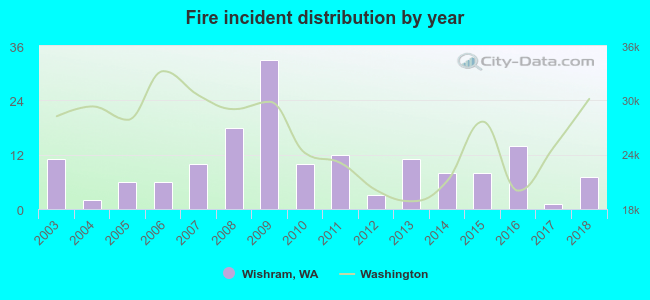 According to the data from the years 2003 - 2018 the average number of fires per year is 10. The highest number of fires - 33 took place in 2009, and the least - 1 in 2017. The data has a declining trend.
 23.8% incidents where reported in the morning and 76.3% in the evening. The most fires (18.1%) took place on Wednesday, and the least (11.3%) on Saturday.
 Based on the 160 reports from years 2003 - 2018 most fires (22.5%) took place during May, and the least (0.6%) in February.
 Out of all 169 cases reported during the years 2003 - 2018, the most belonged to the categories: Fire (94.7%), Overpressure Rupture (3.6%), and Hazardous Condition (1.2%).
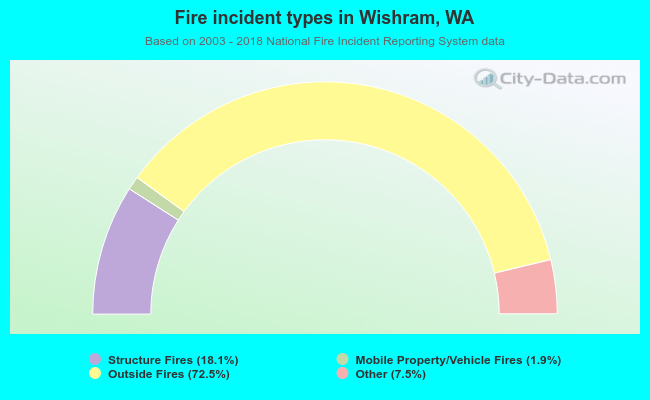 When looking into fire subcategories, the most reports belonged to: Outside Fires (72.5%), and Structure Fires (18.1%).