| Fire incidents reported |
|---|
| Sreet name | Count |
|---|
| HWY 14 | 6 | | HWY 281 | 6 | | US HWY 14 | 6 | | 199TH ST | 4 | | 207 ST | 4 | | 208TH ST 387 AVE | 4 | | 210 ST | 4 | | 38393 US HWY 14 | 4 | | 387 AVE | 4 | | US HWY 281 | 4 | | 100 COMMERCIAL AVE NE | 2 | | 181 MAPLE AVE SE | 2 | | 196TH ST | 2 | | 196TH ST AND US HWY 281 | 2 | | 198TH ST | 2 | | 19995 385TH AVE | 2 | | 20003 387 AVE | 2 | | 20380 393RD AVE | 2 | | 204TH ST | 2 | | 205 ST | 2 | | 205TH ST | 2 | | 206 ST | 2 | | 206TH ST | 2 | | 206TH ST AND 393 AVE | 2 | | 20840 391ST AVE | 2 |
| | | Fire incidents reported |
|---|
| Sreet name | Count |
|---|
| 208TH ST | 2 | | 211 ST | 2 | | 211 ST AND 391 AVE | 2 | | 21236 US HWY 281 | 2 | | 212TH ST | 2 | | 214TH ST | 2 | | 38223 203RD ST | 2 | | 383RD AVE | 2 | | 384 AVE | 2 | | 384TH AVE AND 206TH ST | 2 | | 386TH AVE | 2 | | 387 AVE | 2 | | 389 AVE | 2 | | 38978 202ND ST | 2 | | 390 AVE | 2 | | 390 AVE AND 210TH ST | 2 | | 39057 205TH ST | 2 | | 39079 200TH ST | 2 | | 39140 212TH ST | 2 | | 39246 206TH | 2 | | 39246 206TH ST | 2 | | 39259 201ST ST | 2 | | 393 AVE | 2 | | 39338 206TH ST | 2 | | |
|
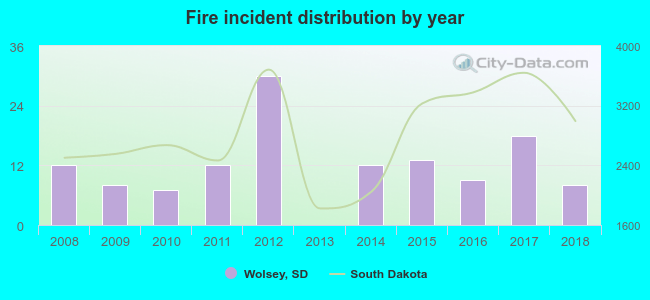 Based on the data from the years 2008 - 2018 the average number of fire incidents per year is 12. The highest number of reported fire incidents - 30 took place in 2012, and the least - 0 in 2013. The data has a declining trend.
 19.4% incidents where reported in the morning and 80.6% in the evening. The most fires (19.4%) took place on Thursday, and the least (10.9%) on Monday.
 Based on the 129 fire incidents from years 2008 - 2018 most fires (20.2%) took place during October, and the least (2.3%) in January.
 Out of all 164 cases reported during the years 2008 - 2018, the most belonged to the categories: Fire (78.7%), Service Call (7.3%), and Rescue & EMS (6.1%).
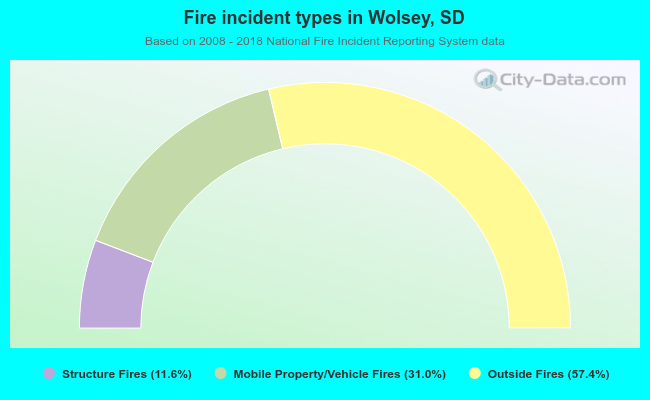 When looking into fire subcategories, the most incidents belonged to: Outside Fires (57.4%), and Mobile Property/Vehicle Fires (31.0%).