Wolverine: Fire Incidents, Michigan (MI)
Where are fire incidents reported in Wolverine, MI
Something went wrong! Please refresh the page.
|
| |||||||||||||||||||||||||||||||||||||||||||||||||||||||||||||||||||||||||||||||||||||||||||||||||||||||||||||
2002 - 2018 National Fire Incident Reporting System (NFIRS) incidents
- Incident types reported to NFIRS in Wolverine, MI
- 17938.4%Fire
- 12927.7%Rescue & EMS
- 10823.2%Hazardous Condition
- 255.4%Good Intent Call
- 112.4%False Alarm
- 91.9%Service Call
- 30.6%Special Incident
- 10.2%Overpressure Rupture
- 10.2%Severe Weather
- Fire incident types reported to NFIRS in Wolverine, MI
- 7743.0%Structure Fires
- 7139.7%Outside Fires
- 2312.8%Mobile Property/Vehicle Fires
- 84.5%Other
 According to the data from the years 2002 - 2018 the average number of fires per year is 11. The highest number of reported fire incidents - 29 took place in 2008, and the least - 0 in 2015. The data has a decreasing trend.
 26.3% incidents where reported in the morning and 73.7% in the evening. The most fires (19.6%) took place on Saturday, and the least (7.3%) on Sunday.
 According to the 179 incident reports from years 2002 - 2018 most fires (19.6%) took place during April, and the least (2.2%) in October.
 Out of all 466 cases reported during the years 2002 - 2018, the most belonged to the categories: Fire (38.4%), Rescue & EMS (27.7%), and Hazardous Condition (23.2%).
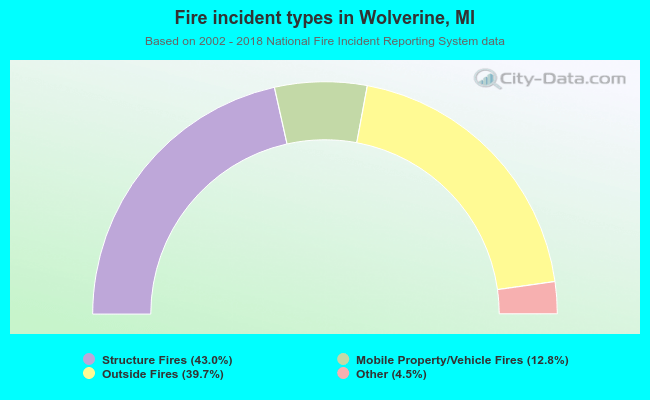 When looking into fire subcategories, the most incidents belonged to: Structure Fires (43.0%), and Outside Fires (39.7%).