Wood-Ridge: Fire Incidents, New Jersey (NJ)
Where are fire incidents reported in Wood-Ridge, NJ
Something went wrong! Please refresh the page.
|
| |||||||||||||||||||||||||||||||||||||||||||||||||||||||||||||||||||||||||||||||||||||||||||||||||||||||||||||
2002 - 2011 National Fire Incident Reporting System (NFIRS) incidents
- Incident types reported to NFIRS in Wood-Ridge, NJ
- 65474.0%Hazardous Condition
- 19321.8%Fire
- 171.9%False Alarm
- 121.4%Service Call
- 60.7%Good Intent Call
- 20.2%Rescue & EMS
- Fire incident types reported to NFIRS in Wood-Ridge, NJ
- 12263.2%Structure Fires
- 5025.9%Outside Fires
- 2010.4%Mobile Property/Vehicle Fires
- 10.5%Other
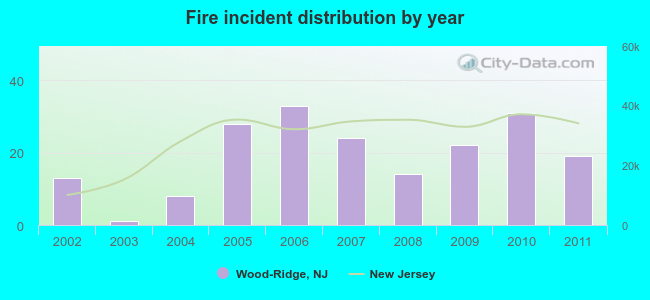 According to the data from the years 2002 - 2011 the average number of fires per year is 19. The highest number of fires - 33 took place in 2006, and the least - 1 in 2003. The data has a rising trend.
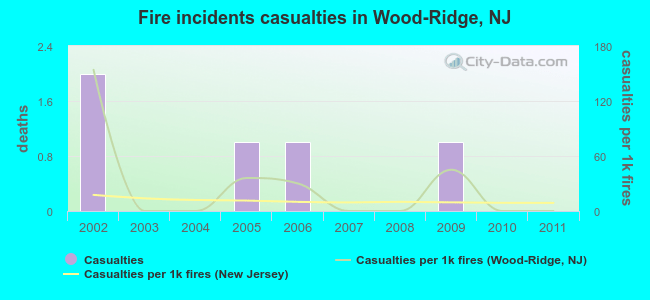 Based on the reports from the years 2002 - 2011 the average number of fire-related casualties per year is 1. The highest number of reported injuries - 2 took place in 2002, and the lowest - 0 in 2003. The data has a declining trend.
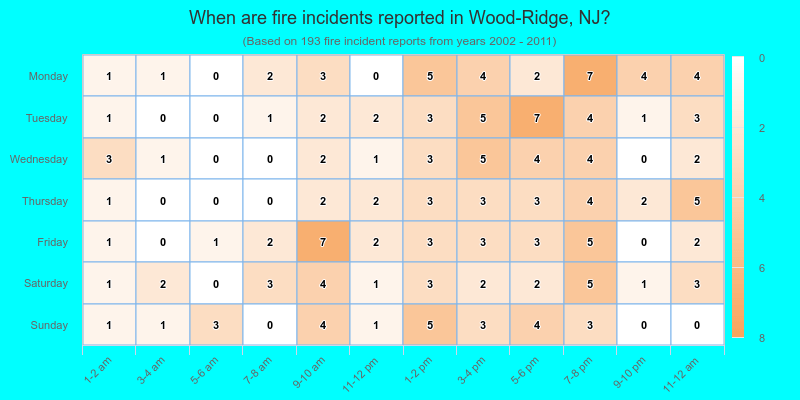
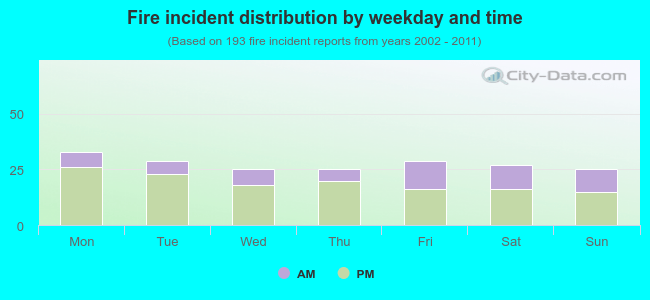 30.6% incidents where reported in the morning and 69.4% in the evening. The most fires (17.1%) took place on Monday, and the least (13.0%) on Wednesday.
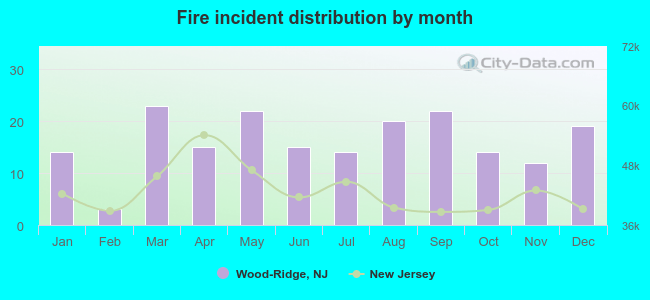 Based on the 193 incident reports from years 2002 - 2011 most fires (11.9%) took place during March, and the least (1.6%) in February.
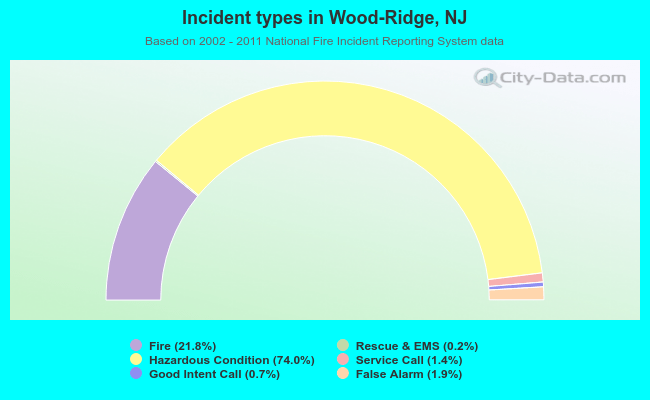 Out of all 884 cases reported during the years 2002 - 2011, the most belonged to the categories: Rescue & EMS (74.0%), Fire (21.8%), and Good Intent Call (1.9%).
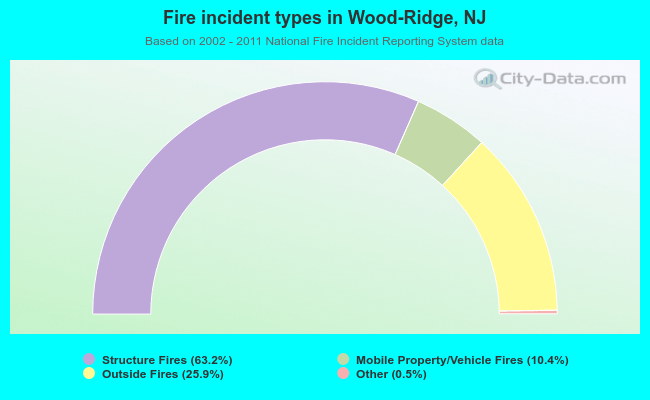 When looking into fire subcategories, the most incidents belonged to: Structure Fires (63.2%), and Outside Fires (25.9%).