Woodbine: Fire Incidents, Iowa (IA)
Where are fire incidents reported in Woodbine, IA
Something went wrong! Please refresh the page.
|
| |||||||||||||||||||||||||||||||||||||||||||||||||||||||||||||||||||||||||||||||||||||||||||||||||||||||||||||
2002 - 2018 National Fire Incident Reporting System (NFIRS) incidents
- Incident types reported to NFIRS in Woodbine, IA
- 20172.3%Fire
- 3914.0%Rescue & EMS
- 134.7%Hazardous Condition
- 82.9%Good Intent Call
- 82.9%False Alarm
- 51.8%Service Call
- 20.7%Severe Weather
- 20.7%Special Incident
- Fire incident types reported to NFIRS in Woodbine, IA
- 11959.2%Outside Fires
- 4823.9%Structure Fires
- 3014.9%Mobile Property/Vehicle Fires
- 42.0%Other
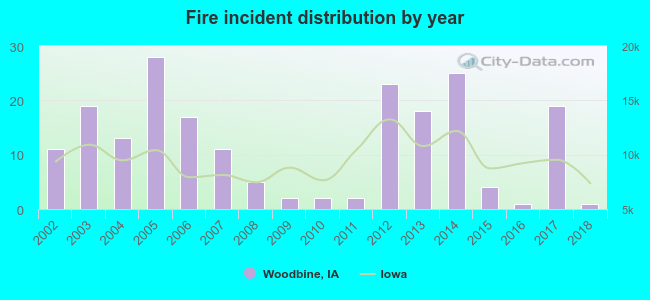 Based on the data from the years 2002 - 2018 the average number of fires per year is 12. The highest number of reported fires - 28 took place in 2005, and the least - 1 in 2016. The data has a declining trend.
 22.4% incidents where reported in the morning and 77.6% in the evening. The most fires (17.4%) took place on Saturday, and the least (9.0%) on Thursday.
 Based on the 201 fire incident reports from years 2002 - 2018 most fires (20.4%) took place during March, and the least (2.5%) in July.
 Out of all 278 cases reported during the years 2002 - 2018, the most belonged to the categories: Fire (72.3%), Overpressure Rupture (14.0%), and Rescue & EMS (4.7%).
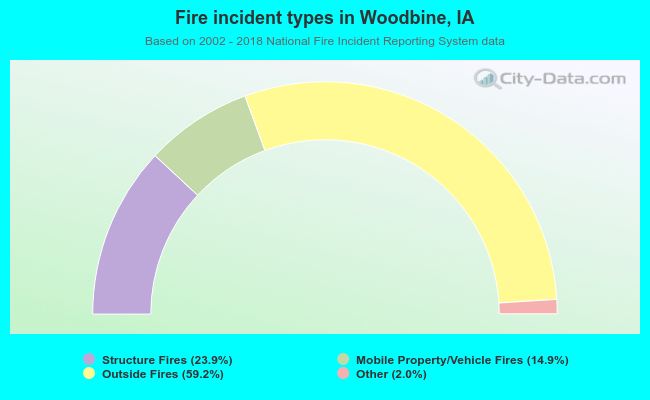 When looking into fire subcategories, the most reports belonged to: Outside Fires (59.2%), and Structure Fires (23.9%).