| Fire incidents reported |
|---|
| Sreet name | Count |
|---|
| DEHIRSCH AVE | 34 | | WASHINGTON AVE | 34 | | WEBSTER ST | 26 | | WASHINGTON AVE | 16 | | CLAY ST | 14 | | COUNTY 610 RT | 12 | | ADAMS AVE | 10 | | BRYANT ST | 8 | | FREEMONT AVE | 8 | | FREMONT AVE | 8 | | MADISON AVE | 8 | | SUMNER AVE | 8 | | BRYANT AVE | 6 | | FIDLER HILL RD | 6 | | FRANKLIN ST | 6 | | FREDRICKSTRADT AVE | 6 | | FREIDRIECHSTADT AVE | 6 | | GRANT AVE | 6 | | JEFFERSON AVE | 6 | | WASHINGTON | 6 | | 709 CLAY ST | 4 | | CALHOUN AVE | 4 | | CLAY STREET | 4 | | DEHIRSCH AVE | 4 | | GRANT AVE | 4 |
| | | Fire incidents reported |
|---|
| Sreet name | Count |
|---|
| HEAD OF RIVER RD | 4 | | HEAD OF THE RIVER RD | 4 | | HEILPRIN AVE | 4 | | JEFFERSON AVE | 4 | | SUMNER AVE | 4 | | TYLER RD | 4 | | TYLER RD | 4 | | WEBSTER AVE | 4 | | 1175 DEHIRSCH AVE | 2 | | 118 TYLER ROAD | 2 | | 130 WEBSTER AVE | 2 | | 14 PACIFIC AVE IN OCEAN WORLD | 2 | | 201 WEBSTER AVE | 2 | | 201 WEBSTER ST | 2 | | 201 WEBSTER ST E5 | 2 | | 201 WEBSTER STAPT G8 | 2 | | 202 DEHIRSH AVE | 2 | | 206 ADAMS AVE | 2 | | 209 FRANKLIN AVE | 2 | | 212 CALHOUN AVE | 2 | | 230 JEFFERSON AVE. | 2 | | 300 WASHINGTON AVE | 2 | | 301 JEFFERSON AVE | 2 | | 322 JACKSON AVE. | 2 | | |
|
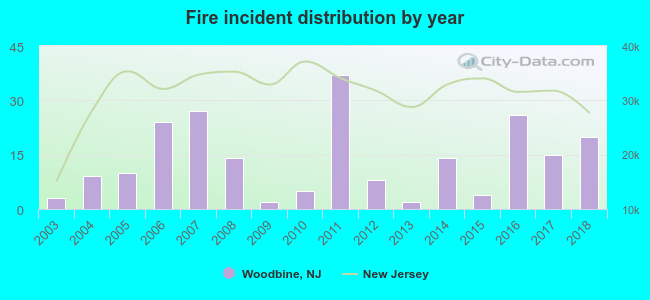 According to the data from the years 2003 - 2018 the average number of fires per year is 14. The highest number of fires - 37 took place in 2011, and the least - 2 in 2009. The data has a rising trend.
 33.6% incidents where reported in the morning and 66.4% in the evening. The most fires (19.1%) took place on Saturday, and the least (10.9%) on Tuesday.
 Based on the 220 reports from years 2003 - 2018 most fires (12.7%) took place during January, and the least (4.1%) in December.
 Out of all 705 cases reported during the years 2003 - 2018, the most belonged to the categories: Fire (31.2%), False Alarm (29.8%), and Hazardous Condition (19.1%).
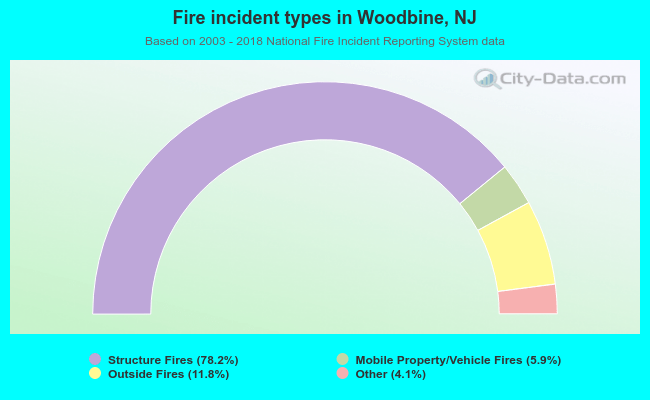 When looking into fire subcategories, the most incidents belonged to: Structure Fires (78.2%), and Outside Fires (11.8%).