Woodburn: Fire Incidents, Indiana (IN)
Where are fire incidents reported in Woodburn, IN
Something went wrong! Please refresh the page.
|
| |||||||||||||||||||||||||||||||||||||||||||||||||||||||||||||||||||||||||||||||||||||||||||||||||||||||||||||
| Other | 22 | |||||||||||||||||||||||||||||||||||||||||||||||||||||||||||||||||||||||||||||||||||||||||||||||||||||||||||||
2002 - 2017 National Fire Incident Reporting System (NFIRS) incidents
- Incident types reported to NFIRS in Woodburn, IN
- 34036.2%Fire
- 30032.0%Rescue & EMS
- 15716.7%Hazardous Condition
- 656.9%Service Call
- 555.9%Good Intent Call
- 141.5%False Alarm
- 50.5%Severe Weather
- 20.2%Special Incident
- Fire incident types reported to NFIRS in Woodburn, IN
- 17350.9%Outside Fires
- 11935.0%Structure Fires
- 298.5%Mobile Property/Vehicle Fires
- 195.6%Other
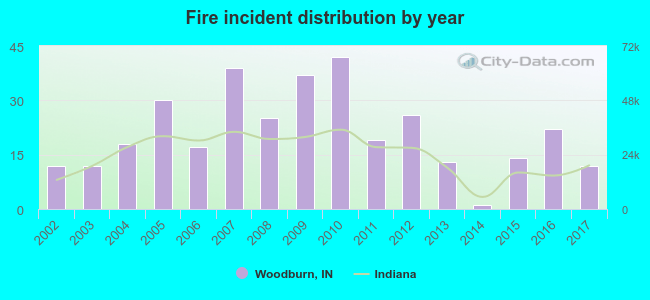 According to the data from the years 2002 - 2017 the average number of fires per year is 21. The highest number of reported fires - 42 took place in 2010, and the least - 1 in 2014. The data has a constant trend.
 26.5% incidents where reported in the morning and 73.5% in the evening. The most fires (17.1%) took place on Friday, and the least (9.4%) on Thursday.
 According to the 340 incident reports from years 2002 - 2017 most fires (13.5%) took place during April, and the least (2.9%) in January.
 Out of all 938 cases reported during the years 2002 - 2017, the most belonged to the categories: Fire (36.2%), Overpressure Rupture (32.0%), and Rescue & EMS (16.7%).
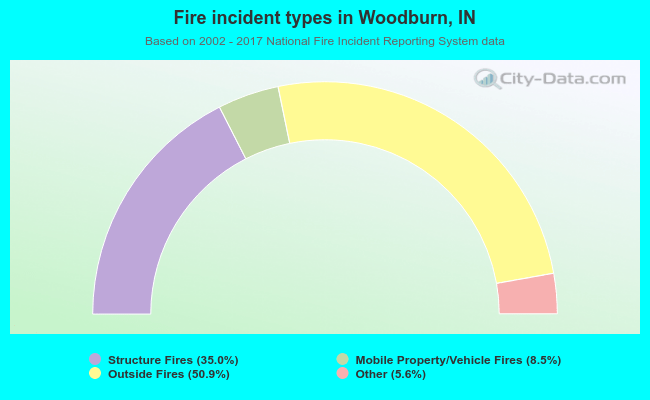 When looking into fire subcategories, the most incidents belonged to: Outside Fires (50.9%), and Structure Fires (35.0%).