Woodland: Fire Incidents, Michigan (MI)
Where are fire incidents reported in Woodland, MI
Something went wrong! Please refresh the page.
|
| |||||||||||||||||||||||||||||||||||||||||||||||||||||||||||||||||||||||||||||||||||||||||||||||||||||||||||||
2002 - 2018 National Fire Incident Reporting System (NFIRS) incidents
- Incident types reported to NFIRS in Woodland, MI
- 38153.9%Rescue & EMS
- 19627.7%Fire
- 7310.3%Hazardous Condition
- 304.2%Good Intent Call
- 162.3%False Alarm
- 91.3%Service Call
- 20.3%Severe Weather
- Fire incident types reported to NFIRS in Woodland, MI
- 10855.1%Structure Fires
- 6633.7%Outside Fires
- 168.2%Mobile Property/Vehicle Fires
- 63.1%Other
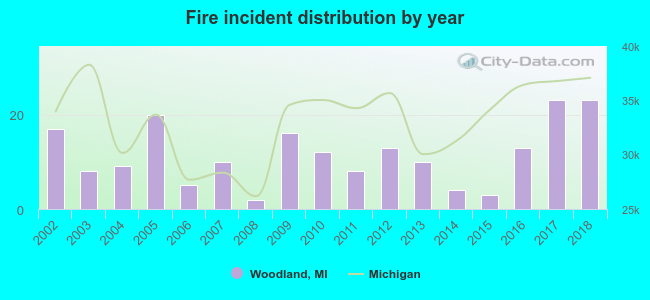 Based on the data from the years 2002 - 2018 the average number of fire incidents per year is 12. The highest number of reported fire incidents - 23 took place in 2017, and the least - 2 in 2008. The data has an increasing trend.
 33.7% incidents where reported in the morning and 66.3% in the evening. The most fires (18.4%) took place on Monday, and the least (10.2%) on Thursday.
 Based on the 196 fire incidents from years 2002 - 2018 most fires (22.4%) took place during April, and the least (1.0%) in August.
 Out of all 707 cases reported during the years 2002 - 2018, the most belonged to the categories: Overpressure Rupture (53.9%), Fire (27.7%), and Rescue & EMS (10.3%).
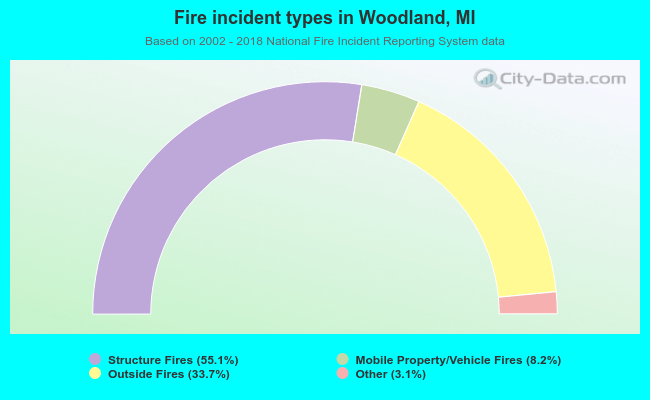 When looking into fire subcategories, the most reports belonged to: Structure Fires (55.1%), and Outside Fires (33.7%).