Woodlynne: Fire Incidents, New Jersey (NJ)
Where are fire incidents reported in Woodlynne, NJ
Something went wrong! Please refresh the page.
|
| |||||||||||||||||||||||||||||||||||||||||||||||||||||||||||||||||||||||||||||||||||||
2002 - 2018 National Fire Incident Reporting System (NFIRS) incidents
- Incident types reported to NFIRS in Woodlynne, NJ
- 21644.5%Hazardous Condition
- 17636.3%Fire
- 5210.7%Good Intent Call
- 204.1%False Alarm
- 163.3%Service Call
- 51.0%Rescue & EMS
- Fire incident types reported to NFIRS in Woodlynne, NJ
- 12068.2%Structure Fires
- 3117.6%Outside Fires
- 137.4%Mobile Property/Vehicle Fires
- 126.8%Other
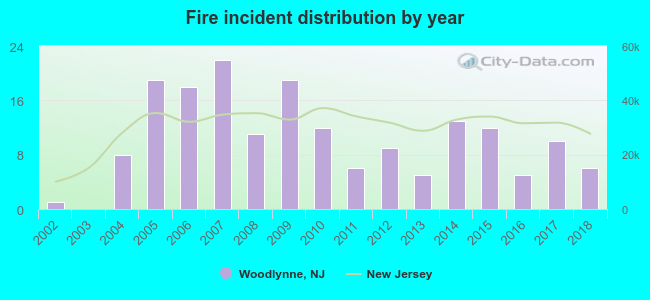 Based on the data from the years 2002 - 2018 the average number of fire incidents per year is 10. The highest number of reported fires - 22 took place in 2007, and the least - 0 in 2003. The data has an increasing trend.
 34.7% incidents where reported in the morning and 65.3% in the evening. The most fires (19.9%) took place on Monday, and the least (9.1%) on Thursday.
 Based on the 176 incident reports from years 2002 - 2018 most fires (15.3%) took place during August, and the least (2.3%) in July.
 Out of all 485 cases reported during the years 2002 - 2018, the most belonged to the categories: Rescue & EMS (44.5%), Fire (36.3%), and Service Call (10.7%).
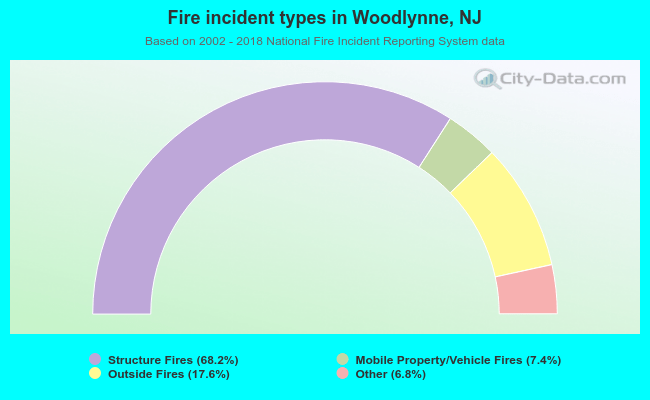 When looking into fire subcategories, the most reports belonged to: Structure Fires (68.2%), and Outside Fires (17.6%).