Woodway: Fire Incidents, Texas (TX)
Where are fire incidents reported in Woodway, TX
Something went wrong! Please refresh the page.
|
| |||||||||||||||||||||||||||||||||||||||||||||||||||||||||||||||||||||||||||||||||||||||||||||||||||||||||||||
2002 - 2018 National Fire Incident Reporting System (NFIRS) incidents
- Incident types reported to NFIRS in Woodway, TX
- 21531.5%Fire
- 17525.6%False Alarm
- 16123.6%Hazardous Condition
- 679.8%Good Intent Call
- 365.3%Rescue & EMS
- 233.4%Service Call
- 30.4%Special Incident
- 20.3%Severe Weather
- 10.1%Overpressure Rupture
- Fire incident types reported to NFIRS in Woodway, TX
- 8439.1%Outside Fires
- 7936.7%Structure Fires
- 2712.6%Mobile Property/Vehicle Fires
- 2511.6%Other
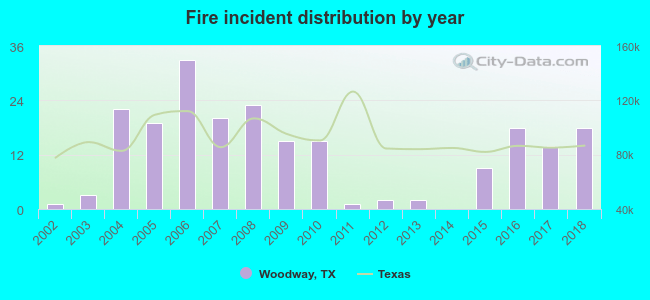 According to the data from the years 2002 - 2018 the average number of fires per year is 13. The highest number of reported fires - 33 took place in 2006, and the least - 0 in 2014. The data has an increasing trend.
The average number of yearly fire incidents per 10k residents in Woodway, TX compared to nearest cities:
(Note: Based on data for the last 3 years, including only cities with population 5,000 and above)
| Woodway: | 19.0 |
| Hewitt: | 17.6 |
| Waco: | 45.7 |
| Robinson: | 44.1 |
| Bellmead: | 92.3 |
| McGregor: | 8.6 |
| Elm Mott: | 69.7 |
| Marlin: | 62.7 |
| Temple: | 47.9 |
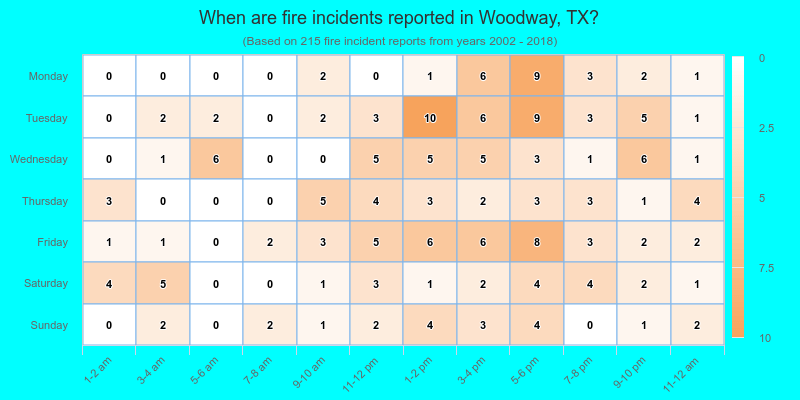
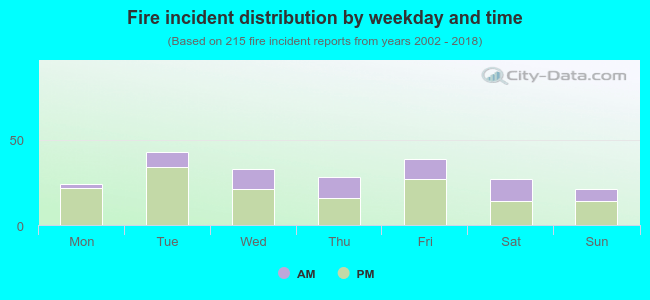 31.2% incidents where reported in the morning and 68.8% in the evening. The most fires (20.0%) took place on Tuesday, and the least (9.8%) on Sunday.
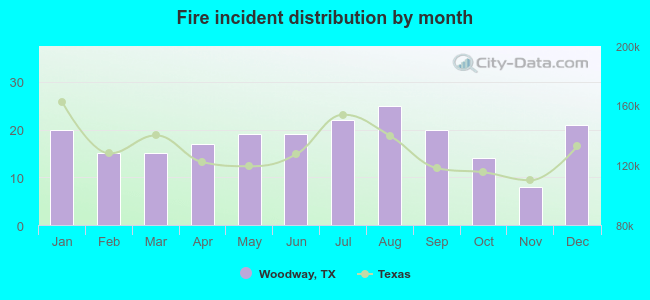 Based on the 215 fire incident reports from years 2002 - 2018 most fires (11.6%) took place during August, and the least (3.7%) in November.
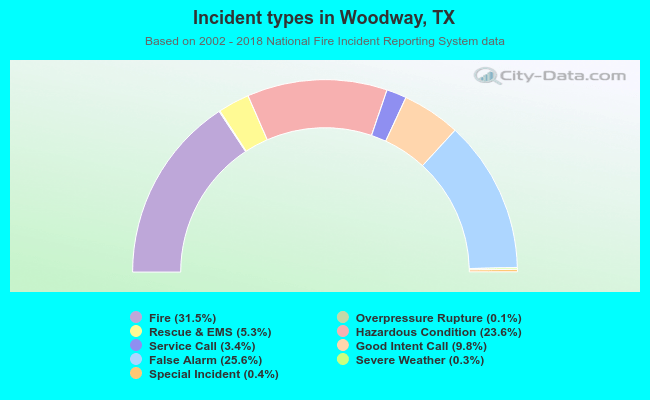 Out of all 683 cases reported during the years 2002 - 2018, the most belonged to the categories: Fire (31.5%), False Alarm (25.6%), and Hazardous Condition (23.6%).
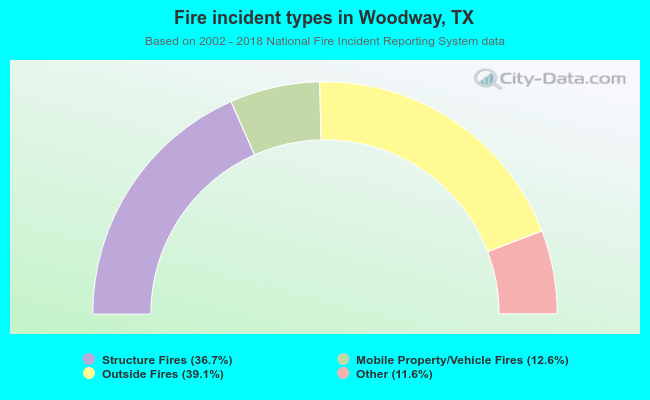 When looking into fire subcategories, the most incidents belonged to: Outside Fires (39.1%), and Structure Fires (36.7%).