| Fire incidents reported |
|---|
| Sreet name | Count |
|---|
| HWY 285 | 24 | | SHAWBRIDGE ROAD | 24 | | PATTON | 22 | | HWY 225 | 18 | | SPRINGFIELD ROAD | 18 | | CHURCH CIRCLE | 16 | | HWY 25 | 16 | | UNION | 16 | | ARROWHEAD ROAD | 14 | | CADRON DRIVE | 14 | | FOX RUN | 14 | | HWY 285 NORTH | 12 | | SHAWBRIDGE | 12 | | BURKETT FLAT ROAD | 10 | | ELLIOTT ROAD | 10 | | HORSESHOE DRIVE | 10 | | PILGRIM REST RD | 10 | | TORRO PARK CIRCLE | 10 | | WATSON DRIVE | 10 | | BURGESS ROAD | 8 | | HANKINS ROAD | 8 | | SHAW BRIDGE | 8 | | WEST CADRON RIDGE DRIVE | 8 | | COLT LOOP | 6 | | ECHOLS COVE | 6 |
| | | Fire incidents reported |
|---|
| Sreet name | Count |
|---|
| GARRISON ROAD | 6 | | GREENVALLEY | 6 | | KEATHLEY ROAD | 6 | | UNION ROAD | 6 | | WESTERN HILLLS CIRCLE | 6 | | BRANNON ROAD | 4 | | BURCHFIELD ROAD | 4 | | BURKETT FLATT RD RD | 4 | | CADRON | 4 | | COLLIER DRIVE | 4 | | CORBIN | 4 | | EAST HORSESHOE DRIVE | 4 | | FLORINE | 4 | | FRIENDSHIP ROAD | 4 | | HARBOR | 4 | | HARGROVE LANE | 4 | | HUNTINGTON DRIVE | 4 | | HWY 124 | 4 | | JUSTIN | 4 | | MILLER | 4 | | MILLER ROAD | 4 | | MOUNTAIN GROVE ROAD | 4 | | NORTH HILLS | 4 | | PILGRIM REST | 4 | | |
|
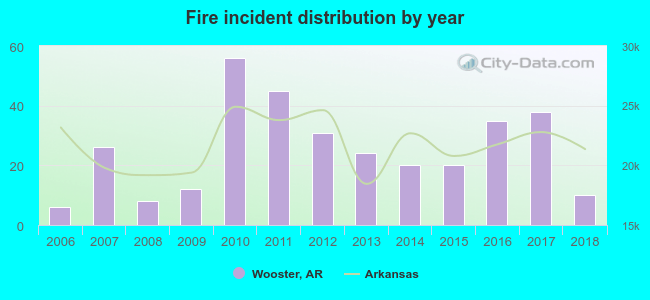 According to the data from the years 2006 - 2018 the average number of fire incidents per year is 25. The highest number of reported fire incidents - 56 took place in 2010, and the least - 6 in 2006. The data has an increasing trend.
 22.4% incidents where reported in the morning and 77.6% in the evening. The most fires (21.8%) took place on Saturday, and the least (10.9%) on Wednesday.
 Based on the 331 fires from years 2006 - 2018 most fires (14.8%) took place during February, and the least (3.3%) in May.
 Out of all 792 cases reported during the years 2006 - 2018, the most belonged to the categories: Fire (41.8%), Rescue & EMS (41.3%), and Good Intent Call (8.6%).
 When looking into fire subcategories, the most incidents belonged to: Outside Fires (65.9%), and Structure Fires (26.9%).