Worcester: Fire Incidents, Massachusetts (MA)
Where are fire incidents reported in Worcester, MA
Something went wrong! Please refresh the page.
| Fire incidents reported | |
|---|---|
| Sreet name | Count |
| MAIN ST | 2,700 |
| PLEASANT ST | 1,186 |
| PLANTATION ST | 1,038 |
| LINCOLN ST | 956 |
| BELMONT ST | 864 |
| CHANDLER ST | 680 |
| CONSTITUTION AV | 570 |
| GRAFTON ST | 560 |
| SEVER ST | 548 |
| PARK AV | 544 |
| SALISBURY ST | 534 |
| COUNTRY CLUB BLVD | 504 |
| FRANK ST | 448 |
| GREAT BROOK VALLEY A | 440 |
| FRANKLIN ST | 436 |
| W BOYLSTON ST | 436 |
| VERNON ST | 414 |
| TACOMA ST | 412 |
| SHREWSBURY ST | 408 |
| SOUTHBRIDGE ST | 406 |
| BURNCOAT ST | 390 |
| MILL ST | 352 |
| COLLEGE ST | 348 |
| PROVIDENCE ST | 332 |
| CHINO AV | 328 |
| GROVE ST | 320 |
| ELM ST | 304 |
| MILLBURY ST | 302 |
| GIBBS ST | 280 |
| AUSTIN ST | 268 |
| Other | 9,212 |
2002 - 2018 National Fire Incident Reporting System (NFIRS) incidents
- Incident types reported to NFIRS in Worcester, MA
- 119,31260.6%Rescue & EMS
- 26,52013.5%Fire
- 15,9758.1%False Alarm
- 14,3717.3%Hazardous Condition
- 12,4926.3%Good Intent Call
- 7,7884.0%Service Call
- Fire incident types reported to NFIRS in Worcester, MA
- 11,48343.3%Structure Fires
- 7,84629.6%Outside Fires
- 5,20119.6%Other
- 1,9907.5%Mobile Property/Vehicle Fires
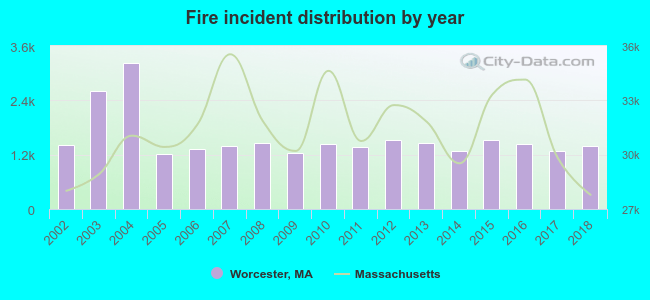 Based on the data from the years 2002 - 2018 the average number of fires per year is 1,560. The highest number of reported fire incidents - 3,214 took place in 2004, and the least - 1,207 in 2005. The data has a decreasing trend.
The average number of yearly fire incidents per 10k residents in Worcester, MA compared to nearest cities:
(Note: Based on data for the last 3 years, including only cities with population 5,000 and above)
| Worcester: | 74.5 |
| Shrewsbury: | 35.5 |
| Auburn: | 39.3 |
| Millbury: | 51.5 |
| Holden: | 19.8 |
| Leicester: | 33.7 |
| West Boylston: | 39.6 |
| Grafton: | 8.1 |
| Northborough: | 77.8 |
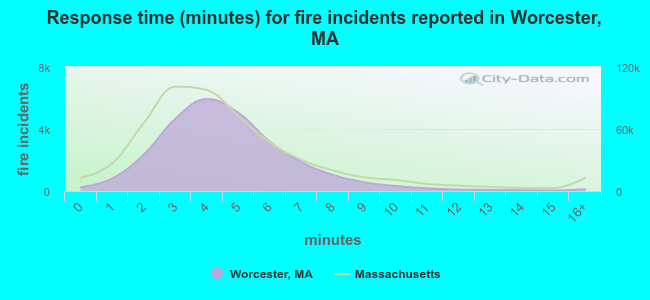 The median response time based on all reported fire incidents is 4 minutes. This is similar to the Massachusetts median value.
The median response time in Worcester, MA compared to nearest cities:
(Note: Based on data for all years, including only cities with at least 500 fire incidents)
| Worcester: | 4 minutes |
| Shrewsbury: | 4 minutes |
| Auburn: | 4 minutes |
| Millbury: | 6 minutes |
| Holden: | 6 minutes |
| Leicester: | 5 minutes |
| Northborough: | 6 minutes |
| Westborough: | 5 minutes |
| Sutton: | 8 minutes |
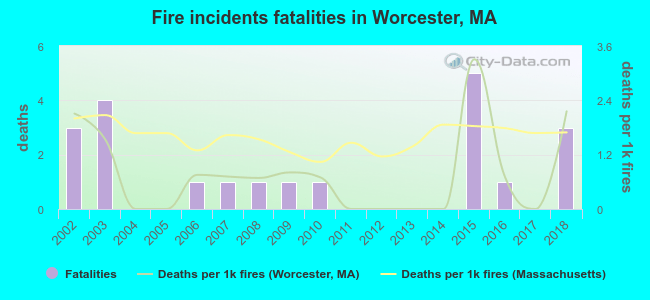 According to the data from the years 2002 - 2018 the average number of fire-related yearly deaths is 1. The highest number of reported deaths - 5 took place in 2015, and the lowest - 0 in 2004. The data has a constant trend.
The average number of fatalities per 1,000 fires is 1. This indicator was the highest - 3 in 2015, and the lowest 0 in 2004. The trend for deaths per 1,000 fire incidents is rising. Compared to the Massachusetts value the number of fatalities per 1,000 fire incidents is lower.
According to the data from the years 2002 - 2018 the average number of fire-related yearly deaths is 1. The highest number of reported deaths - 5 took place in 2015, and the lowest - 0 in 2004. The data has a constant trend.
The average number of fatalities per 1,000 fires is 1. This indicator was the highest - 3 in 2015, and the lowest 0 in 2004. The trend for deaths per 1,000 fire incidents is rising. Compared to the Massachusetts value the number of fatalities per 1,000 fire incidents is lower.Deaths per 1,000 incidents in Worcester, MA compared to nearest cities:
(Note: Based on data for all years, including only cities with at least 2,500 fire incidents)
| Worcester: | 0.8 |
| Leominster: | 1.3 |
| Framingham: | 0.5 |
| Fitchburg: | 1.9 |
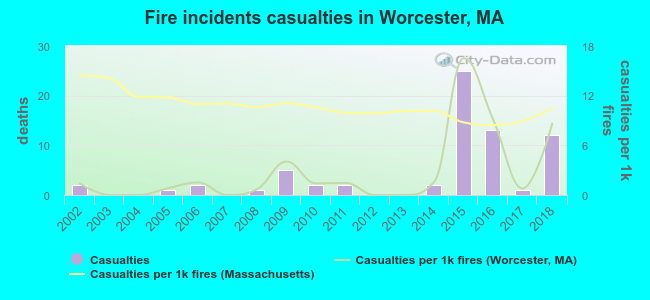 Based on the reports from the years 2002 - 2018 the average number of fire-related casualties per year is 4. The highest number of casualties - 25 took place in 2015, and the lowest - 0 in 2003. The data has a rising trend.
The average number of casualties per 1,000 fire incidents is 3. This indicator was the highest - 17 in 2015, and the lowest 0 in 2003. The trend for injuries per 1,000 fires is rising. Compared to the state value the number of injuries per 1,000 fires is much lower.
Based on the reports from the years 2002 - 2018 the average number of fire-related casualties per year is 4. The highest number of casualties - 25 took place in 2015, and the lowest - 0 in 2003. The data has a rising trend.
The average number of casualties per 1,000 fire incidents is 3. This indicator was the highest - 17 in 2015, and the lowest 0 in 2003. The trend for injuries per 1,000 fires is rising. Compared to the state value the number of injuries per 1,000 fires is much lower.Casualties per 1,000 incidents in Worcester, MA compared to nearest cities:
(Note: Based on data for all years, including only cities with at least 500 fire incidents)
| Worcester: | 2.6 |
| Shrewsbury: | 3.4 |
| Auburn: | 2.5 |
| Millbury: | 23.2 |
| Holden: | 15.1 |
| Leicester: | 11.9 |
| Northborough: | 18.2 |
| Westborough: | 10.5 |
| Sutton: | 0.0 |
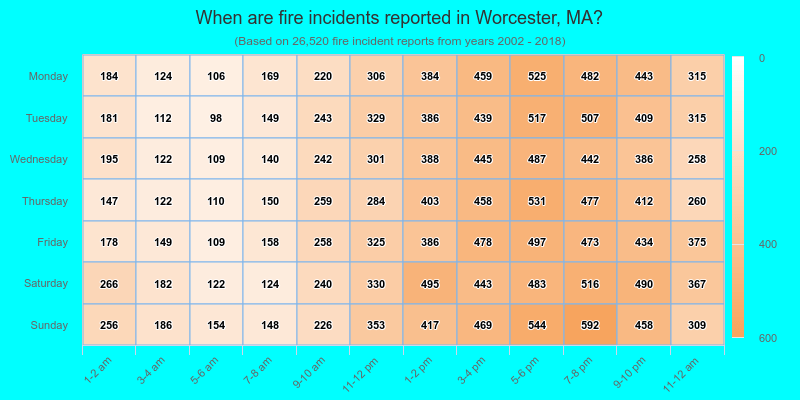
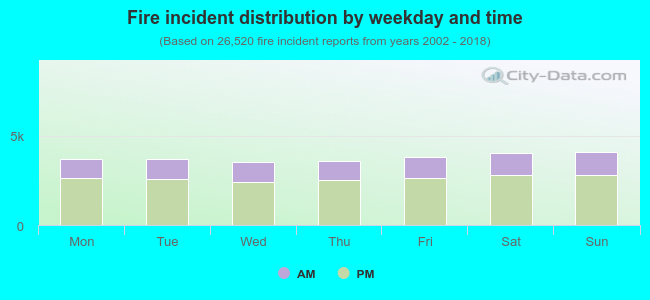 30.8% incidents where reported in the morning and 69.2% in the evening. The most fires (15.5%) took place on Sunday, and the least (13.3%) on Wednesday.
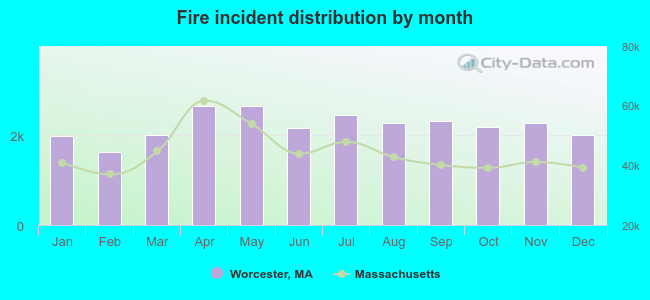 Based on the 26,520 fires from years 2002 - 2018 most fires (10.0%) took place during April, and the least (6.1%) in February.
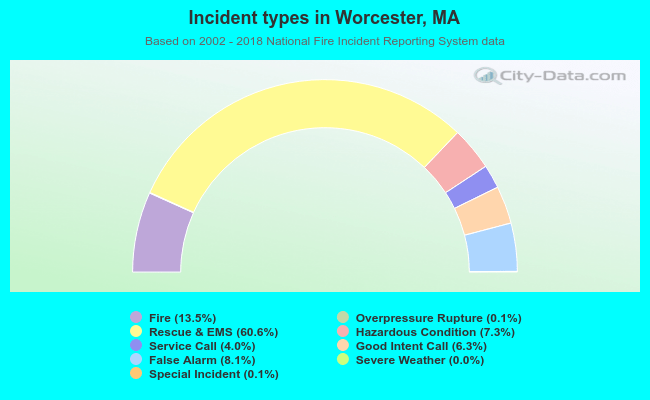 Out of all 196,751 cases reported during the years 2002 - 2018, the most belonged to the categories: Rescue & EMS (60.6%), Fire (13.5%), and False Alarm (8.1%).
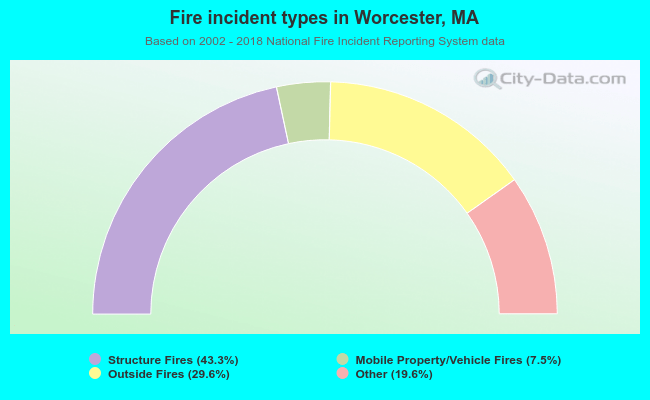 When looking into fire subcategories, the most incidents belonged to: Structure Fires (43.3%), and Outside Fires (29.6%).