Worthington: Fire Incidents, Indiana (IN)
Where are fire incidents reported in Worthington, IN
Something went wrong! Please refresh the page.
|
| |||||||||||||||||||||||||||||||||||||||||||||||||||||||||||||||||||||||||||||||||||||||||||||||||||||||||||||
| Other | 4 | |||||||||||||||||||||||||||||||||||||||||||||||||||||||||||||||||||||||||||||||||||||||||||||||||||||||||||||
2003 - 2018 National Fire Incident Reporting System (NFIRS) incidents
- Incident types reported to NFIRS in Worthington, IN
- 19937.8%Hazardous Condition
- 15830.0%Rescue & EMS
- 14226.9%Fire
- 112.1%Good Intent Call
- 81.5%Service Call
- 40.8%Special Incident
- 30.6%False Alarm
- 20.4%Overpressure Rupture
- Fire incident types reported to NFIRS in Worthington, IN
- 6847.9%Structure Fires
- 5941.5%Outside Fires
- 139.2%Mobile Property/Vehicle Fires
- 21.4%Other
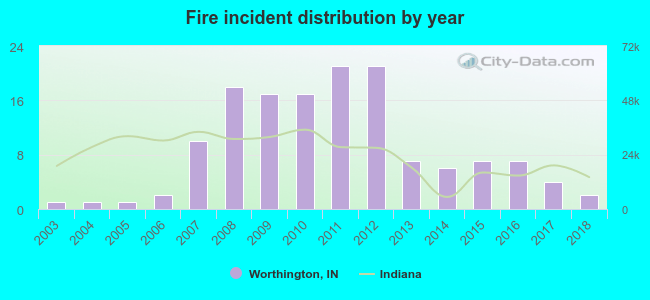 According to the data from the years 2003 - 2018 the average number of fires per year is 9. The highest number of reported fires - 21 took place in 2011, and the least - 1 in 2003. The data has a growing trend.
 21.1% incidents where reported in the morning and 78.9% in the evening. The most fires (26.1%) took place on Saturday, and the least (6.3%) on Monday.
 According to the 142 fire incident reports from years 2003 - 2018 most fires (16.2%) took place during March, and the least (2.1%) in October.
 Out of all 527 cases reported during the years 2003 - 2018, the most belonged to the categories: Hazardous Condition (37.8%), Rescue & EMS (30.0%), and Fire (26.9%).
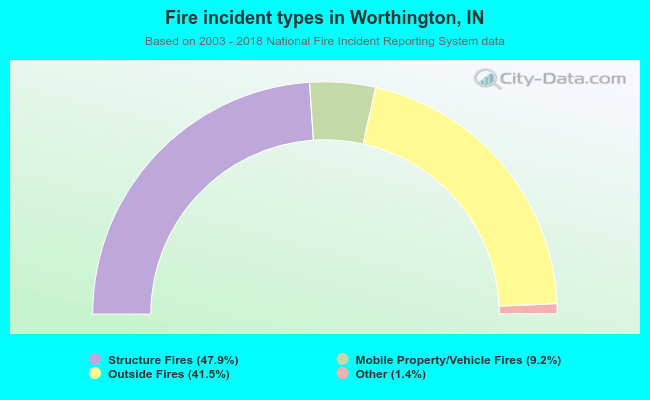 When looking into fire subcategories, the most reports belonged to: Structure Fires (47.9%), and Outside Fires (41.5%).