Wyandotte: Fire Incidents, Oklahoma (OK)
Where are fire incidents reported in Wyandotte, OK
Something went wrong! Please refresh the page.
|
| |||||||||||||||||||||||||||||||||||||||||||||||||||||||||||||||||||||||||||||||||||||||||||||||||||||||||||||
| Other | 44 | |||||||||||||||||||||||||||||||||||||||||||||||||||||||||||||||||||||||||||||||||||||||||||||||||||||||||||||
2004 - 2018 National Fire Incident Reporting System (NFIRS) incidents
- Incident types reported to NFIRS in Wyandotte, OK
- 1,66178.6%Rescue & EMS
- 22610.7%Fire
- 1336.3%Service Call
- 562.6%Good Intent Call
- 331.6%False Alarm
- 30.1%Hazardous Condition
- Fire incident types reported to NFIRS in Wyandotte, OK
- 15869.9%Outside Fires
- 4620.4%Structure Fires
- 135.8%Mobile Property/Vehicle Fires
- 94.0%Other
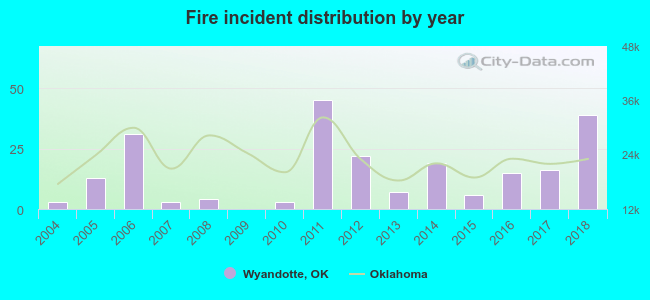 According to the data from the years 2004 - 2018 the average number of fire incidents per year is 15. The highest number of fire incidents - 45 took place in 2011, and the least - 0 in 2009. The data has a rising trend.
 23.5% incidents where reported in the morning and 76.5% in the evening. The most fires (18.6%) took place on Thursday, and the least (6.6%) on Friday.
 Based on the 226 fire incident reports from years 2004 - 2018 most fires (17.3%) took place during March, and the least (2.7%) in May.
 Out of all 2,114 cases reported during the years 2004 - 2018, the most belonged to the categories: Overpressure Rupture (78.6%), Fire (10.7%), and Hazardous Condition (6.3%).
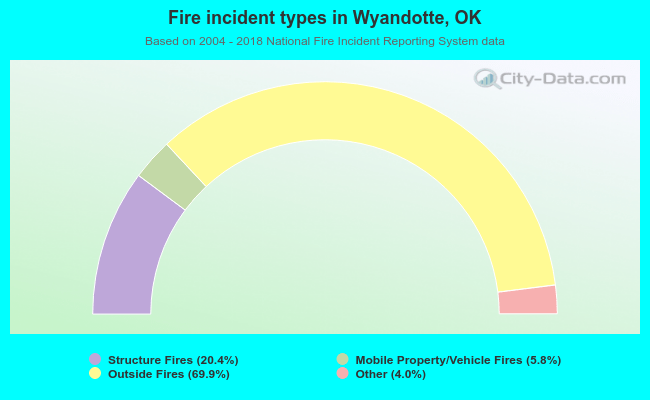 When looking into fire subcategories, the most incidents belonged to: Outside Fires (69.9%), and Structure Fires (20.4%).