| Fire incidents reported |
|---|
| Sreet name | Count |
|---|
| BOXWOOD RD | 10 | | UNKNOWN | 8 | | ARBOR RD | 6 | | BUTTONWOOD RD | 6 | | CAMPGROUND LN | 6 | | LEADTREE LANE | 6 | | ROYAL PALM RD | 6 | | APPLE LANE | 4 | | CHURCH ST | 4 | | FAIRFIELD RD | 4 | | FICUS LN | 4 | | HWY 50 HWY | 4 | | MAHOGANY RD | 4 | | XENIAIOLA RD | 4 | | 101 E SOUTHEAST ST | 2 | | 11899 HWY 50 HWY | 2 | | 149CR1715N | 2 | | 1625CR100EAST | 2 | | 1ST CURVE INTO WAYNE CO. | 2 | | 2042 CR 490 | 2 | | 212 NORTHMAIN ST | 2 | | 2162 CO RD 490 E | 2 | | 233 CR 1715 N | 2 | | 2ND ST | 2 | | 302 CO RD 2200N | 2 |
| | | Fire incidents reported |
|---|
| Sreet name | Count |
|---|
| 303 CHERRYBARK LN ST | 2 | | 356 CR 2100N | 2 | | 425 CH 18 | 2 | | 451 ROYAL PALM RD | 2 | | 652 COTTONWOOD | 2 | | 668 SHORTLEAF RD | 2 | | 71 CR 220 N | 2 | | 760 FIR LN | 2 | | 798PHEASANT RD RD | 2 | | 799 OLD HWY 50 HWY | 2 | | ASH DR | 2 | | ASH LN | 2 | | BOXWOOD | 2 | | BUTTERFLY DR | 2 | | CAMPGROUND LANECAMEL RD | 2 | | CAMPGROUND LN & MAHOGANY RD | 2 | | CAMPGROUND RD | 2 | | CAMPGROUND&SAND PINE RD | 2 | | CH16 115E | 2 | | CHERRYBARK LN | 2 | | CHICKADEE RD | 2 | | CO HWY 13 | 2 | | COON CREEK LN | 2 | | COONCREEK RD | 2 | | |
|
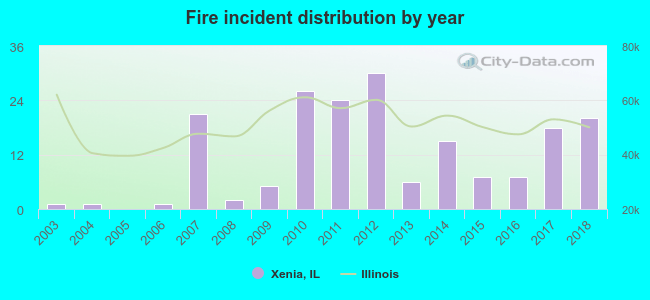 According to the data from the years 2003 - 2018 the average number of fire incidents per year is 12. The highest number of fires - 30 took place in 2012, and the least - 0 in 2005. The data has a growing trend.
 25.5% incidents where reported in the morning and 74.5% in the evening. The most fires (19.0%) took place on Thursday, and the least (10.9%) on Tuesday.
 According to the 184 incident reports from years 2003 - 2018 most fires (21.7%) took place during March, and the least (3.3%) in December.
 Out of all 581 cases reported during the years 2003 - 2018, the most belonged to the categories: Overpressure Rupture (59.2%), Fire (31.7%), and Service Call (2.9%).
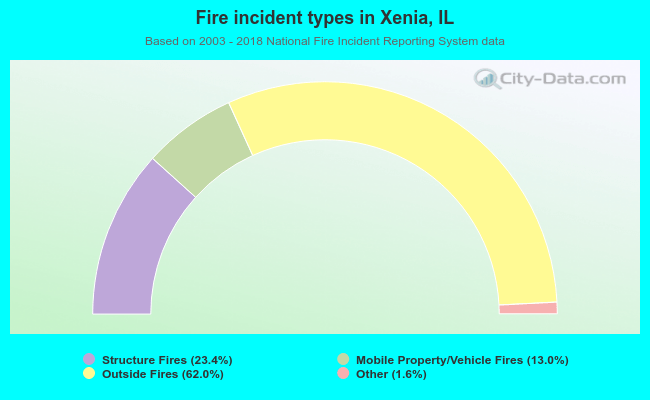 When looking into fire subcategories, the most incidents belonged to: Outside Fires (62.0%), and Structure Fires (23.4%).