Zanesville: Fire Incidents, Ohio (OH)
Where are fire incidents reported in Zanesville, OH
Something went wrong! Please refresh the page.
| Fire incidents reported | |
|---|---|
| Sreet name | Count |
| MAPLE AVE | 314 |
| PUTNAM AVE | 182 |
| LINDEN AVE | 138 |
| MAIN ST | 134 |
| ADAMSVILLE RD | 132 |
| MOXAHALA AVE | 128 |
| RIDGE AVE | 122 |
| EAST PIKE | 114 |
| GREENWOOD AVE | 114 |
| PINE ST | 112 |
| BRIGHTON BLVD | 106 |
| NEWARK RD | 98 |
| DRYDEN RD | 96 |
| LUCK AVE | 96 |
| EAST PIKE HWY | 92 |
| MAYSVILLE PIKE | 92 |
| RIVER RD | 88 |
| COOPERMILL RD | 82 |
| STATE ST | 78 |
| WHEELING AVE | 68 |
| ADAMS LANE | 66 |
| MARKET ST | 66 |
| MEAD ST | 64 |
| MAYSVILLE AVE | 62 |
| CHANDLERSVILLE RD | 60 |
| DRESDEN RD | 58 |
| WOODLAWN AVE | 58 |
| RIDGE RD | 56 |
| BOGGS RD | 54 |
| BROOKSIDE DR | 54 |
| Other | 2,093 |
2002 - 2018 National Fire Incident Reporting System (NFIRS) incidents
- Incident types reported to NFIRS in Zanesville, OH
- 16,06252.5%Rescue & EMS
- 5,07716.6%Fire
- 4,05813.3%Hazardous Condition
- 2,1066.9%Good Intent Call
- 1,6345.3%False Alarm
- 1,5845.2%Service Call
- 570.2%Overpressure Rupture
- Fire incident types reported to NFIRS in Zanesville, OH
- 2,32145.7%Structure Fires
- 1,71933.9%Outside Fires
- 1,00519.8%Mobile Property/Vehicle Fires
- 320.6%Other
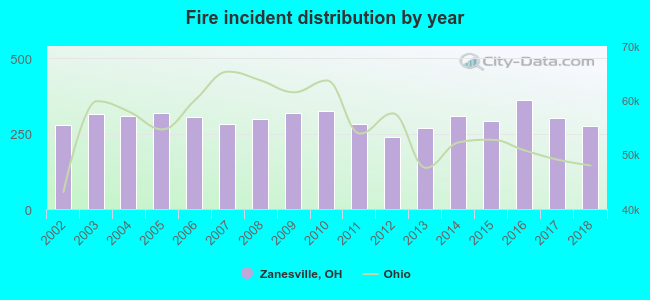 Based on the data from the years 2002 - 2018 the average number of fires per year is 299. The highest number of reported fires - 360 took place in 2016, and the least - 237 in 2012. The data has a decreasing trend.
 The median response time based on all reported fire incidents is 5 minutes. This is lower than the state median value.
The median response time in Zanesville, OH compared to nearest cities:
(Note: Based on data for all years, including only cities with at least 500 fire incidents)
| Zanesville: | 5 minutes |
| Roseville: | 10 minutes |
| Crooksville: | 11 minutes |
| Somerset: | 11 minutes |
| New Lexington: | 11 minutes |
| Thornville: | 10 minutes |
| Newark: | 6 minutes |
| Cambridge: | 6 minutes |
| Heath: | 6 minutes |
 Based on the data from the years 2002 - 2018 the average number of fire-related fatalities per year is 1. The highest number of deaths - 5 took place in 2004, and the lowest - 0 in 2005. The data has a declining trend.
The average number of fatalities per 1,000 fires is 3. This indicator was the highest - 16 in 2004, and the lowest 0 in 2005. The trend for deaths per 1,000 incidents is decreasing. Compared to the Ohio value the number of deaths per 1,000 incidents is higher.
Based on the data from the years 2002 - 2018 the average number of fire-related fatalities per year is 1. The highest number of deaths - 5 took place in 2004, and the lowest - 0 in 2005. The data has a declining trend.
The average number of fatalities per 1,000 fires is 3. This indicator was the highest - 16 in 2004, and the lowest 0 in 2005. The trend for deaths per 1,000 incidents is decreasing. Compared to the Ohio value the number of deaths per 1,000 incidents is higher.Deaths per 1,000 incidents in Zanesville, OH compared to nearest cities:
(Note: Based on data for all years, including only cities with at least 2,500 fire incidents)
| Zanesville: | 3.0 |
| Newark: | 1.5 |
 According to the data from the years 2002 - 2018 the average number of fire-related yearly casualties is 5. The highest number of reported injuries - 18 took place in 2007, and the lowest - 0 in 2014. The data has a dropping trend.
The average number of injuries per 1,000 fire incidents is 17. This indicator was the highest - 64 in 2007, and the lowest 0 in 2014. The trend for casualties per 1,000 incidents is declining. Compared to the state value the number of casualties per 1,000 fires is similar.
According to the data from the years 2002 - 2018 the average number of fire-related yearly casualties is 5. The highest number of reported injuries - 18 took place in 2007, and the lowest - 0 in 2014. The data has a dropping trend.
The average number of injuries per 1,000 fire incidents is 17. This indicator was the highest - 64 in 2007, and the lowest 0 in 2014. The trend for casualties per 1,000 incidents is declining. Compared to the state value the number of casualties per 1,000 fires is similar.Casualties per 1,000 incidents in Zanesville, OH compared to nearest cities:
(Note: Based on data for all years, including only cities with at least 500 fire incidents)
| Zanesville: | 17.1 |
| Roseville: | 5.0 |
| Crooksville: | 2.6 |
| Somerset: | 6.5 |
| New Lexington: | 2.7 |
| Thornville: | 4.1 |
| Newark: | 20.0 |
| Cambridge: | 7.2 |
| Heath: | 4.4 |
 31.8% incidents where reported in the morning and 68.2% in the evening. The most fires (15.2%) took place on Tuesday, and the least (13.3%) on Wednesday.
 Based on the 5,077 incident reports from years 2002 - 2018 most fires (11.3%) took place during March, and the least (6.6%) in January.
 Out of all 30,613 cases reported during the years 2002 - 2018, the most belonged to the categories: Rescue & EMS (52.5%), Fire (16.6%), and Hazardous Condition (13.3%).
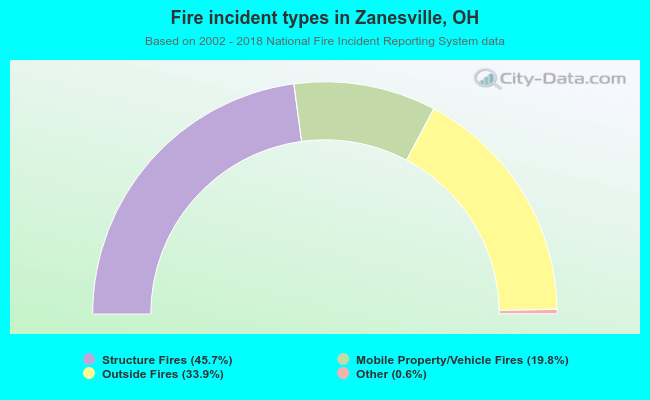 When looking into fire subcategories, the most reports belonged to: Structure Fires (45.7%), and Outside Fires (33.9%).