Aberdeen, SD (South Dakota) Houses and Residents
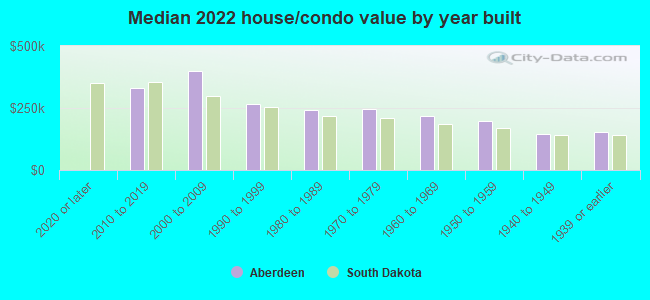
| Aberdeen: | $214,528 |
| South Dakota: | $245,000 |
Mean price in 2022:
Detached houses: $250,866
Here: $250,866 State: $303,134 Townhouses or other attached units: $249,588
Here: $249,588 State: $292,182 In 2-unit structures: $70,105
Here: $70,105 State: $202,885 In 3-to-4-unit structures: $208,195
Here: $208,195 State: $310,946 In 5-or-more-unit structures: $93,614
Here: $93,614 State: $177,195 Mobile homes: $38,929
Here: $38,929 State: $82,732
Total population: 27,800 (Urban population: 24,149 (all inside urban clusters), Rural population: 461 (all nonfarm))
Houses: 13,762 (12,461 occupied: 7,366 owner occupied, 5,338 renter occupied)
| % of renters here: | 42% |
| State: | 30% |
Housing density: 1,062 houses/condos per square mile
Median price asked for vacant for-sale houses and condos in 2022: $313,229.
Median contract rent in 2022: $641 (lower quartile is $475, upper quartile is $820)
Median rent asked for vacant for-rent units in 2022: $1,188
Median gross rent in Aberdeen, SD in 2022: $730
Housing units in Aberdeen with a mortgage: 4,755 (363 second mortgage, 29 home equity loan, 338 both second mortgage and home equity loan)
Houses without a mortgage: 68
Median household income for houses/condos with a mortgage: $93,154
Median household income for apartments without a mortgage: $60,941
Median monthly housing costs: $872
Compare current foreclosures near Aberdeen, SD:
| Photo | Address | Area | Beds / Baths | Price | Details |
|---|---|---|---|---|---|

|
#1
N Main St
Aberdeen, SD 57401
|
1,152 sq. feet
|
2 baths 3 beds |
show details | |

|
#2
Camino Real
Aberdeen, SD 57401
|
1,284 sq. feet
|
2 baths 2 beds |
show details | |

|
#3
S 9th St
Aberdeen, SD 57401
|
1,037 sq. feet
|
2 baths 3 beds |
show details | |

|
#4
S 1st St
Aberdeen, SD 57401
|
720 sq. feet
|
- baths 2 beds |
show details | |

|
#5
Crystal Ave
Aberdeen, SD 57401
|
1,767 sq. feet
|
- baths 1 beds |
show details | |

|
#6
Dick Dr
Aberdeen, SD 57401
|
960 sq. feet
|
- baths 3 beds |
show details | |

|
#7
S Arch St
Aberdeen, SD 57401
|
1,376 sq. feet
|
- baths 4 beds |
show details | |

|
#8
S 1st St
Aberdeen, SD 57401
|
1,344 sq. feet
|
- baths 4 beds |
show details | |

|
#9
127th St
Aberdeen, SD 57401
|
1,176 sq. feet
|
2 baths - beds |
show details | |

|
#10
S 4th St
Aberdeen, SD 57401
|
1,492 sq. feet
|
- baths 2 beds |
show details |
| Photo | Address | Area | Beds / Baths | Price | Details |
|---|---|---|---|---|---|

|
#11
N Congress St
Aberdeen, SD 57401
|
936 sq. feet
|
- baths 2 beds |
show details | |

|
#12
S Harvard St
Aberdeen, SD 57401
|
1,372 sq. feet
|
- baths 4 beds |
show details | |

|
#13
20th Ave SE Apt 505
Aberdeen, SD 57401
|
- sq. feet
|
- baths - beds |
show details | |

|
#14
3rd Ave SE Apt 107
Aberdeen, SD 57401
|
- sq. feet
|
- baths - beds |
show details | |

|
#15
N Jay St
Aberdeen, SD 57401
|
- sq. feet
|
- baths - beds |
show details | |

|
#16
5th Curv
Aberdeen, SD 57401
|
- sq. feet
|
- baths - beds |
show details | |

|
#17
1st Ave SE Apt 304
Aberdeen, SD 57401
|
- sq. feet
|
- baths - beds |
show details | |

|
#18
9th Ave SE
Aberdeen, SD 57401
|
- sq. feet
|
- baths - beds |
show details | |

|
#19
9th Ave SW
Aberdeen, SD 57401
|
- sq. feet
|
- baths - beds |
show details | |

|
#20
18th Ave NE
Aberdeen, SD 57401
|
- sq. feet
|
- baths - beds |
show details |
| Photo | Address | Area | Beds / Baths | Price | Details |
|---|---|---|---|---|---|

|
#21
3rd Ave NE
Aberdeen, SD 57401
|
- sq. feet
|
- baths - beds |
show details | |

|
#22
1st Ave NE
Aberdeen, SD 57401
|
- sq. feet
|
- baths - beds |
show details | |

|
#23
9th Ave SW
Aberdeen, SD 57401
|
- sq. feet
|
- baths - beds |
show details | |

|
#24
1st Ave SE
Aberdeen, SD 57401
|
- sq. feet
|
- baths - beds |
show details | |

|
#25
N Pennsylvania St
Aberdeen, SD 57401
|
- sq. feet
|
- baths - beds |
show details | |

|
#26
129th St
Aberdeen, SD 57401
|
- sq. feet
|
- baths - beds |
show details | |

|
#27
6th Ave NE
Aberdeen, SD 57401
|
- sq. feet
|
- baths - beds |
show details | |

|
#28
S James St
Columbia, SD 57433
|
- sq. feet
|
- baths - beds |
show details | |

|
Check over 1 million property listings on Foreclosure.com!
|
browse all offers | |||

Latest news about housing in Aberdeen, SD collected exclusively by city-data.com from local newspapers, TV, and radio stations

 | Relocating to Aberdeen, SD? (7 replies) |
| Looking for a house to rent in Aberdeen, SD (12 replies) |
| USD or SDSU (34 replies) |
| Introducing One's Self (7 replies) |
| Moving to Aberdeen! Need Info (2 replies) |
| cheapest homes in SD - where? (22 replies) |
Median year apartment built: 1983
Household type by relationship:
Households: 29,009- Male householders: 6,052 (2,171 living alone), Female householders: 6,326 (2,726 living alone)
4,990 spouses (4,974 opposite-sex spouses), 940 unmarried partners, (914 opposite-sex unmarried partners), 7,449 children (6,948 natural, 200 adopted, 300 stepchildren), 364 grandchildren, 310 brothers or sisters, 167 parents, 29 foster children, 171 other relatives, 1,098 non-relatives
- In group quarters: 1,106
Size of family households: 3,032 2-persons, 1,519 3-persons, 1,056 4-persons, 493 5-persons, 206 6-persons, 101 7-or-more-persons.
Size of nonfamily households: 5,194 1-person, 1,065 2-persons, 112 3-persons.
4,164 married couples with children.
1,721 single-parent households (584 men, 1,137 women).
89.7% of residents of Aberdeen speak English at home.
3.3% of residents speak Spanish at home (37% speak English very well, 39% speak English well, 11% speak English not well, 12% don't speak English at all).
2.7% of residents speak other Indo-European language at home (99% speak English very well, 1% speak English well).
2.6% of residents speak Asian or Pacific Island language at home (46% speak English very well, 34% speak English well, 19% speak English not well, 1% don't speak English at all).
1.9% of residents speak other language at home (30% speak English very well, 57% speak English well, 13% speak English not well).
Foreign born population: 1,845 (6.4%)
(35.4% of them are naturalized citizens)
| Here: | 7.5 |
| State: | 7.0 |
| Here: | 3.8 |
| State: | 4.1 |
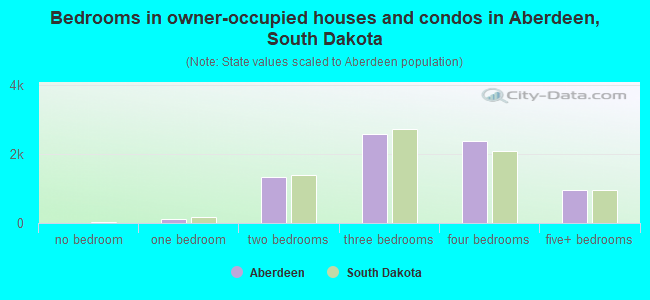
- Bedrooms in owner-occupied houses and condos in Aberdeen, South Dakota
- 0no bedroom
- 1231 bedroom
- 1,3352 bedrooms
- 2,5793 bedrooms
- 2,3764 bedrooms
- 9535+ bedrooms
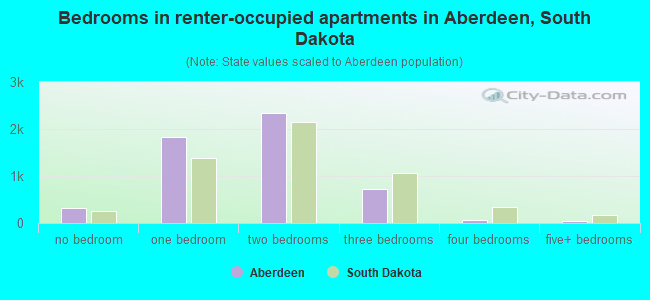
- Bedrooms in renter-occupied apartments in Aberdeen, South Dakota
- 325no bedroom
- 1,8201 bedroom
- 2,3492 bedrooms
- 7303 bedrooms
- 734 bedrooms
- 415+ bedrooms
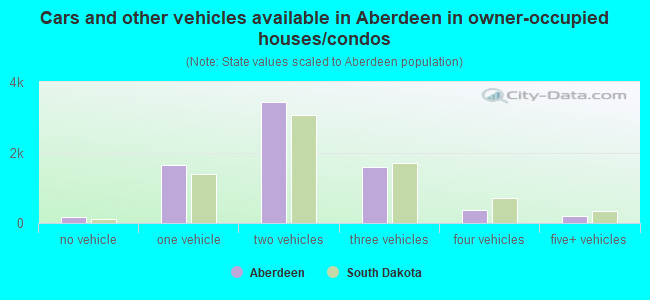
- Cars and other vehicles available in Aberdeen in owner-occupied houses/condos
- 158no vehicle
- 1,6341 vehicle
- 3,4262 vehicles
- 1,5933 vehicles
- 3694 vehicles
- 1865+ vehicles
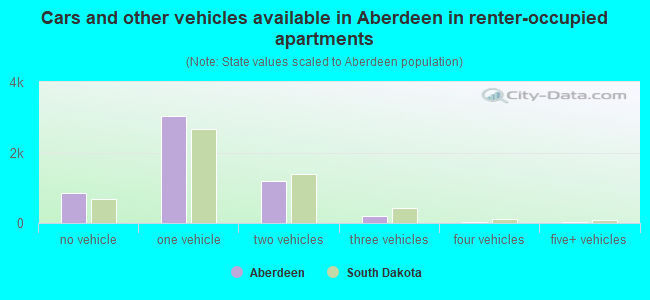
- Cars and other vehicles available in Aberdeen in renter-occupied apartments
- 856no vehicle
- 3,0451 vehicle
- 1,1862 vehicles
- 1973 vehicles
- 264 vehicles
- 285+ vehicles
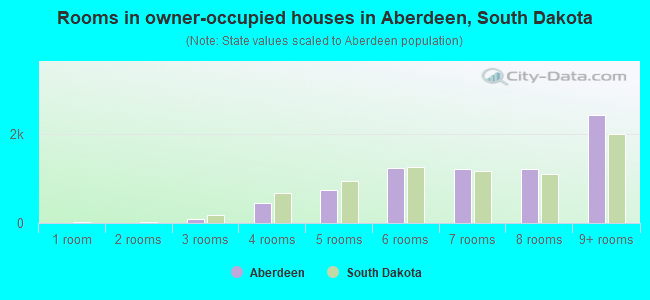
- Rooms in owner-occupied houses in Aberdeen, South Dakota
- 01 room
- 02 rooms
- 923 rooms
- 4404 rooms
- 7485 rooms
- 1,2406 rooms
- 1,2077 rooms
- 1,2208 rooms
- 2,4199+ rooms
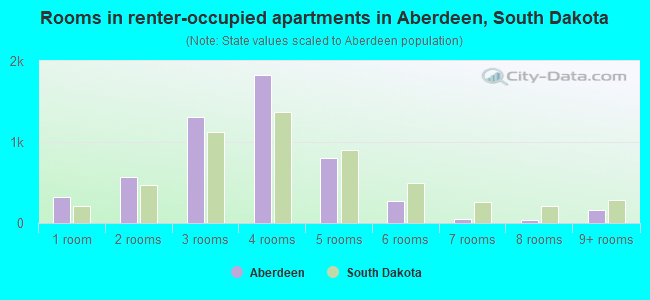
- Rooms in renter-occupied apartments in Aberdeen, South Dakota
- 3181 room
- 5622 rooms
- 1,3133 rooms
- 1,8264 rooms
- 7985 rooms
- 2686 rooms
- 517 rooms
- 428 rooms
- 1599+ rooms
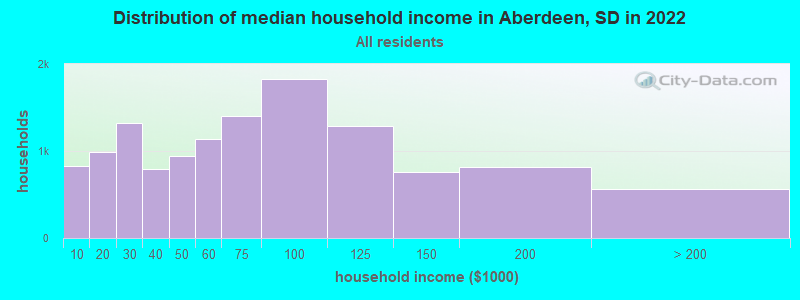
Aberdeen, SD household income distribution

- 827Less than $10,000
- 994$10,000 to $19,999
- 1,322$20,000 to $29,999
- 792$30,000 to $39,999
- 946$40,000 to $49,999
- 1,135$50,000 to $59,999
- 1,407$60,000 to $74,999
- 1,832$75,000 to $99,999
- 1,288$100,000 to $124,999
- 763$125,000 to $149,999
- 821$150,000 to $199,999
- 564$200,000 or more
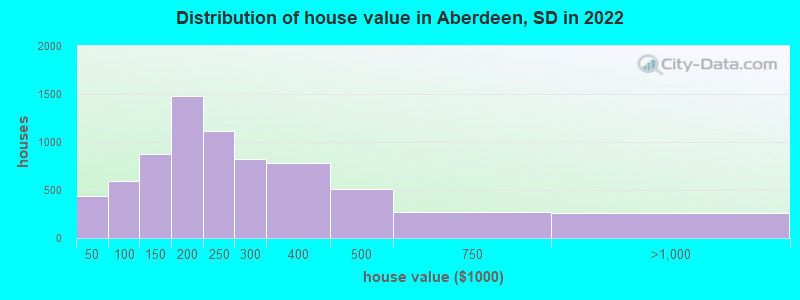
Home value of owner - occupied houses in 2022 in Aberdeen, SD
-
- 93Less than $10,000
- 24$10,000 to $14,999
- 51$15,000 to $19,999
- 73$20,000 to $24,999
- 24$25,000 to $29,999
- 75$30,000 to $34,999
- 21$35,000 to $39,999
- 69$40,000 to $49,999
- 114$50,000 to $59,999
- 59$60,000 to $69,999
- 128$70,000 to $79,999
- 101$80,000 to $89,999
- 121$90,000 to $99,999
- 377$100,000 to $124,999
- 497$125,000 to $149,999
- 869$150,000 to $174,999
- 613$175,000 to $199,999
- 1,116$200,000 to $249,999
- 822$250,000 to $299,999
- 777$300,000 to $399,999
- 511$400,000 to $499,999
- 268$500,000 to $749,999
- 258$750,000 to $999,999
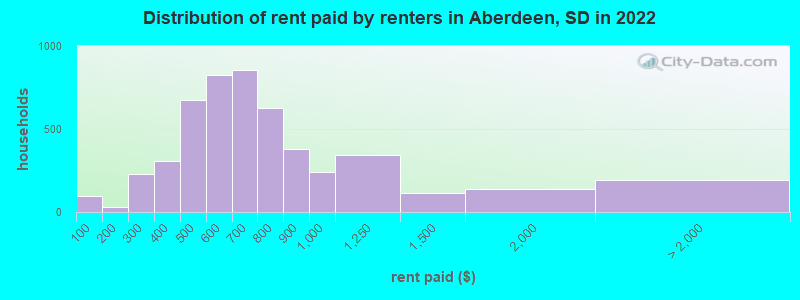
Rent paid by renters in 2022 in Aberdeen, SD
-
- 96Less than $100
- 27$150 to $199
- 38$200 to $249
- 189$250 to $299
- 118$300 to $349
- 186$350 to $399
- 189$400 to $449
- 485$450 to $499
- 467$500 to $549
- 360$550 to $599
- 310$600 to $649
- 542$650 to $699
- 387$700 to $749
- 241$750 to $799
- 378$800 to $899
- 239$900 to $999
- 343$1,000 to $1,249
- 115$1,250 to $1,499
- 139$1,500 to $1,999
- 25$2,000 to $2,499
- 120$3,500 or more
- 44No cash rent
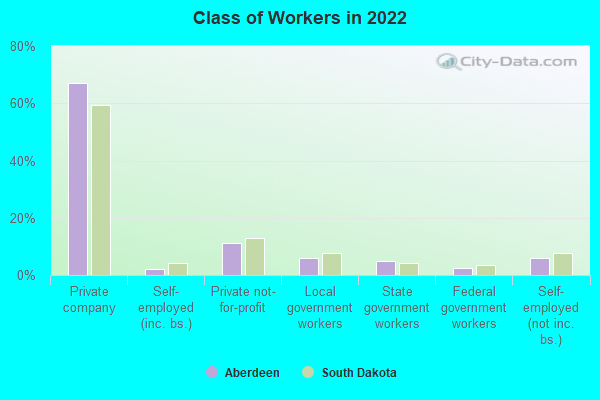
Percentage of workers working in this county: 97.2%
Number of people working at home: 905 (5.8% of all workers)
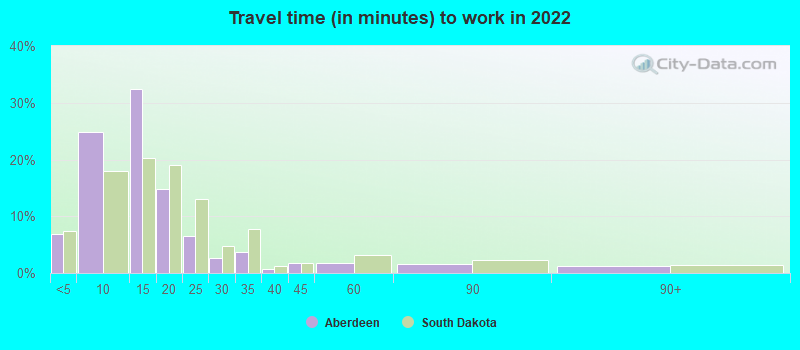
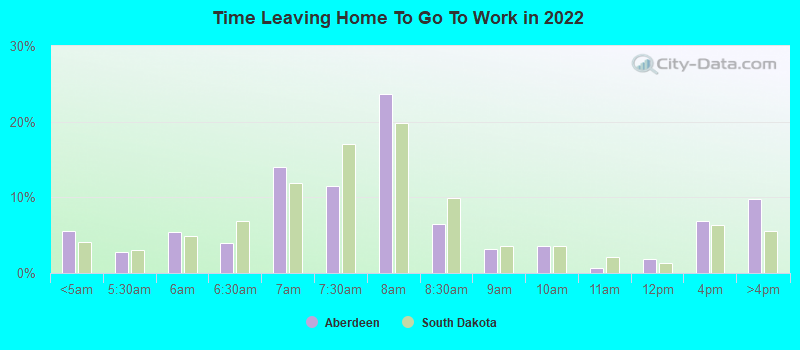
Travel time to work (commute)
- Less than 5 minutes: 1,116
- 5 to 9 minutes: 4,150
- 10 to 14 minutes: 5,282
- 15 to 19 minutes: 2,266
- 20 to 24 minutes: 377
- 25 to 29 minutes: 229
- 30 to 34 minutes: 399
- 35 to 39 minutes: 82
- 40 to 44 minutes: 79
- 45 to 59 minutes: 139
- 60 to 89 minutes: 161
- 90 or more minutes: 84
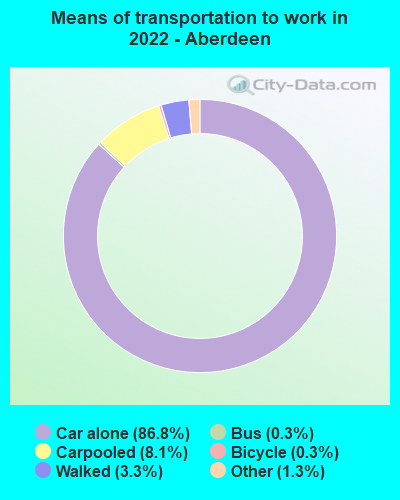
Means of transportation to work:
- Drove a car alone: 14,748 (82.8%)
- Carpooled: 1,258 (7.1%)
- Bus: 43 (0.2%)
- Taxi: 253 (1.4%)
- Bicycle: 30 (0.2%)
- Walked: 456 (2.6%)
- Worked at home: 905 (5.1%)
- Unemployment by race in 2022
- Unemployment rate for White non-Hispanic residents
- 3.9%Males
- 4.6%Females
- Unemployment rate for American Indian and Alaska Native residents
- 7.8%Males
- 3.6%Females
- Unemployment rate for two or more race residents
- 2.5%Males
- Unemployment rate for Hispanic or Latino residents
- 6.5%Males
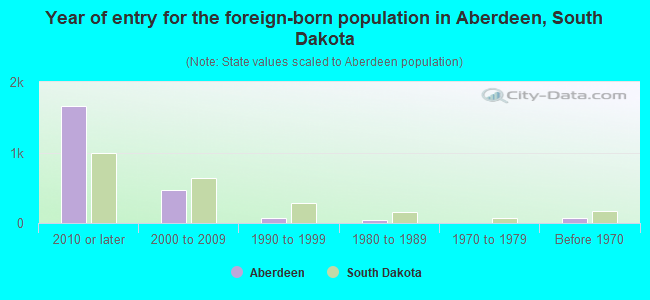
- Year of entry for the foreign-born population in Aberdeen, South Dakota
- 1,6542010 or later
- 4672000 to 2009
- 641990 to 1999
- 381980 to 1989
- 01970 to 1979
- 76Before 1970
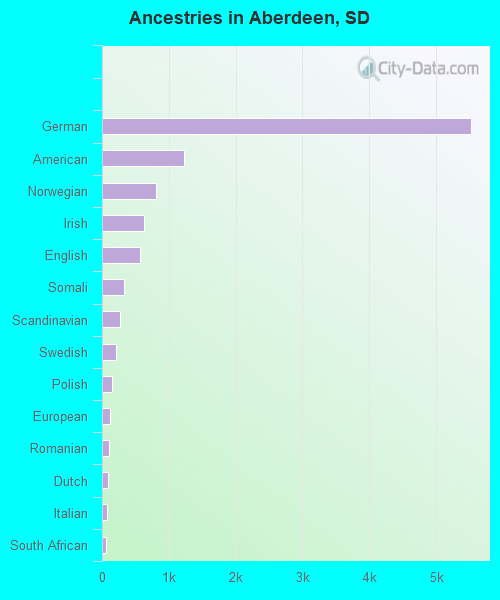
First ancestries reported:
- German: 5,517 (40.3%)
- American: 1,222 (8.9%)
- Norwegian: 812 (5.9%)
- Irish: 636 (4.6%)
- English: 566 (4.1%)
- Somali: 332 (2.4%)
- Scandinavian: 267 (2.0%)
- Swedish: 204 (1.5%)
- Polish: 144 (1.1%)
- European: 122 (0.9%)
- Romanian: 110 (0.8%)
- Dutch: 90 (0.7%)
- Italian: 69 (0.5%)
- South African: 53 (0.4%)
- Danish: 48 (0.4%)
- Finnish: 47 (0.3%)
- Scotch-Irish: 31 (0.2%)
- Welsh: 31 (0.2%)
- Scottish: 22 (0.2%)
- Ethiopian: 21 (0.2%)
- French Canadian: 18 (0.1%)
- German Russian: 17 (0.1%)
- Northern European: 16 (0.1%)
- African: 14 (0.1%)
- British: 11 (0.08%)
- French: 11 (0.08%)
- Czech: 10 (0.07%)
- Jamaican: 8 (0.06%)
- Belgian: 7 (0.05%)
- Russian: 7 (0.05%)
Most common places of birth for foreign-born residents (%):
| Aberdeen: | 23.7% (481) |
| South Dakota: | 2.5% (847) |
| Aberdeen: | 16.5% (335) |
| South Dakota: | 1.3% (455) |
| Aberdeen: | 14.0% (284) |
| South Dakota: | 3.3% (1,125) |
| Aberdeen: | 8.6% (175) |
| South Dakota: | 4.9% (1,663) |
| Aberdeen: | 8.1% (164) |
| South Dakota: | 2.6% (896) |
| Aberdeen: | 4.3% (87) |
| South Dakota: | 0.9% (304) |
| Aberdeen: | 4.0% (82) |
| South Dakota: | 0.6% (208) |
| Aberdeen: | 3.3% (66) |
| South Dakota: | 4.0% (1,373) |
| Aberdeen: | 3.1% (63) |
| South Dakota: | 0.2% (68) |
| Aberdeen: | 2.7% (55) |
| South Dakota: | 2.4% (833) |
| Aberdeen: | 2.1% (42) |
| South Dakota: | 1.0% (346) |
| Aberdeen: | 1.6% (32) |
| South Dakota: | 10.7% (3,642) |
Place of birth for U.S.-born residents:
- This state: 19,171
- Other state: 7,092
- Northeast: 408
- Midwest: 4,368
- South: 627
- West: 1,664
85.6% of Aberdeen residents lived in the same house 1 years ago.
Out of people who lived in different houses, 37.9% lived in this county.
Out of people who lived in different counties, 61.6% lived in South Dakota.
| Aberdeen: | 85.6% |
| State average: | 86.6% |
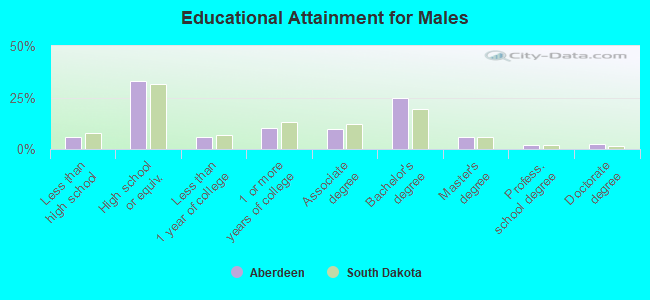
Education attainment for males 25 years and older:
- No schooling: 96
- Nursery to 4th grade: 22
- 5th and 6th grade: 1
- 7th and 8th grade: 86
- 9th grade: 16
- 10th grade: 101
- 11th grade: 45
- 12th grade, no diploma: 192
- High school graduate (or equivalency): 3,052
- Less than 1 year of college: 556
- Some college more than 1 year, no degree: 966
- Associate degree: 916
- Bachelor's degree: 2,283
- Master's degree: 535
- Professional school degree: 183
- Doctorate degree: 237
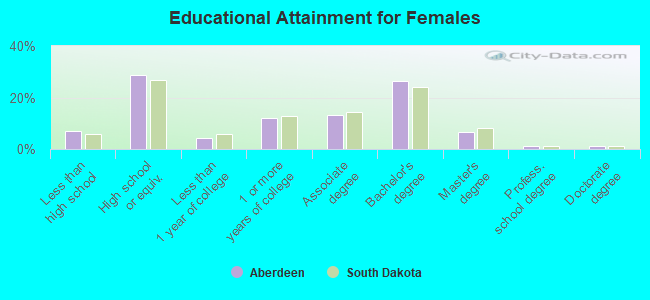
Education attainment for females 25 years and older:
- No schooling: 68
- Nursery to 4th grade: 49
- 5th and 6th grade: 61
- 7th and 8th grade: 106
- 9th grade: 46
- 10th grade: 61
- 11th grade: 130
- 12th grade, no diploma: 163
- High school graduate (or equivalency): 2,778
- Less than 1 year of college: 423
- Some college more than 1 year, no degree: 1,174
- Associate degree: 1,274
- Bachelor's degree: 2,569
- Master's degree: 630
- Professional school degree: 96
- Doctorate degree: 103
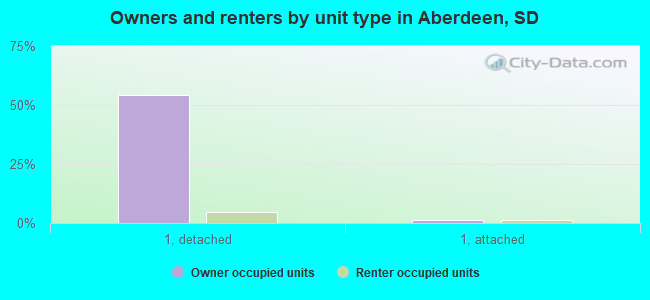
Housing units in structures:
- One, detached: 7,423
- One, attached: 375
- Two: 373
- 3 or 4: 819
- 5 to 9: 934
- 10 to 19: 1,319
- 20 to 49: 1,181
- 50 or more: 750
- Mobile homes: 481
- Boats, RVs, vans, etc.: 101
Median worth of mobile homes: $20,169
Housing units lacking complete kitchen facilities in 2022: 2.1%
House/condo owner moved in on average 10 years ago
Renter moved in on average 3 years ago
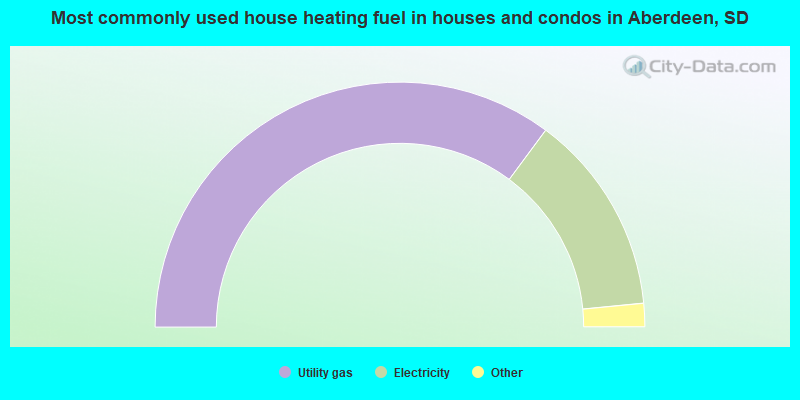
- 70.3%Utility gas
- 26.6%Electricity
- 1.7%Bottled, tank, or LP gas
- 0.5%Other fuel
- 0.5%Fuel oil, kerosene, etc.
- 0.4%No fuel used
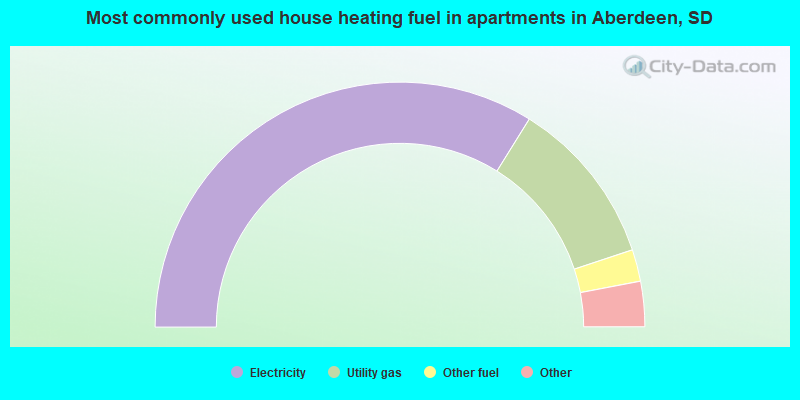
- 67.8%Electricity
- 22.1%Utility gas
- 4.2%Other fuel
- 2.7%Bottled, tank, or LP gas
- 2.0%Fuel oil, kerosene, etc.
- 1.3%No fuel used
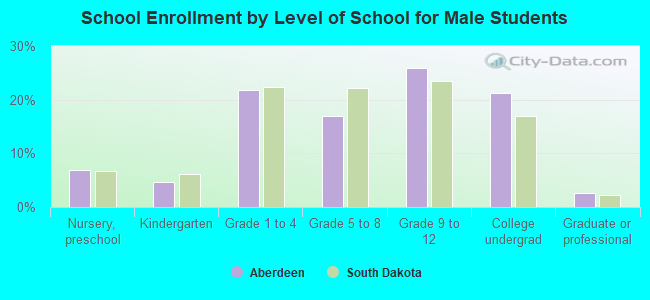
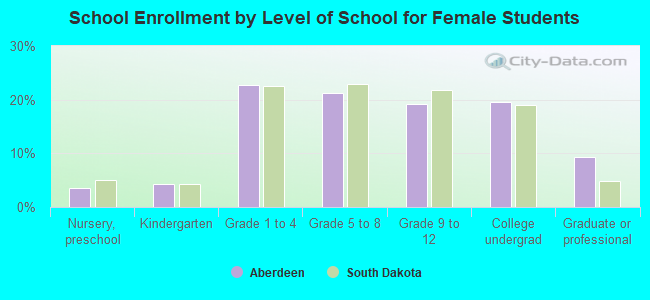
Private vs. public school enrollment:
| Here: | 13.1% |
| South Dakota: | 11.9% |
| Here: | 9.7% |
| South Dakota: | 7.2% |
| Here: | 13.1% |
| South Dakota: | 10.2% |