Abington, MA (Massachusetts) Houses and Residents
| Abington: | $543,755 |
| Massachusetts: | $534,700 |
Mean price in 2022:
Detached houses: $534,704
Here: $534,704 State: $651,570 Townhouses or other attached units: $495,230
Here: $495,230 State: $617,749 In 2-unit structures: $626,827
Here: $626,827 State: $594,808 In 3-to-4-unit structures: $259,169
Here: $259,169 State: $601,912 In 5-or-more-unit structures: $361,640
Here: $361,640 State: $555,768
Total population: 15,985 (Urban population: 14,605, Rural population: 0)
Houses: 6,553 (6,341 occupied: 5,051 owner occupied, 1,382 renter occupied)
| % of renters here: | 21% |
| State: | 38% |
Housing density: 659 houses/condos per square mile
Median price asked for vacant for-sale houses and condos in 2022: $1,192,851.
Median contract rent in 2022: $1,404 (lower quartile is $788, upper quartile is over $2,000)
Median rent asked for vacant for-rent units in 2022: $2,521
Median gross rent in Abington, MA in 2022: $1,494
Housing units in Abington with a mortgage: 3,857 (761 second mortgage, 0 home equity loan, 694 both second mortgage and home equity loan)
Houses without a mortgage: 179
Median household income for houses/condos with a mortgage: $152,619
Median household income for apartments without a mortgage: $117,083
Median monthly housing costs: $2,201
Compare current foreclosures near Abington, MA:
| Photo | Address | Area | Beds / Baths | Price | Details |
|---|---|---|---|---|---|

|
#1
Tamarack Ln
Abington, MA 02351
|
1,495 sq. feet
|
2 baths 2 beds |
show details | |

|
#2
Rockland St
Abington, MA 02351
|
1,700 sq. feet
|
1 baths 4 beds |
show details | |

|
#3
Tamarack Ln # 422
Abington, MA 02351
|
1,495 sq. feet
|
2 baths 2 beds |
show details | |

|
#4
Tamarack Ln # No
Abington, MA 02351
|
1,495 sq. feet
|
2 baths 2 beds |
show details | |

|
#5
Summer St
Abington, MA 02351
|
1,062 sq. feet
|
1 baths 3 beds |
show details | |

|
#6
Plymouth St # 3
Abington, MA 02351
|
5,112 sq. feet
|
4 baths 4 beds |
show details | |

|
#7
Maple St
Abington, MA 02351
|
2,117 sq. feet
|
2 baths 4 beds |
show details | |

|
#8
Plymouth St
Abington, MA 02351
|
1,152 sq. feet
|
1 baths 2 beds |
show details | |

|
#9
Washington St
Abington, MA 02351
|
1,810 sq. feet
|
3 baths 4 beds |
show details | |

|
#10
Lincoln St
Abington, MA 02351
|
1,526 sq. feet
|
1 baths 2 beds |
show details |
| Photo | Address | Area | Beds / Baths | Price | Details |
|---|---|---|---|---|---|

|
#11
Randolph St
Abington, MA 02351
|
1,080 sq. feet
|
2 baths 3 beds |
show details | |

|
#12
Orchard Ln
Abington, MA 02351
|
2,718 sq. feet
|
3 baths 4 beds |
show details | |

|
#13
Hancock St
Abington, MA 02351
|
1,891 sq. feet
|
1 baths 4 beds |
show details | |

|
#14
Vineyard Rd
Abington, MA 02351
|
1,080 sq. feet
|
1 baths 3 beds |
show details | |

|
#15
Captain Standish Dr
Abington, MA 02351
|
1,159 sq. feet
|
2 baths 3 beds |
show details | |

|
#16
Thicket St
Abington, MA 02351
|
720 sq. feet
|
1 baths 3 beds |
show details | |

|
#17
Highfields Rd
Abington, MA 02351
|
2,644 sq. feet
|
3 baths 5 beds |
show details | |

|
#18
Monroe St
Abington, MA 02351
|
1,364 sq. feet
|
1 baths 2 beds |
show details | |

|
#19
Checkerberry Rd
Abington, MA 02351
|
2,544 sq. feet
|
3 baths 5 beds |
show details | |

|
#20
North Ave
Abington, MA 02351
|
1,442 sq. feet
|
1 baths 3 beds |
show details |
| Photo | Address | Area | Beds / Baths | Price | Details |
|---|---|---|---|---|---|

|
#21
Spruce St
Abington, MA 02351
|
1,176 sq. feet
|
1 baths 3 beds |
show details | |

|
#22
Plymouth St
Abington, MA 02351
|
1,150 sq. feet
|
1 baths 2 beds |
show details | |

|
#23
Pattison St Apt G40
Abington, MA 02351
|
- sq. feet
|
- baths - beds |
show details | |

|
#24
Prospect St
Norwell, MA 02061
|
5,483 sq. feet
|
5 baths 5 beds |
$1,800,000
|
show details |

|
#25
Boyd St
Boston, MA 02124
|
3,970 sq. feet
|
3 baths 9 beds |
$650,000
|
show details |

|
#26
Johnson Rd
North Weymouth, MA 02191
|
748 sq. feet
|
1 baths 2 beds |
$365,000
|
show details |

|
#27
Tall Oaks Dr Unit 508
South Weymouth, MA 02190
|
1,300 sq. feet
|
2 baths 2 beds |
$285,000
|
show details |

|
#28
Heritage Ln
Duxbury, MA 02332
|
5,508 sq. feet
|
2 baths 5 beds |
$759,900
|
show details |

|
#29
Tamar Tam422
Abington, MA 02351
|
- sq. feet
|
- baths - beds |
show details | |

|
#30
Kendrick Ave Apt 307
Quincy, MA 02169
|
1,234 sq. feet
|
2 baths 2 beds |
show details |
| Photo | Address | Area | Beds / Baths | Price | Details |
|---|---|---|---|---|---|

|
#31
Church St
Boston, MA 02122
|
3,663 sq. feet
|
3 baths 6 beds |
show details | |

|
#32
Bittersweet Ln
Randolph, MA 02368
|
882 sq. feet
|
1 baths 2 beds |
show details | |

|
#33
Littlefield St
Quincy, MA 02169
|
1,274 sq. feet
|
1 baths 4 beds |
show details | |

|
#34
Melville Ct
Brockton, MA 02301
|
1,140 sq. feet
|
2 baths 3 beds |
show details | |

|
#35
Oak St
Hanson, MA 02341
|
1,058 sq. feet
|
1 baths 2 beds |
show details | |

|
#36
Congress Pl
Dedham, MA 02026
|
1,966 sq. feet
|
2 baths 4 beds |
show details | |

|
#37
N Main St
Middleboro, MA 02346
|
1,898 sq. feet
|
2 baths 4 beds |
show details | |

|
#38
Ridgehill Rd
Canton, MA 02021
|
1,196 sq. feet
|
1 baths 3 beds |
show details | |

|
#39
Berkshire Ave
Sharon, MA 02067
|
1,289 sq. feet
|
2 baths 3 beds |
show details | |

|
#40
Brahms St
Roslindale, MA 02131
|
1,604 sq. feet
|
1 baths 4 beds |
show details |
| Photo | Address | Area | Beds / Baths | Price | Details |
|---|---|---|---|---|---|

|
#41
Emily Jeffers Rd # L
Randolph, MA 02368
|
1,350 sq. feet
|
1 baths 3 beds |
show details | |

|
#42
Great Cedar Dr # 4
Hanson, MA 02341
|
- sq. feet
|
1 baths 2 beds |
show details | |

|
#43
Ashland St
Taunton, MA 02780
|
1,680 sq. feet
|
2 baths 4 beds |
show details | |

|
#44
Hubbard Rd
East Bridgewater, MA 02333
|
1,344 sq. feet
|
2 baths 4 beds |
show details | |

|
#45
Pond St
East Bridgewater, MA 02333
|
864 sq. feet
|
1 baths 2 beds |
show details | |

|
#46
Thomas St
Jamaica Plain, MA 02130
|
1,990 sq. feet
|
2 baths 2 beds |
show details | |

|
#47
Neponset St
Canton, MA 02021
|
1,053 sq. feet
|
1 baths 2 beds |
show details | |

|
#48
S Franklin St
Holbrook, MA 02343
|
940 sq. feet
|
2 baths 2 beds |
show details | |

|
#49
Marcy Rd
Mattapan, MA 02126
|
1,168 sq. feet
|
1 baths 3 beds |
show details | |

|
Check over 1 million property listings on Foreclosure.com!
|
browse all offers | |||

Latest news about housing in Abington, MA collected exclusively by city-data.com from local newspapers, TV, and radio stations

 | How Much Massachusetts Households Make Per Year: Census Data (37 replies) |
| MA Real Estate Question OTD (83 replies) |
| Home Prices By Town for 2022 (190 replies) |
| 2021 Real Estate Observations (1729 replies) |
| 2021 Median Home Prices By Town/City (118 replies) |
| Wonder why housing is so expensive? (158 replies) |

Median year apartment built: 1968
Household type by relationship:
Households: 17,116- Male householders: 2,911 (747 living alone), Female householders: 3,367 (896 living alone)
3,240 spouses (3,222 opposite-sex spouses), 633 unmarried partners, (633 opposite-sex unmarried partners), 5,122 children (4,959 natural, 131 adopted, 31 stepchildren), 312 grandchildren, 174 brothers or sisters, 310 parents, 0 foster children, 244 other relatives, 633 non-relatives
- In group quarters: 167
Size of family households: 1,631 2-persons, 987 3-persons, 892 4-persons, 464 5-persons, 194 6-persons, 79 7-or-more-persons.
Size of nonfamily households: 1,573 1-person, 413 2-persons, 126 3-persons.
2,726 married couples with children.
800 single-parent households (219 men, 581 women).
87.3% of residents of Abington speak English at home.
2.0% of residents speak Spanish at home (76% speak English very well, 6% speak English well, 16% speak English not well, 1% don't speak English at all).
7.8% of residents speak other Indo-European language at home (66% speak English very well, 22% speak English well, 3% speak English not well, 9% don't speak English at all).
0.8% of residents speak Asian or Pacific Island language at home (68% speak English very well, 22% speak English well, 10% speak English not well).
1.0% of residents speak other language at home (50% speak English very well, 50% speak English well).
Foreign born population: 1,759 (10.3%)
(68.7% of them are naturalized citizens)
| Here: | 6.8 |
| State: | 6.5 |
| Here: | 3.1 |
| State: | 4.0 |

- Bedrooms in owner-occupied houses and condos in Abington, Massachusetts
- 19no bedroom
- 1671 bedroom
- 1,0132 bedrooms
- 2,2603 bedrooms
- 1,1004 bedrooms
- 4935+ bedrooms

- Bedrooms in renter-occupied apartments in Abington, Massachusetts
- 126no bedroom
- 6391 bedroom
- 5312 bedrooms
- 763 bedrooms
- 104 bedrooms
- 05+ bedrooms

- Cars and other vehicles available in Abington in owner-occupied houses/condos
- 23no vehicle
- 1,2121 vehicle
- 2,3752 vehicles
- 9203 vehicles
- 3414 vehicles
- 1815+ vehicles

- Cars and other vehicles available in Abington in renter-occupied apartments
- 216no vehicle
- 6931 vehicle
- 4232 vehicles
- 413 vehicles
- 94 vehicles
- 05+ vehicles

- Rooms in owner-occupied houses in Abington, Massachusetts
- 91 room
- 152 rooms
- 1813 rooms
- 4294 rooms
- 6685 rooms
- 1,0256 rooms
- 1,0087 rooms
- 6848 rooms
- 1,0329+ rooms

- Rooms in renter-occupied apartments in Abington, Massachusetts
- 1031 room
- 1912 rooms
- 5733 rooms
- 1934 rooms
- 2285 rooms
- 406 rooms
- 357 rooms
- 08 rooms
- 209+ rooms


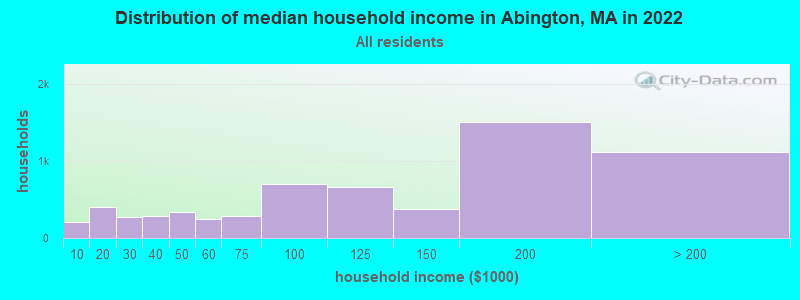
Abington, MA household income distribution

- 203Less than $10,000
- 398$10,000 to $19,999
- 278$20,000 to $29,999
- 285$30,000 to $39,999
- 333$40,000 to $49,999
- 247$50,000 to $59,999
- 283$60,000 to $74,999
- 700$75,000 to $99,999
- 669$100,000 to $124,999
- 384$125,000 to $149,999
- 1,510$150,000 to $199,999
- 1,124$200,000 or more
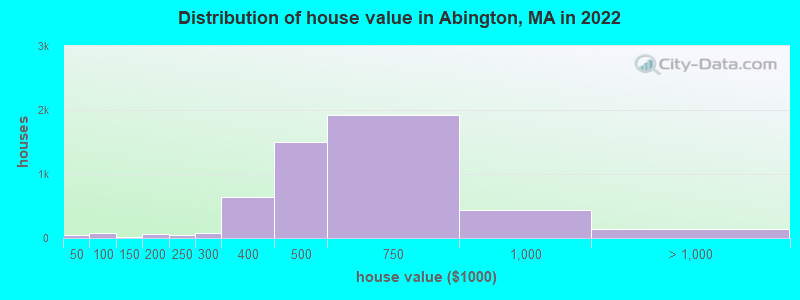
Home value of owner - occupied houses in 2022 in Abington, MA
-
- 30Less than $10,000
- 14$40,000 to $49,999
- 39$50,000 to $59,999
- 29$60,000 to $69,999
- 15$125,000 to $149,999
- 38$150,000 to $174,999
- 16$175,000 to $199,999
- 41$200,000 to $249,999
- 72$250,000 to $299,999
- 645$300,000 to $399,999
- 1,503$400,000 to $499,999
- 1,923$500,000 to $749,999
- 440$750,000 to $999,999
- 146$1,000,000 to $1,499,999
Rent paid by renters in 2022 in Abington, MA
-
- 66$150 to $199
- 127$250 to $299
- 61$300 to $349
- 22$400 to $449
- 19$550 to $599
- 37$600 to $649
- 18$700 to $749
- 20$800 to $899
- 37$900 to $999
- 196$1,000 to $1,249
- 184$1,250 to $1,499
- 234$1,500 to $1,999
- 299$2,000 to $2,499
- 74$2,500 to $2,999
- 96$3,500 or more
- 10No cash rent


Percentage of workers working in this county: 48.8%
Number of people working at home: 1,409 (15.2% of all workers)
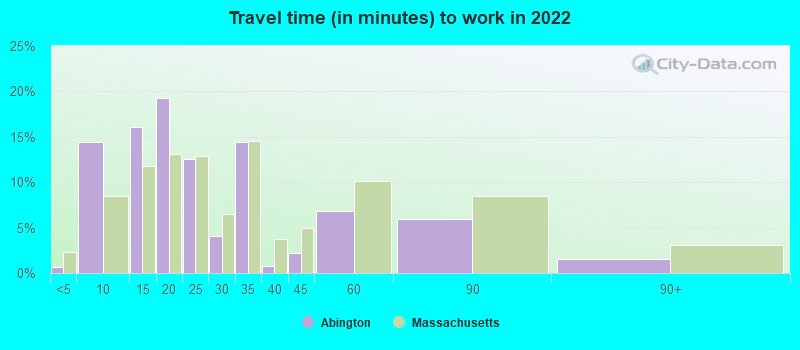
Travel time to work (commute)
- Less than 5 minutes: 12
- 5 to 9 minutes: 616
- 10 to 14 minutes: 470
- 15 to 19 minutes: 796
- 20 to 24 minutes: 1,081
- 25 to 29 minutes: 453
- 30 to 34 minutes: 1,269
- 35 to 39 minutes: 152
- 40 to 44 minutes: 348
- 45 to 59 minutes: 1,122
- 60 to 89 minutes: 1,345
- 90 or more minutes: 274

Means of transportation to work:
- Drove a car alone: 2,972 (64.5%)
- Carpooled: 254 (5.5%)
- Long-distance train or commuter rail: 15 (0.3%)
- Taxi: 56 (1.2%)
- Bicycle: 18 (0.4%)
- Walked: 28 (0.6%)
- Worked at home: 1,409 (30.6%)

- Unemployment by race in 2022
- Unemployment rate for White non-Hispanic residents
- 3.2%Males
- 5.1%Females
- Unemployment rate for Black residents
- 35.0%Males
- Unemployment rate for other race residents
- 11.2%Females
- Unemployment rate for two or more race residents
- 8.8%Females

- Year of entry for the foreign-born population in Abington, Massachusetts
- 5722010 or later
- 3792000 to 2009
- 3741990 to 1999
- 1431980 to 1989
- 601970 to 1979
- 135Before 1970

First ancestries reported:
- Irish: 3,235 (38.1%)
- Italian: 817 (9.6%)
- American: 572 (6.7%)
- English: 453 (5.3%)
- Albanian: 397 (4.7%)
- Cape Verdean: 370 (4.4%)
- Lebanese: 247 (2.9%)
- German: 224 (2.6%)
- European: 136 (1.6%)
- Polish: 120 (1.4%)
- French Canadian: 116 (1.4%)
- Moroccan: 109 (1.3%)
- Swedish: 105 (1.2%)
- Armenian: 93 (1.1%)
- Brazilian: 92 (1.1%)
- Portuguese: 74 (0.9%)
- Scottish: 68 (0.8%)
- Canadian: 54 (0.6%)
- French: 48 (0.6%)
- Haitian: 47 (0.6%)
- Greek: 23 (0.3%)
- British: 10 (0.1%)
- British West Indian: 8 (0.09%)
- Lithuanian: 7 (0.08%)
- Welsh: 6 (0.07%)
Most common places of birth for foreign-born residents (%):
| Abington: | 19.4% (332) |
| Massachusetts: | 7.6% (92,959) |
| Abington: | 16.6% (284) |
| Massachusetts: | 1.1% (13,076) |
| Abington: | 10.9% (186) |
| Massachusetts: | 2.6% (32,354) |
| Abington: | 9.2% (157) |
| Massachusetts: | 6.8% (82,934) |
| Abington: | 9.1% (156) |
| Massachusetts: | 0.7% (8,562) |
| Abington: | 6.0% (102) |
| Massachusetts: | 1.1% (13,446) |
| Abington: | 4.3% (73) |
| Massachusetts: | 0.2% (2,809) |
| Abington: | 3.2% (54) |
| Massachusetts: | 1.0% (11,727) |
| Abington: | 3.0% (51) |
| Massachusetts: | 0.7% (8,536) |
| Abington: | 2.8% (48) |
| Massachusetts: | 3.0% (37,197) |
| Abington: | 2.7% (46) |
| Massachusetts: | 3.7% (45,667) |
| Abington: | 2.4% (41) |
| Massachusetts: | 8.4% (103,233) |
| Abington: | 2.3% (39) |
| Massachusetts: | 0.9% (10,810) |
| Abington: | 1.6% (28) |
| Massachusetts: | 0.2% (2,034) |
| Abington: | 1.5% (26) |
| Massachusetts: | 0.9% (10,915) |
Place of birth for U.S.-born residents:
- This state: 13,656
- Other state: 1,571
- Northeast: 940
- Midwest: 219
- South: 206
- West: 202
88.3% of Abington residents lived in the same house 1 years ago.
Out of people who lived in different houses, 30.7% lived in this county.
Out of people who lived in different counties, 89.8% lived in Massachusetts.
| Abington: | 88.3% |
| State average: | 87.7% |
Education attainment for males 25 years and older:
- No schooling: 26
- Nursery to 4th grade: 16
- 5th and 6th grade: 16
- 7th and 8th grade: 0
- 9th grade: 10
- 10th grade: 12
- 11th grade: 73
- 12th grade, no diploma: 50
- High school graduate (or equivalency): 1,930
- Less than 1 year of college: 280
- Some college more than 1 year, no degree: 551
- Associate degree: 466
- Bachelor's degree: 1,661
- Master's degree: 692
- Professional school degree: 141
- Doctorate degree: 27

Education attainment for females 25 years and older:
- No schooling: 46
- Nursery to 4th grade: 6
- 5th and 6th grade: 25
- 7th and 8th grade: 72
- 9th grade: 0
- 10th grade: 28
- 11th grade: 10
- 12th grade, no diploma: 86
- High school graduate (or equivalency): 1,741
- Less than 1 year of college: 521
- Some college more than 1 year, no degree: 442
- Associate degree: 585
- Bachelor's degree: 1,816
- Master's degree: 759
- Professional school degree: 76
- Doctorate degree: 24


Housing units in structures:
- One, detached: 4,262
- One, attached: 456
- Two: 267
- 3 or 4: 469
- 5 to 9: 493
- 10 to 19: 203
- 20 to 49: 146
- 50 or more: 254
Housing units lacking complete kitchen facilities in 2022: 0.8%
House/condo owner moved in on average 11 years ago
Renter moved in on average 5 years ago

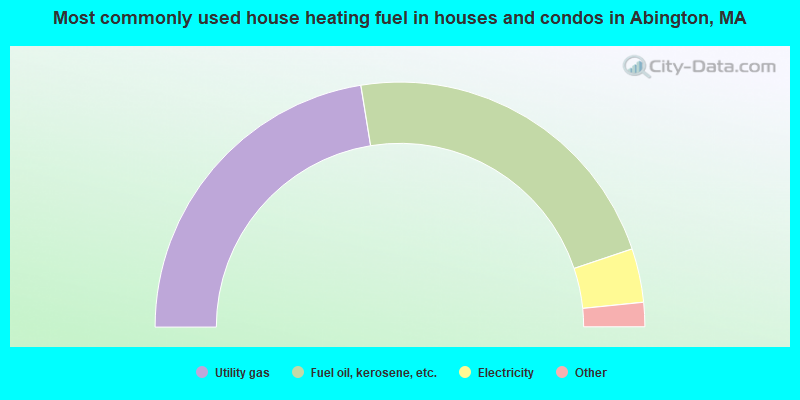
- 44.9%Utility gas
- 44.8%Fuel oil, kerosene, etc.
- 7.1%Electricity
- 1.8%Bottled, tank, or LP gas
- 0.8%Wood
- 0.5%Other fuel
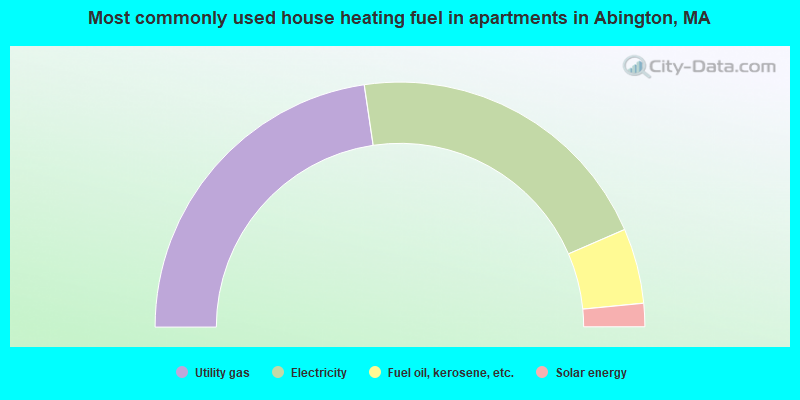
- 45.3%Utility gas
- 41.6%Electricity
- 9.9%Fuel oil, kerosene, etc.
- 3.1%Solar energy
Private vs. public school enrollment:
| Here: | 8.0% |
| Massachusetts: | 10.3% |
| Here: | 10.5% |
| Massachusetts: | 12.3% |
| Here: | 62.7% |
| Massachusetts: | 51.2% |


