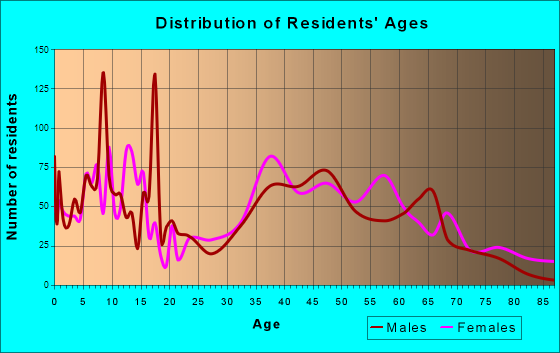
Airmont, NY (New York) Houses and Residents
Estimated median house or condo value in 2022: $654,351 (it was $253,900 in 2000 )
Airmont:
$654,351New York:
$400,400
Lower value quartile - upper value quartile: $515,264 - $767,602Mean price in 2022: Detached houses: $758,631 Here:
$758,631State:
$476,719
In 5-or-more-unit structures: $332,166 Here:
$332,166State:
$912,009
Total population: 8,878 (Urban population: 7,811, Rural population: 0)
Houses: 2,828 (2,653 occupied: 2,047 owner occupied, 624 renter occupied )
% of renters here:
23%State:
46%
Housing density: 617 houses/condos per square mile
Median price asked for vacant for-sale houses and condos in 2022 in this county: $364,915.
Median contract rent in 2022: $1,403
Median rent asked for vacant for-rent units in 2022: $1,171
Median gross rent in Airmont, NY in 2022: $1,404
Housing units in Airmont with a mortgage: 1,433 (112 second mortgage, 0 home equity loan, 115 both second mortgage and home equity loan )Houses without a mortgage: 71
Median household income for houses/condos with a mortgage: $158,470
Median household income for apartments without a mortgage: $70,799
Median monthly housing costs: $2,671
Data:
Median house or condo value ($)
Median house or condo value ($ change since 2000)
Median house or condo value ($) - White
Median house or condo value ($) - Black or African American
Median house or condo value ($) - Asian
Median house or condo value ($) - Hispanic or Latino
Median house or condo value ($) - American Indian and Alaska Native
Median house or condo value ($) - Multirace
Median house or condo value ($) - Other Race
Median price asked for mobile homes ($)
Household density (households per square mile)
Mean house or condo value by units in structure - 1, detached ($)
Mean house or condo value by units in structure - 1, attached ($)
Mean house or condo value by units in structure - 2 ($)
Mean house or condo value by units in structure by units in structure - 3 or 4 ($)
Mean house or condo value by units in structure - 5 or more ($)
Mean house or condo value by units in structure - Boat, RV, van, etc. ($)
Mean house or condo value by units in structure - Mobile home ($)
Median contract rent ($)
Median contract rent - Lower quartile ($)
Median contract rent - Upper quartile ($)
Median gross rent ($)
Urban houses (%)
Rural houses (%)
Houses occupied (%)
Houses occupied (% change since 2000)
Houses owner occupied (%)
Houses owner occupied (% change since 2000)
Houses renter occupied (%)
Houses renter occupied (% change since 2000)
Vacant housing units - For rent (%)
Vacant housing units - For rent (% change since 2000)
Vacant housing units - For sale only (%)
Vacant housing units - For sale only (% change since 2000)
Vacant housing units - Rented or sold, not occupied (%)
Vacant housing units - Rented or sold, not occupied (% change since 2000)
Vacant housing units - For seasonal, recreational, or occasional use (%)
Vacant housing units - For seasonal, recreational, or occasional use (% change since 2000)
Vacant housing units - For migrant workers (%)
Vacant housing units - For migrant workers (% change since 2000)
Vacant housing units - Other vacant (%)
Vacant housing units - Other vacant (% change since 2000)
Median monthly housing costs ($)
Median household income for houses/condos with a mortgage ($)
Median household income for houses/condos without a mortgage ($)
Median household income ($)
Median household income ($) - White
Median household income ($) - Black or African American
Median household income ($) - Asian
Median household income ($) - Hispanic or Latino
Median household income ($) - American Indian and Alaska Native
Median household income ($) - Multirace
Median household income ($) - Other Race
Mortgage status - with mortgage (%)
Mortgage status - with second mortgage (%)
Mortgage status - with home equity loan (%)
Mortgage status - with both second mortgage and home equity loan (%)
Mortgage status - without a mortgage (%)
Median year house/condo built
Median year apartment built
Household type by relationship - Male householder living alone (%)
Household type by relationship - Male householder not living alone (%)
Household type by relationship - Female householder living alone (%)
Household type by relationship - Female householder not living alone (%)
Household type by relationship - Opposite-Sex spouse (%)
Household type by relationship - Same-Sex spouse (%)
Household type by relationship - Opposite-Sex unmarried partner (%)
Household type by relationship - Same-Sex unmarried partner (%)
Household type by relationship - In group quarters (%)
Size of family households - 2-person household (%)
Size of family households - 3-person household (%)
Size of family households - 4-person household (%)
Size of family households - 5-person household (%)
Size of family households - 6-person household (%)
Size of family households - 7-or-more-person household (%)
Size of nonfamily households - 1-person household (%)
Size of nonfamily households - 2-person household (%)
Size of nonfamily households - 3-person household (%)
Size of nonfamily households - 4-person household (%)
Size of nonfamily households - 5-person household (%)
Size of nonfamily households - 6-person household (%)
Size of nonfamily households - 7-or-moreperson household (%)
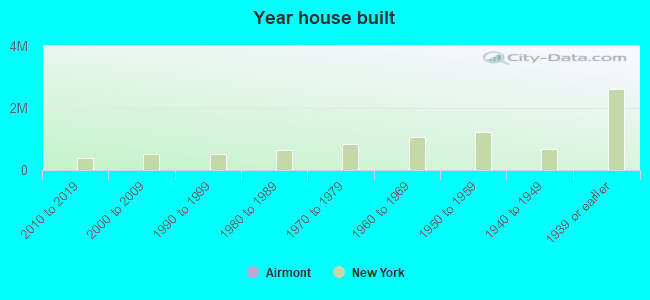
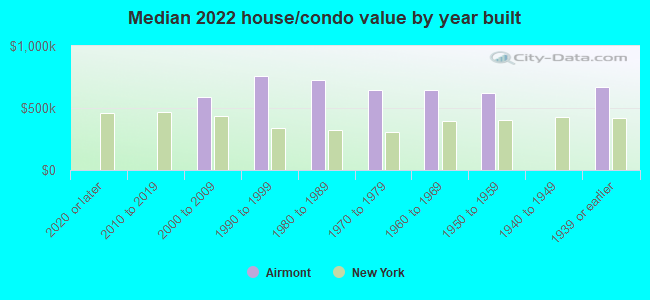
Year house built - Built 2010 or later (%)
Year house built - Built 2000 to 2009 (%)
Year house built - Built 1990 to 1999 (%)
Year house built - Built 1980 to 1989 (%)
Year house built - Built 1970 to 1979 (%)
Year house built - Built 1960 to 1969 (%)
Year house built - Built 1950 to 1959 (%)
Year house built - Built 1940 to 1949 (%)
Year house built - Built 1939 or earlier (%)
Median number of rooms in houses and condos
Median number of rooms in apartments
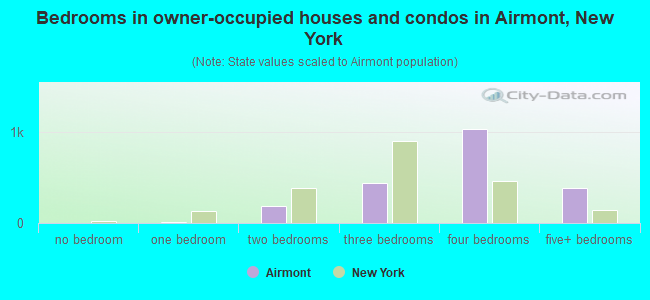
Median number of bedrooms in owner occupied houses
Mean number of bedrooms in owner occupied houses
Median number of bedrooms in renter occupied houses
Mean number of bedrooms in renter occupied houses
Median number of vehichles in owner occupied houses
Mean number of vehichles in owner occupied houses
Median number of vehichles in renter occupied houses
Mean number of vehichles in renter occupied houses
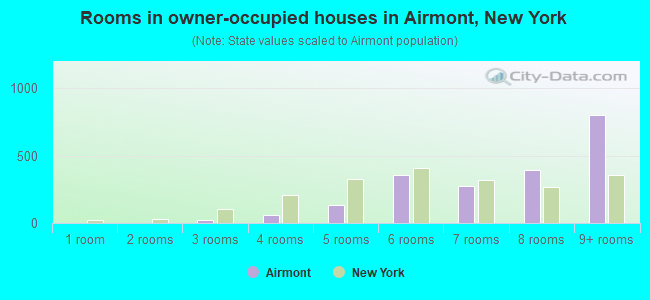
Rooms in owner-occupied houses - 1 room (%)
Rooms in owner-occupied houses - 2 rooms (%)
Rooms in owner-occupied houses - 3 rooms (%)
Rooms in owner-occupied houses - 4 rooms (%)
Rooms in owner-occupied houses - 5 rooms (%)
Rooms in owner-occupied houses - 6 rooms (%)
Rooms in owner-occupied houses - 7 rooms (%)
Rooms in owner-occupied houses - 8 rooms (%)
Rooms in owner-occupied houses - 9+ rooms (%)
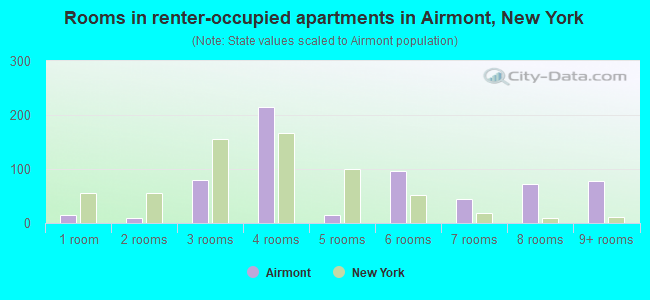
Rooms in renter-occupied houses - 1 room (%)
Rooms in renter-occupied houses - 2 rooms (%)
Rooms in renter-occupied houses - 3 rooms (%)
Rooms in renter-occupied houses - 4 rooms (%)
Rooms in renter-occupied houses - 5 rooms (%)
Rooms in renter-occupied houses - 6 rooms (%)
Rooms in renter-occupied houses - 7 rooms (%)
Rooms in renter-occupied houses - 8 rooms (%)
Rooms in renter-occupied houses - 9+ rooms (%)
Bedrooms in owner-occupied houses - no bedrooms (%)
Bedrooms in owner-occupied houses - 1 bedroom (%)
Bedrooms in owner-occupied houses - 2 bedrooms (%)
Bedrooms in owner-occupied houses - 3 bedrooms (%)
Bedrooms in owner-occupied houses - 4 bedrooms (%)
Bedrooms in owner-occupied houses - 5+ bedrooms (%)
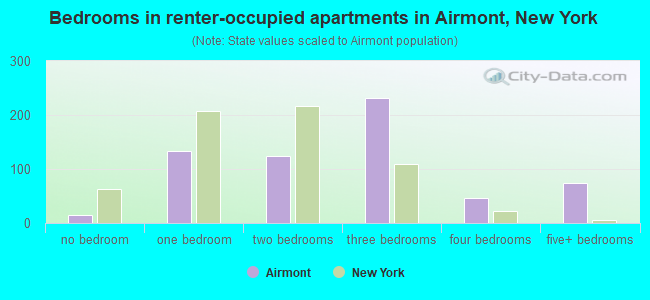
Bedrooms in renter-occupied houses - no bedrooms (%)
Bedrooms in renter-occupied houses - 1 bedroom (%)
Bedrooms in renter-occupied houses - 2 bedrooms (%)
Bedrooms in renter-occupied houses - 3 bedrooms (%)
Bedrooms in renter-occupied houses - 4 bedrooms (%)
Bedrooms in renter-occupied houses - 5+ bedrooms (%)
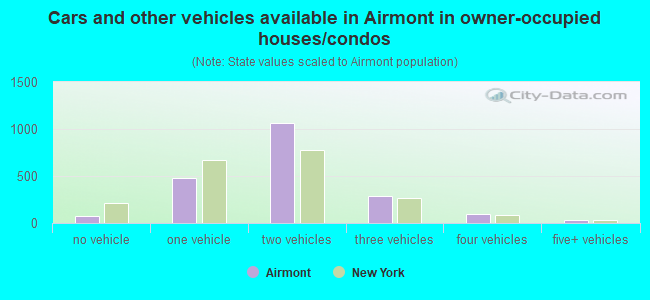
Vehicles available in owner-occupied houses - no vehicle available (%)
Vehicles available in owner-occupied houses - 1 vehicle available(%)
Vehicles available in owner-occupied houses - 2 Vehicles available (%)
Vehicles available in owner-occupied houses - 3 Vehicles available (%)
Vehicles available in owner-occupied houses - 4 Vehicles available (%)
Vehicles available in owner-occupied houses - 5+ Vehicles available (%)
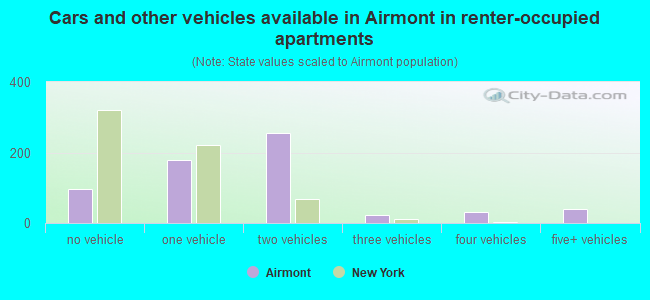
Vehicles available in renter-occupied houses - no vehicle available (%)
Vehicles available in renter-occupied houses - 1 vehicle available (%)
Vehicles available in renter-occupied houses - 2 Vehicles available (%)
Vehicles available in renter-occupied houses - 3 Vehicles available (%)
Vehicles available in renter-occupied houses - 4 Vehicles available (%)
Vehicles available in renter-occupied houses - 5+ Vehicles available (%)
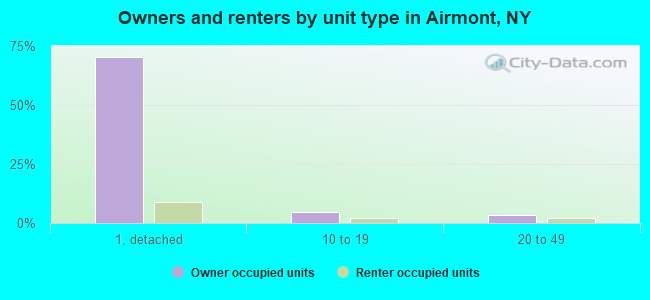
Housing units in structures - 1, detached (%)
Housing units in structures - 1, attached (%)
Housing units in structures - 2 (%)
Housing units in structures - 3 or 4 (%)
Housing units in structures - 5 to 9 (%)
Housing units in structures - 10 to 19 (%)
Housing units in structures - 20 to 49 (%)
Housing units in structures - 50 or more (%)
Housing units in structures - Mobile home (%)
Housing units in structures - Boat, RV, van, etc. (%)
Housing units in structures - Owners - 1, detached (%)
Housing units in structures - Owners - 1, attached (%)
Housing units in structures - Owners - 2 (%)
Housing units in structures - Owners - 3 or 4 (%)
Housing units in structures - Owners - 5 to 9 (%)
Housing units in structures - Owners - 10 to 19 (%)
Housing units in structures - Owners - 20 to 49 (%)
Housing units in structures - Owners - 50 or more (%)
Housing units in structures - Owners - Mobile home (%)
Housing units in structures - Owners - Boat, RV, van, etc. (%)
Housing units in structures - Renters - 1, detached (%)
Housing units in structures - Renters - 1, attached (%)
Housing units in structures - Renters - 2 (%)
Housing units in structures - Renters - 3 or 4 (%)
Housing units in structures - Renters - 5 to 9 (%)
Housing units in structures - Renters - 10 to 19 (%)
Housing units in structures - Renters - 20 to 49 (%)
Housing units in structures - Renters - 50 or more (%)
Housing units in structures - Renters - Mobile home (%)
Housing units in structures - Renters - Boat, RV, van, etc. (%)
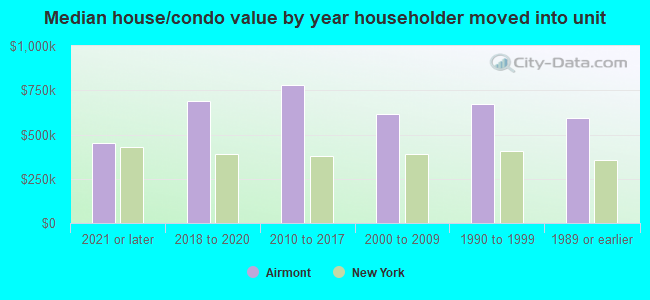
House/condo owner moved in on average (years ago)
Renter moved in on average (years ago)
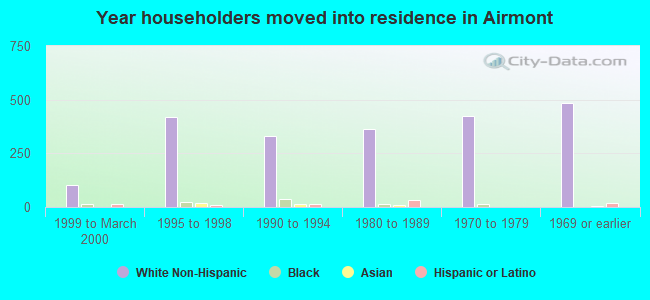
Year householder moved into unit - Moved in 1999 to March 2000 (%)
Year householder moved into unit - Moved in 1999 to March 2000 (%) - White
Year householder moved into unit - Moved in 1999 to March 2000 (%) - Black or African American
Year householder moved into unit - Moved in 1999 to March 2000 (%) - Asian
Year householder moved into unit - Moved in 1999 to March 2000 (%) - Hispanic or Latino
Year householder moved into unit - Moved in 1999 to March 2000 (%) - American Indian and Alaska Native
Year householder moved into unit - Moved in 1999 to March 2000 (%) - Multirace
Year householder moved into unit - Moved in 1999 to March 2000 (%) - Other Race
Year householder moved into unit - Moved in 1995 to 1998 (%)
Year householder moved into unit - Moved in 1995 to 1998 (%) - White
Year householder moved into unit - Moved in 1995 to 1998 (%) - Black or African American
Year householder moved into unit - Moved in 1995 to 1998 (%) - Asian
Year householder moved into unit - Moved in 1995 to 1998 (%) - Hispanic or Latino
Year householder moved into unit - Moved in 1995 to 1998 (%) - American Indian and Alaska Native
Year householder moved into unit - Moved in 1995 to 1998 (%) - Multirace
Year householder moved into unit - Moved in 1995 to 1998 (%) - Other Race
Year householder moved into unit - Moved in 1990 to 1994 (%)
Year householder moved into unit - Moved in 1990 to 1994 (%) - White
Year householder moved into unit - Moved in 1990 to 1994 (%) - Black or African American
Year householder moved into unit - Moved in 1990 to 1994 (%) - Asian
Year householder moved into unit - Moved in 1990 to 1994 (%) - Hispanic or Latino
Year householder moved into unit - Moved in 1990 to 1994 (%) - American Indian and Alaska Native
Year householder moved into unit - Moved in 1990 to 1994 (%) - Multirace
Year householder moved into unit - Moved in 1990 to 1994 (%) - Other Race
Year householder moved into unit - Moved in 1980 to 1989 (%)
Year householder moved into unit - Moved in 1980 to 1989 (%) - White
Year householder moved into unit - Moved in 1980 to 1989 (%) - Black or African American
Year householder moved into unit - Moved in 1980 to 1989 (%) - Asian
Year householder moved into unit - Moved in 1980 to 1989 (%) - Hispanic or Latino
Year householder moved into unit - Moved in 1980 to 1989 (%) - American Indian and Alaska Native
Year householder moved into unit - Moved in 1980 to 1989 (%) - Multirace
Year householder moved into unit - Moved in 1980 to 1989 (%) - Other Race
Year householder moved into unit - Moved in 1970 to 1979 (%)
Year householder moved into unit - Moved in 1970 to 1979 (%) - White
Year householder moved into unit - Moved in 1970 to 1979 (%) - Black or African American
Year householder moved into unit - Moved in 1970 to 1979 (%) - Asian
Year householder moved into unit - Moved in 1970 to 1979 (%) - Hispanic or Latino
Year householder moved into unit - Moved in 1970 to 1979 (%) - American Indian and Alaska Native
Year householder moved into unit - Moved in 1970 to 1979 (%) - Multirace
Year householder moved into unit - Moved in 1970 to 1979 (%) - Other Race
Year householder moved into unit - Moved in 1969 or earlier (%)
Year householder moved into unit - Moved in 1969 or earlier (%) - White
Year householder moved into unit - Moved in 1969 or earlier (%) - Black or African American
Year householder moved into unit - Moved in 1969 or earlier (%) - Asian
Year householder moved into unit - Moved in 1969 or earlier (%) - Hispanic or Latino
Year householder moved into unit - Moved in 1969 or earlier (%) - American Indian and Alaska Native
Year householder moved into unit - Moved in 1969 or earlier (%) - Multirace
Year householder moved into unit - Moved in 1969 or earlier (%) - Other Race
Housing units lacking complete plumbing facilities (%)
Housing units lacking complete kitchen facilities (%)
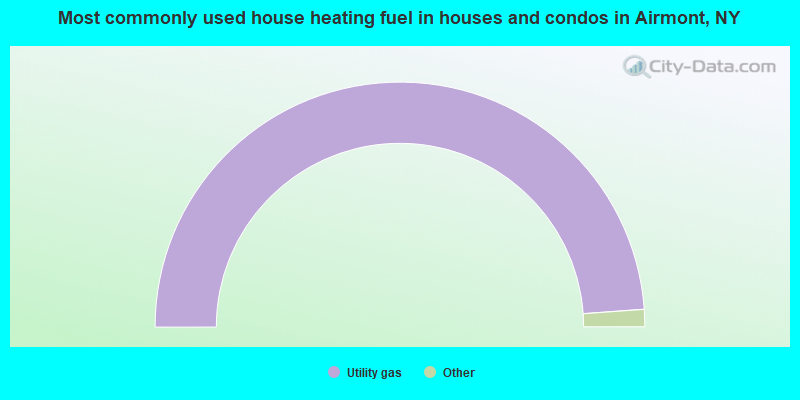
House heating fuel used in houses and condos - Utility gas (%)
House heating fuel used in houses and condos - Bottled, tank, or LP gas (%)
House heating fuel used in houses and condos - Electricity (%)
House heating fuel used in houses and condos - Fuel oil, kerosene, etc. (%)
House heating fuel used in houses and condos - Coal or coke (%)
House heating fuel used in houses and condos - Wood (%)
House heating fuel used in houses and condos - Solar energy (%)
House heating fuel used in houses and condos - Other fuel (%)
House heating fuel used in houses and condos - No fuel used (%)
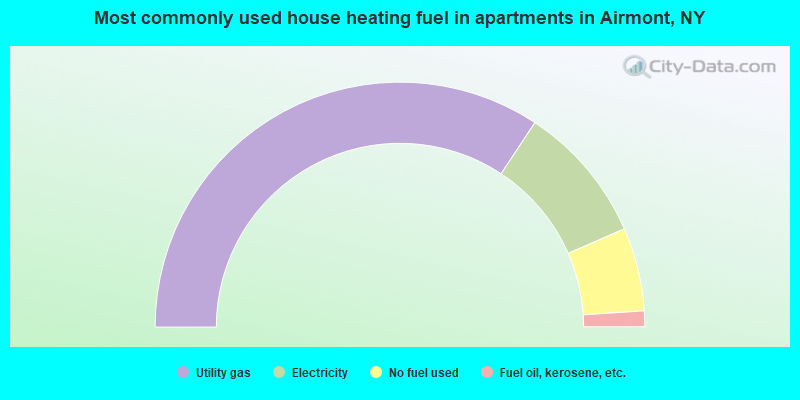
House heating fuel used in apartments - Utility gas (%)
House heating fuel used in apartments - Bottled, tank, or LP gas (%)
House heating fuel used in apartments - Electricity (%)
House heating fuel used in apartments - Fuel oil, kerosene, etc. (%)
House heating fuel used in apartments - Coal or coke (%)
House heating fuel used in apartments - Wood (%)
House heating fuel used in apartments - Solar energy (%)
House heating fuel used in apartments - Other fuel (%)
House heating fuel used in apartments - No fuel used (%)
Latest news about housing in Airmont, NY collected exclusively by city-data.com from local newspapers, TV, and radio stations
Median year house/condo built: 1968Median year apartment built: 1973Household type by relationship:
Households: 10,070
Male householders: 1,558 (138 living alone ), Female householders: 1,089 (285 living alone )1,811 spouses (1,790 opposite-sex spouses ), 100 unmarried partners , (100 opposite-sex unmarried partners ), 4,747 children (4,679 natural , 33 adopted , 35 stepchildren ), 114 grandchildren , 23 brothers or sisters , 100 parents , 0 foster children , 215 other relatives , 76 non-relatives In group quarters: 233
Size of family households: 623 2-persons , 378 3-persons , 381 4-persons , 246 5-persons , 229 6-persons , 234 7-or-more-persons .
Size of nonfamily households: 492 1-person , 28 2-persons , 9 3-persons , 7 4-persons .
2,975 married couples with children. single-parent households (0 men , 284 women ).
60.5% of residents of Airmont speak English at home. of residents speak Spanish at home (75% speak English very well , 17% speak English well , 8% speak English not well ).of residents speak other Indo-European language at home (61% speak English very well , 33% speak English well , 6% speak English not well ).of residents speak Asian or Pacific Island language at home (90% speak English very well , 10% speak English not well ).of residents speak other language at home (44% speak English very well , 56% speak English well ).
Foreign born population: 1,279 (12.7%)of them are naturalized citizens )
Median number of rooms in houses and condos:
Median number of rooms in apartments
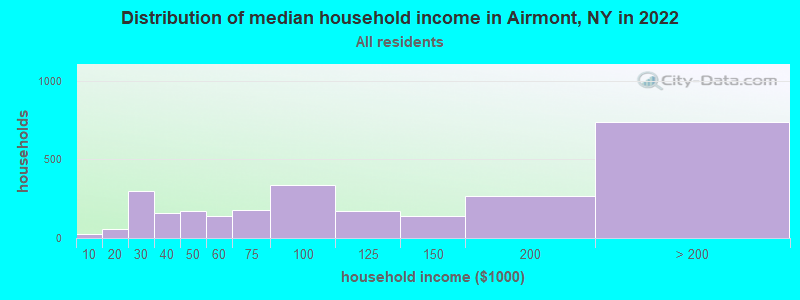
Airmont, NY household income distribution 28 Less than $10,00055 $10,000 to $19,999299 $20,000 to $29,999156 $30,000 to $39,999171 $40,000 to $49,999138 $50,000 to $59,999175 $60,000 to $74,999334 $75,000 to $99,999170 $100,000 to $124,999141 $125,000 to $149,999266 $150,000 to $199,999737 $200,000 or more
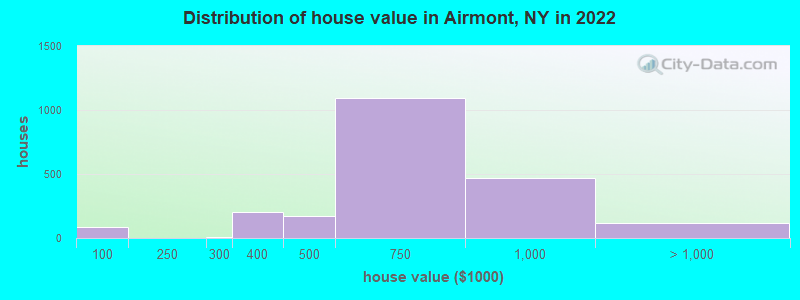
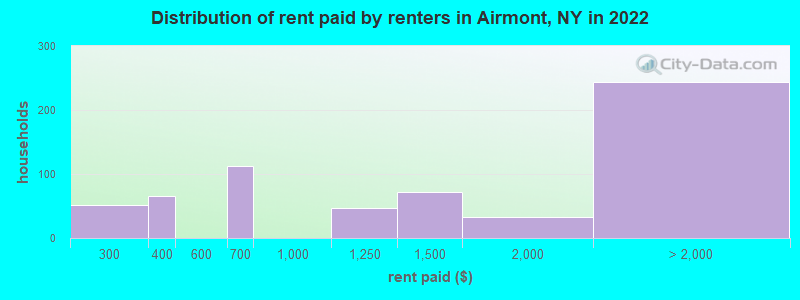
Home value of owner - occupied houses in 2022 in Airmont, NY 16 $50,000 to $59,99965 $80,000 to $89,9992 $90,000 to $99,9997 $250,000 to $299,999205 $300,000 to $399,999172 $400,000 to $499,9991,096 $500,000 to $749,999468 $750,000 to $999,99968 $1,000,000 to $1,499,99949 $2,000,000 or moreRent paid by renters in 2022 in Airmont, NY 51 $200 to $24949 $300 to $34916 $350 to $399111 $600 to $64946 $1,000 to $1,24972 $1,250 to $1,49932 $1,500 to $1,999104 $2,000 to $2,49922 $2,500 to $2,9996 $3,000 to $3,49949 $3,500 or more60 No cash rent
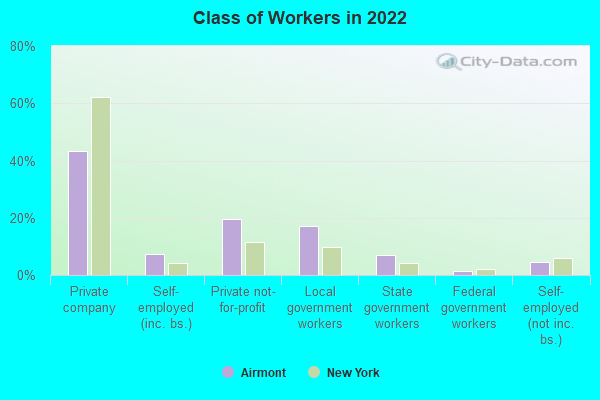
Percentage of workers working in this county: 56.8%Number of people working at home: 488 (14.2% of all workers )
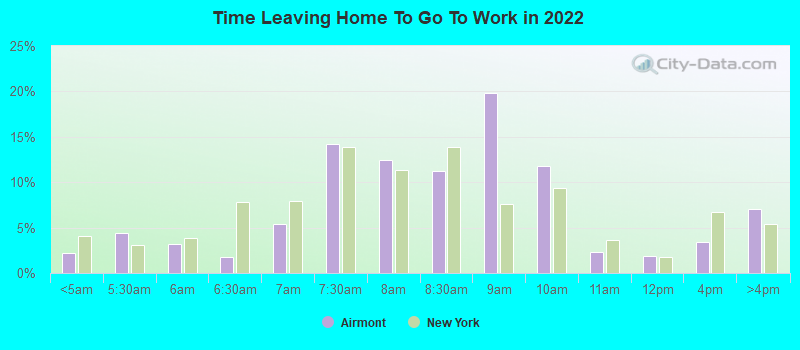
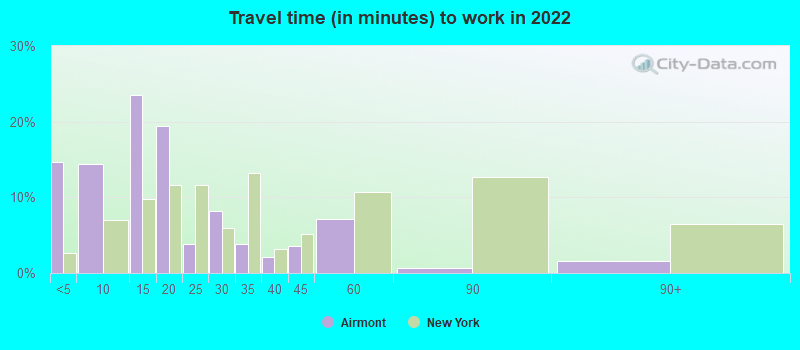
Travel time to work (commute)
Less than 5 minutes: 1155 to 9 minutes: 46310 to 14 minutes: 47015 to 19 minutes: 37320 to 24 minutes: 14825 to 29 minutes: 15630 to 34 minutes: 39935 to 39 minutes: 14640 to 44 minutes: 5545 to 59 minutes: 14260 to 89 minutes: 25190 or more minutes: 247
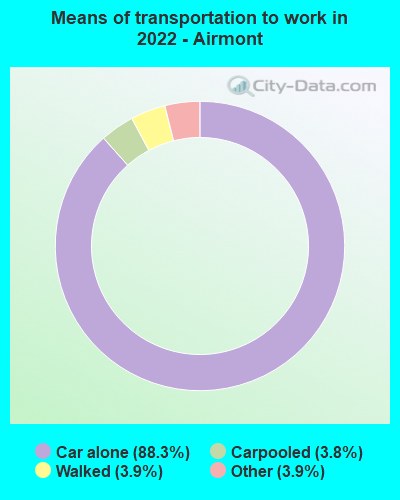
Means of transportation to work:
Drove a car alone: 1,289 (65.0%)Carpooled: 70 (3.5%)Taxi: 78 (3.9%)Walked: 73 (3.7%)Worked at home: 488 (24.6%)
Unemployment by race in 2022
Unemployment rate for White non-Hispanic residents 3.1% Males6.0% FemalesUnemployment rate for Black residents 25.7% FemalesUnemployment rate for Asian residents 31.5% MalesUnemployment rate for two or more race residents 13.5% MalesUnemployment rate for Hispanic or Latino residents 18.3% Males6.9% Females
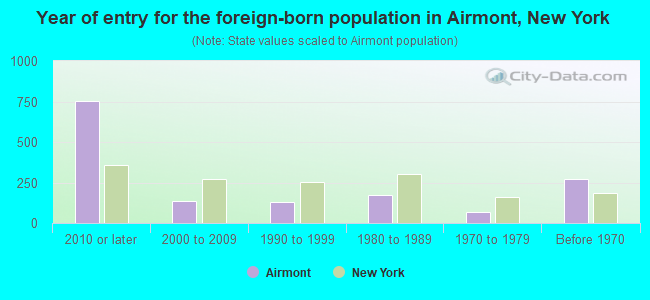
Year of entry for the foreign-born population in Airmont, New York
755 2010 or later 138 2000 to 2009 129 1990 to 1999 174 1980 to 1989 65 1970 to 1979 270 Before 1970
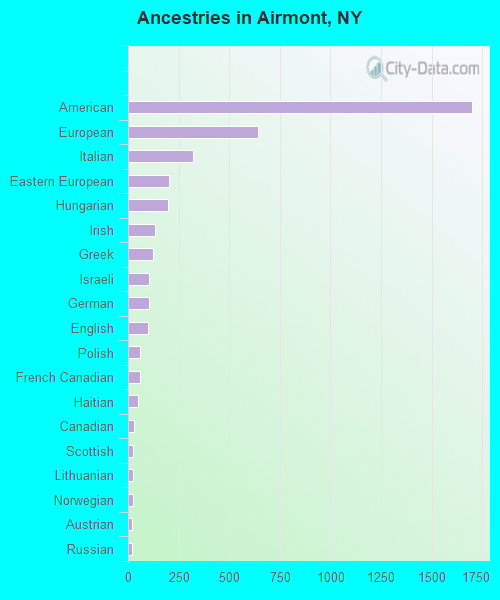
First ancestries reported:
American: 1,699 (32.2%)
European: 640 (12.1%)
Italian: 322 (6.1%)
Eastern European: 204 (3.9%)
Hungarian: 199 (3.8%)
Irish: 134 (2.5%)
Greek: 125 (2.4%)
Israeli: 103 (2.0%)
German: 102 (1.9%)
English: 98 (1.9%)
Polish: 61 (1.2%)
French Canadian: 60 (1.1%)
Haitian: 47 (0.9%)
Canadian: 29 (0.5%)
Scottish: 26 (0.5%)
Lithuanian: 25 (0.5%)
Norwegian: 24 (0.5%)
Austrian: 19 (0.4%)
Russian: 19 (0.4%)
Latvian: 11 (0.2%)
West Indian: 11 (0.2%)
Ukrainian: 10 (0.2%)
Scotch-Irish: 8 (0.2%)
Slovak: 8 (0.2%)
Jamaican: 7 (0.1%)
Croatian: 6 (0.1%)
French: 5 (0.09%)
British: 2 (0.04%) Most common places of birth for foreign-born residents (%): England Airmont:
31.1% (404)New York:
0.5% (23,058)
Israel Airmont:
13.1% (170)New York:
0.7% (29,743)
Philippines Airmont:
6.2% (80)New York:
2.0% (91,070)
Ecuador Airmont:
5.7% (74)New York:
3.9% (177,448)
Mexico Airmont:
3.8% (50)New York:
4.8% (214,559)
Other Eastern Africa Airmont:
3.6% (47)New York:
0.1% (5,468)
Colombia Airmont:
3.5% (45)New York:
2.5% (111,920)
Cambodia Airmont:
3.2% (41)New York:
0.1% (3,044)
Greece Airmont:
3.0% (39)New York:
0.6% (28,604)
Germany Airmont:
2.3% (30)New York:
0.9% (38,713)
India Airmont:
2.2% (29)New York:
3.5% (158,432)
Haiti Airmont:
2.2% (29)New York:
2.8% (126,936)
Austria Airmont:
1.8% (23)New York:
0.1% (4,732)
Saudi Arabia Airmont:
1.7% (22)New York:
0.1% (3,194)
Argentina Airmont:
1.7% (22)New York:
0.5% (21,928)
Russia Airmont:
1.5% (20)New York:
1.7% (75,802)
Place of birth for U.S.-born residents:
This state: 6,944Other state: 1,342Northeast: 793Midwest: 224South: 138West: 144 85.6% of Airmont residents lived in the same house 1 years ago.
Out of people who lived in different houses, 30.2% lived in this county.
Out of people who lived in different counties, 86.3% lived in New York.
Airmont:
85.6%State average:
89.6%
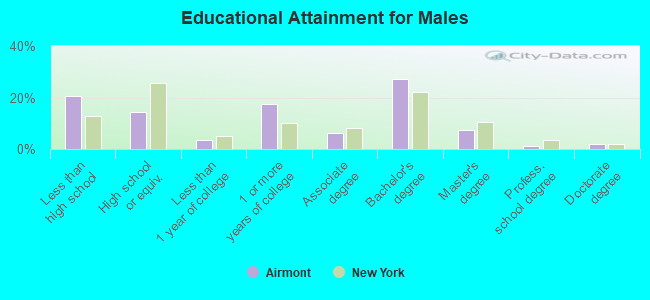
Education attainment for males 25 years and older:
No schooling: 104Nursery to 4th grade: 25th and 6th grade: 137th and 8th grade: 559th grade: 010th grade: 611th grade: 3112th grade, no diploma: 324High school graduate (or equivalency): 377Less than 1 year of college: 95Some college more than 1 year, no degree: 460Associate degree: 165Bachelor's degree: 712Master's degree: 189Professional school degree: 29Doctorate degree: 52
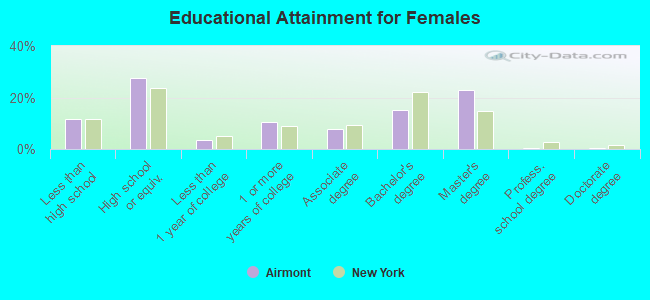
Education attainment for females 25 years and older:
No schooling: 62Nursery to 4th grade: 05th and 6th grade: 477th and 8th grade: 259th grade: 610th grade: 6811th grade: 012th grade, no diploma: 142High school graduate (or equivalency): 818Less than 1 year of college: 98Some college more than 1 year, no degree: 315Associate degree: 226Bachelor's degree: 453Master's degree: 679Professional school degree: 9Doctorate degree: 16
Housing units in structures:
One, detached: 2,248Two: 1263 or 4: 465 to 9: 1010 to 19: 14320 to 49: 13350 or more: 119Housing units lacking complete plumbing facilities in 2022: 1.0%House/condo owner moved in on average 17 years ago
Renter moved in on average 4 years ago
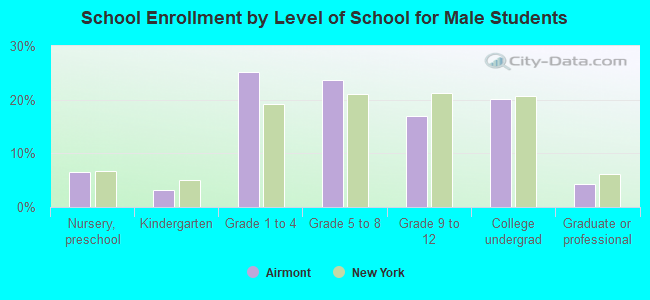
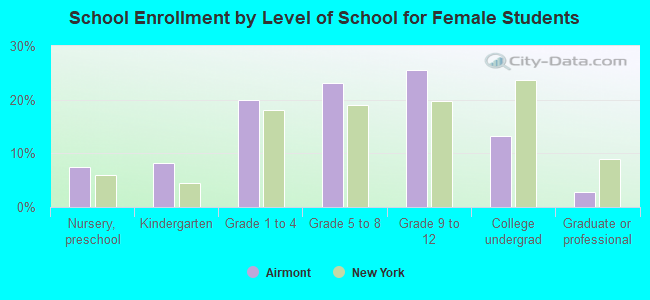
Private vs. public school enrollment:
Students in private schools in grades 1 to 8 (elementary and middle school): 1,210 Students in private schools in grades 9 to 12 (high school): 481 Students in private undergraduate colleges: 436