Albemarle, NC (North Carolina) Houses and Residents
| Albemarle: | $183,483 |
| North Carolina: | $280,600 |
Total population: 15,976 (Urban population: 15,109 (all inside urban clusters), Rural population: 497 (all nonfarm))
Houses: 8,155 (6,745 occupied: 3,956 owner occupied, 2,887 renter occupied)
| % of renters here: | 42% |
| State: | 33% |
Housing density: 520 houses/condos per square mile
Median price asked for vacant for-sale houses and condos in 2022: $297,518.
Median contract rent in 2022: $634 (lower quartile is $447, upper quartile is $835)
Median rent asked for vacant for-rent units in 2022: $766
Median gross rent in Albemarle, NC in 2022: $893
Housing units in Albemarle with a mortgage: 2,328 (342 second mortgage, 0 home equity loan, 360 both second mortgage and home equity loan)
Houses without a mortgage: 76
Median household income for houses/condos with a mortgage: $92,275
Median household income for apartments without a mortgage: $56,737
Median monthly housing costs: $872
Compare current foreclosures near Albemarle, NC:
| Photo | Address | Area | Beds / Baths | Price | Details |
|---|---|---|---|---|---|

|
#1
Fink Rd
Albemarle, NC 28001
|
1,386 sq. feet
|
2 baths 3 beds |
$107,000
|
show details |

|
#2
Plantation Way
Albemarle, NC 28001
|
1,365 sq. feet
|
2 baths 3 beds |
show details | |

|
#3
Park Rd
Albemarle, NC 28001
|
1,360 sq. feet
|
1 baths 3 beds |
show details | |

|
#4
Vickers Store Rd
Albemarle, NC 28001
|
924 sq. feet
|
2 baths 3 beds |
show details | |

|
#5
W Main St
Albemarle, NC 28001
|
1,040 sq. feet
|
1 baths 2 beds |
show details | |

|
#6
Canton Rd
Albemarle, NC 28001
|
1,386 sq. feet
|
1 baths 3 beds |
show details | |

|
#7
Woodcrest Ln
Albemarle, NC 28001
|
1,416 sq. feet
|
2 baths 3 beds |
show details | |

|
#8
Ash St
Albemarle, NC 28001
|
756 sq. feet
|
1 baths 1 beds |
show details | |

|
#9
N 5th St
Albemarle, NC 28001
|
2,016 sq. feet
|
2 baths 3 beds |
show details | |

|
#10
City Lake Dr
Albemarle, NC 28001
|
1,260 sq. feet
|
1 baths 3 beds |
show details |
| Photo | Address | Area | Beds / Baths | Price | Details |
|---|---|---|---|---|---|

|
#11
Holt Rd
Albemarle, NC 28001
|
1,593 sq. feet
|
2 baths 3 beds |
show details | |

|
#12
Woodhaven Dr Apt 1102
Albemarle, NC 28001
|
- sq. feet
|
- baths - beds |
show details | |

|
#13
Guard Rd Apt E
Albemarle, NC 28001
|
- sq. feet
|
- baths - beds |
show details | |

|
#14
Yadkin Brick Rd
New London, NC 28127
|
1,610 sq. feet
|
2 baths 3 beds |
show details | |

|
#15
Cherokee Ln
New London, NC 28127
|
1,900 sq. feet
|
2 baths 4 beds |
show details | |

|
#16
Liberty Rd
Gold Hill, NC 28071
|
2,096 sq. feet
|
2 baths - beds |
show details | |

|
#17
Boundary Rd
Oakboro, NC 28129
|
1,265 sq. feet
|
2 baths 3 beds |
show details | |

|
#18
Eagle St
Mount Pleasant, NC 28124
|
1,140 sq. feet
|
1 baths 3 beds |
show details | |

|
#19
Faith St
Oakboro, NC 28129
|
1,374 sq. feet
|
2 baths 3 beds |
show details | |

|
#20
Laurel Oak Ave
Oakboro, NC 28129
|
1,728 sq. feet
|
2 baths 3 beds |
show details |
| Photo | Address | Area | Beds / Baths | Price | Details |
|---|---|---|---|---|---|

|
#21
Finger Rd
Mount Pleasant, NC 28124
|
952 sq. feet
|
1 baths 2 beds |
show details | |

|
#22
Fox Trail Rd
Oakboro, NC 28129
|
1,156 sq. feet
|
2 baths 3 beds |
show details | |

|
#23
Eastover Ave
Norwood, NC 28128
|
1,660 sq. feet
|
2 baths 4 beds |
show details | |

|
#24
Rocky River Springs Rd
Norwood, NC 28128
|
1,144 sq. feet
|
2 baths 3 beds |
show details | |

|
#25
Kyle Ln
Mount Pleasant, NC 28124
|
2,280 sq. feet
|
2 baths 3 beds |
show details | |

|
#26
Gold Hill Rd
Concord, NC 28025
|
1,152 sq. feet
|
1 baths 3 beds |
show details | |

|
#27
Old Whitney Rd
New London, NC 28127
|
2,871 sq. feet
|
3 baths 3 beds |
show details | |

|
#28
Charles Mountain Rd
Denton, NC 27239
|
1,540 sq. feet
|
1 baths - beds |
show details | |

|
#29
Saint Peters Church Rd
Gold Hill, NC 28071
|
1,713 sq. feet
|
2 baths - beds |
show details | |

|
#30
Rd
Rockwell, NC 28138
|
- sq. feet
|
- baths - beds |
show details |
| Photo | Address | Area | Beds / Baths | Price | Details |
|---|---|---|---|---|---|

|
#31
Megan Dr
Rockwell, NC 28138
|
- sq. feet
|
- baths - beds |
show details | |

|
#32
Ivey St
Troy, NC 27371
|
- sq. feet
|
- baths - beds |
show details | |

|
#33
Meadow Creek Church Rd
Locust, NC 28097
|
- sq. feet
|
- baths - beds |
show details | |

|
#34
Kerri Dawn Ln
Locust, NC 28097
|
- sq. feet
|
- baths - beds |
show details | |

|
#35
Kingston Dr
Locust, NC 28097
|
- sq. feet
|
- baths - beds |
show details | |

|
#36
Wildflower Dr
Locust, NC 28097
|
- sq. feet
|
- baths - beds |
show details | |

|
#37
Running Creek Church Rd
Locust, NC 28097
|
- sq. feet
|
- baths - beds |
show details | |

|
#38
Delancy St
Locust, NC 28097
|
- sq. feet
|
- baths - beds |
show details | |

|
#39
Saint Johns Dr
Stanfield, NC 28163
|
- sq. feet
|
- baths - beds |
show details | |

|
#40
Dutch Rd
Mount Pleasant, NC 28124
|
- sq. feet
|
- baths - beds |
show details |
| Photo | Address | Area | Beds / Baths | Price | Details |
|---|---|---|---|---|---|

|
#41
Hathcock Glen Dr
Oakboro, NC 28129
|
- sq. feet
|
- baths - beds |
show details | |

|
#42
Bo Run Dr
Oakboro, NC 28129
|
- sq. feet
|
- baths - beds |
show details | |

|
#43
Correll Rd
Troy, NC 27371
|
1,458 sq. feet
|
- baths - beds |
show details | |

|
#44
Liberty Hill Church Rd
Mount Gilead, NC 27306
|
- sq. feet
|
- baths - beds |
show details | |

|
#45
Rubys Way
Oakboro, NC 28129
|
- sq. feet
|
- baths - beds |
show details | |

|
#46
Smith Grove Rd
Oakboro, NC 28129
|
- sq. feet
|
- baths - beds |
show details | |

|
#47
Gold Hill Rd E
Gold Hill, NC 28071
|
- sq. feet
|
- baths - beds |
show details | |

|
#48
Woodline Dr
Troy, NC 27371
|
1,696 sq. feet
|
- baths - beds |
show details | |

|
#49
Lantern Ct.
Mount Gilead, NC 27306
|
- sq. feet
|
- baths - beds |
show details | |

|
Check over 1 million property listings on Foreclosure.com!
|
browse all offers | |||

Latest news about housing in Albemarle, NC collected exclusively by city-data.com from local newspapers, TV, and radio stations

 | Looking for homes under $145,000....i know (16 replies) |
| Real Estate Market Devastation (18 replies) |
| Albemarle, NC Apartments (0 replies) |
| Is Charlotte building too many apartments? (31 replies) |
| Eastway - Sheffield Park Homes (Crime, Safety, First Time Homebuyer) (12 replies) |
| Young professional moving to Charlotte - apartments in/near the city? (20 replies) |

Median year apartment built: 1970
Household type by relationship:
Households: 16,803- Male householders: 3,124 (987 living alone), Female householders: 3,552 (1,211 living alone)
2,457 spouses (2,430 opposite-sex spouses), 542 unmarried partners, (508 opposite-sex unmarried partners), 4,668 children (4,423 natural, 13 adopted, 231 stepchildren), 315 grandchildren, 184 brothers or sisters, 492 parents, 0 foster children, 256 other relatives, 451 non-relatives
- In group quarters: 755
Size of family households: 2,114 2-persons, 1,106 3-persons, 597 4-persons, 269 5-persons, 144 6-persons, 75 7-or-more-persons.
Size of nonfamily households: 2,237 1-person, 276 2-persons, 29 4-persons.
1,218 married couples with children.
1,932 single-parent households (376 men, 1,556 women).
91.0% of residents of Albemarle speak English at home.
5.1% of residents speak Spanish at home (60% speak English very well, 28% speak English well, 12% speak English not well).
1.7% of residents speak other Indo-European language at home (87% speak English very well, 6% speak English well, 7% speak English not well).
2.4% of residents speak Asian or Pacific Island language at home (63% speak English very well, 37% speak English not well).
Foreign born population: 842 (5.0%)
(58.7% of them are naturalized citizens)
| Here: | 5.8 |
| State: | 6.4 |
| Here: | 4.4 |
| State: | 4.4 |

- Bedrooms in owner-occupied houses and condos in Albemarle, North Carolina
- 0no bedroom
- 371 bedroom
- 9302 bedrooms
- 2,0383 bedrooms
- 7724 bedrooms
- 1805+ bedrooms

- Bedrooms in renter-occupied apartments in Albemarle, North Carolina
- 60no bedroom
- 7501 bedroom
- 8762 bedrooms
- 1,0653 bedrooms
- 1374 bedrooms
- 05+ bedrooms

- Cars and other vehicles available in Albemarle in owner-occupied houses/condos
- 66no vehicle
- 8761 vehicle
- 1,6252 vehicles
- 8163 vehicles
- 4194 vehicles
- 1555+ vehicles

- Cars and other vehicles available in Albemarle in renter-occupied apartments
- 581no vehicle
- 1,3221 vehicle
- 8062 vehicles
- 1293 vehicles
- 494 vehicles
- 05+ vehicles

- Rooms in owner-occupied houses in Albemarle, North Carolina
- 01 room
- 02 rooms
- 473 rooms
- 5464 rooms
- 1,1275 rooms
- 8636 rooms
- 5257 rooms
- 2138 rooms
- 6379+ rooms

- Rooms in renter-occupied apartments in Albemarle, North Carolina
- 601 room
- 512 rooms
- 7063 rooms
- 6784 rooms
- 8745 rooms
- 3136 rooms
- 1477 rooms
- 198 rooms
- 409+ rooms


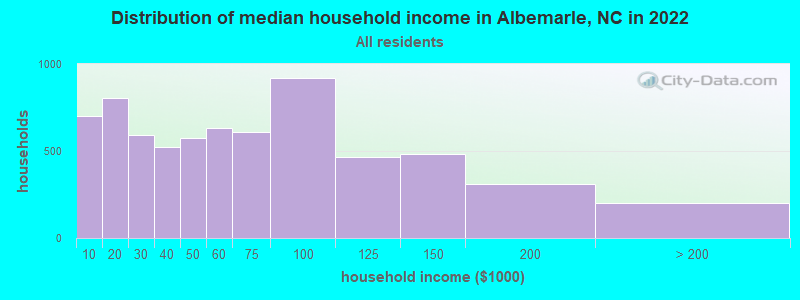
Albemarle, NC household income distribution

- 699Less than $10,000
- 804$10,000 to $19,999
- 592$20,000 to $29,999
- 522$30,000 to $39,999
- 573$40,000 to $49,999
- 631$50,000 to $59,999
- 607$60,000 to $74,999
- 920$75,000 to $99,999
- 467$100,000 to $124,999
- 482$125,000 to $149,999
- 312$150,000 to $199,999
- 200$200,000 or more
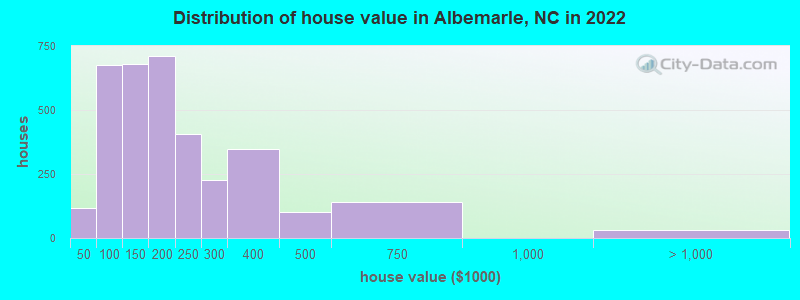
Home value of owner - occupied houses in 2022 in Albemarle, NC
-
- 34Less than $10,000
- 8$10,000 to $14,999
- 9$20,000 to $24,999
- 20$35,000 to $39,999
- 45$40,000 to $49,999
- 168$50,000 to $59,999
- 21$60,000 to $69,999
- 137$70,000 to $79,999
- 102$80,000 to $89,999
- 197$90,000 to $99,999
- 412$100,000 to $124,999
- 264$125,000 to $149,999
- 412$150,000 to $174,999
- 297$175,000 to $199,999
- 406$200,000 to $249,999
- 226$250,000 to $299,999
- 345$300,000 to $399,999
- 101$400,000 to $499,999
- 139$500,000 to $749,999
- 30$2,000,000 or more
Rent paid by renters in 2022 in Albemarle, NC
-
- 90Less than $100
- 138$150 to $199
- 27$200 to $249
- 89$250 to $299
- 17$300 to $349
- 84$350 to $399
- 195$400 to $449
- 161$450 to $499
- 93$500 to $549
- 175$550 to $599
- 133$600 to $649
- 133$650 to $699
- 157$700 to $749
- 410$750 to $799
- 71$800 to $899
- 123$900 to $999
- 92$1,000 to $1,249
- 10$1,500 to $1,999
- 356No cash rent


Percentage of workers working in this county: 70.0%
Number of people working at home: 570 (7.6% of all workers)
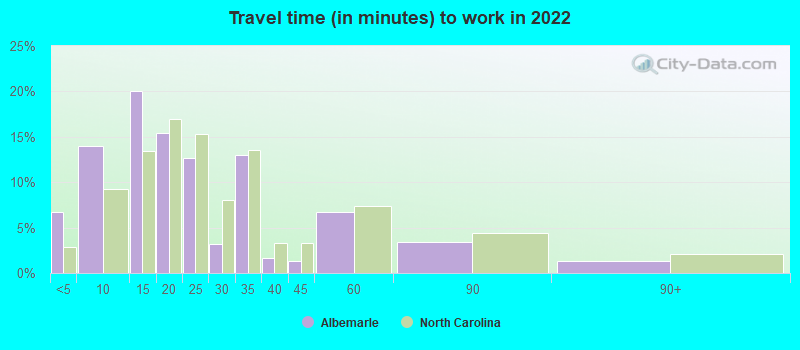
Travel time to work (commute)
- Less than 5 minutes: 493
- 5 to 9 minutes: 1,137
- 10 to 14 minutes: 1,563
- 15 to 19 minutes: 436
- 20 to 24 minutes: 783
- 25 to 29 minutes: 257
- 30 to 34 minutes: 396
- 35 to 39 minutes: 75
- 40 to 44 minutes: 140
- 45 to 59 minutes: 442
- 60 to 89 minutes: 613
- 90 or more minutes: 310
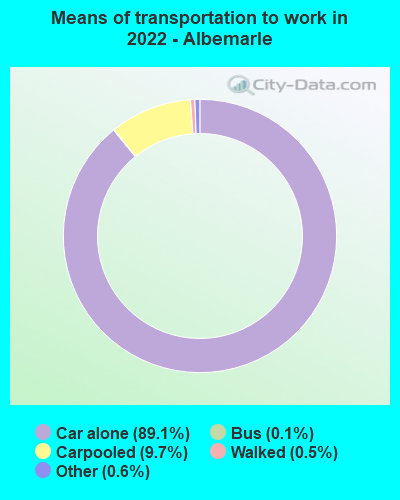
Means of transportation to work:
- Drove a car alone: 9,009 (81.1%)
- Carpooled: 1,019 (9.2%)
- Bus: 8 (0.1%)
- Taxi: 66 (0.6%)
- Walked: 55 (0.5%)
- Worked at home: 570 (5.1%)

- Unemployment by race in 2022
- Unemployment rate for White non-Hispanic residents
- 4.4%Males
- 2.8%Females
- Unemployment rate for Black residents
- 9.0%Males
- 10.2%Females

- Year of entry for the foreign-born population in Albemarle, North Carolina
- 1842010 or later
- 2972000 to 2009
- 1581990 to 1999
- 1351980 to 1989
- 211970 to 1979
- 30Before 1970

First ancestries reported:
- American: 1,203 (16.5%)
- German: 639 (8.8%)
- English: 617 (8.5%)
- Irish: 299 (4.1%)
- European: 190 (2.6%)
- Scottish: 179 (2.5%)
- Scotch-Irish: 154 (2.1%)
- Haitian: 117 (1.6%)
- Polish: 74 (1.0%)
- French: 69 (0.9%)
- Greek: 46 (0.6%)
- Italian: 40 (0.5%)
- African: 31 (0.4%)
- British: 21 (0.3%)
- Norwegian: 17 (0.2%)
- Jamaican: 12 (0.2%)
- Scandinavian: 9 (0.1%)
- Israeli: 5 (0.07%)
- Austrian: 4 (0.05%)
Most common places of birth for foreign-born residents (%):
| Albemarle: | 50.4% (424) |
| North Carolina: | 24.7% (214,776) |
| Albemarle: | 13.5% (114) |
| North Carolina: | 2.9% (24,965) |
| Albemarle: | 10.3% (87) |
| North Carolina: | 0.6% (4,983) |
| Albemarle: | 9.4% (79) |
| North Carolina: | 9.3% (80,594) |
| Albemarle: | 5.5% (46) |
| North Carolina: | 2.4% (20,695) |
| Albemarle: | 3.2% (27) |
| North Carolina: | 2.1% (18,105) |
| Albemarle: | 2.1% (18) |
| North Carolina: | 0.6% (5,018) |
Place of birth for U.S.-born residents:
- This state: 12,149
- Other state: 3,591
- Northeast: 949
- Midwest: 478
- South: 1,694
- West: 469
83.4% of Albemarle residents lived in the same house 1 years ago.
Out of people who lived in different houses, 31.1% lived in this county.
Out of people who lived in different counties, 91.4% lived in North Carolina.
| Albemarle: | 83.4% |
| State average: | 87.3% |
Education attainment for males 25 years and older:
- No schooling: 77
- Nursery to 4th grade: 64
- 5th and 6th grade: 10
- 7th and 8th grade: 193
- 9th grade: 105
- 10th grade: 217
- 11th grade: 177
- 12th grade, no diploma: 151
- High school graduate (or equivalency): 1,679
- Less than 1 year of college: 404
- Some college more than 1 year, no degree: 624
- Associate degree: 486
- Bachelor's degree: 892
- Master's degree: 201
- Professional school degree: 119
- Doctorate degree: 15

Education attainment for females 25 years and older:
- No schooling: 136
- Nursery to 4th grade: 0
- 5th and 6th grade: 28
- 7th and 8th grade: 38
- 9th grade: 101
- 10th grade: 80
- 11th grade: 108
- 12th grade, no diploma: 87
- High school graduate (or equivalency): 2,094
- Less than 1 year of college: 521
- Some college more than 1 year, no degree: 831
- Associate degree: 887
- Bachelor's degree: 1,069
- Master's degree: 286
- Professional school degree: 62
- Doctorate degree: 0


Housing units in structures:
- One, detached: 6,471
- One, attached: 37
- Two: 309
- 3 or 4: 643
- 5 to 9: 399
- 10 to 19: 13
- 20 to 49: 30
- 50 or more: 33
- Mobile homes: 217
Housing units lacking complete kitchen facilities in 2022: 7.3%
House/condo owner moved in on average 16 years ago
Renter moved in on average 5 years ago

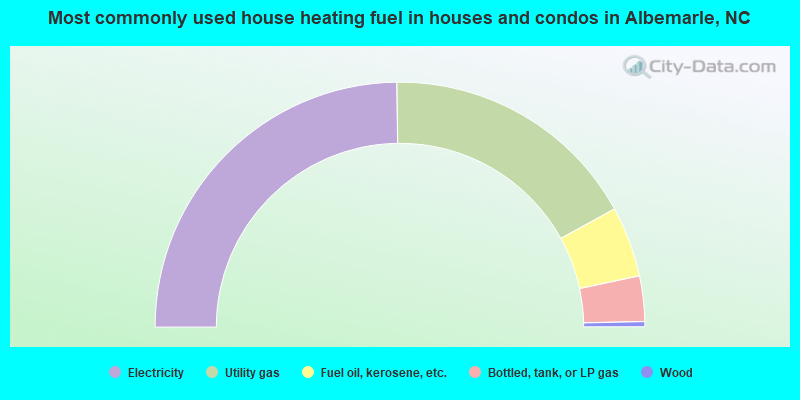
- 49.6%Electricity
- 34.4%Utility gas
- 9.3%Fuel oil, kerosene, etc.
- 6.0%Bottled, tank, or LP gas
- 0.7%Wood
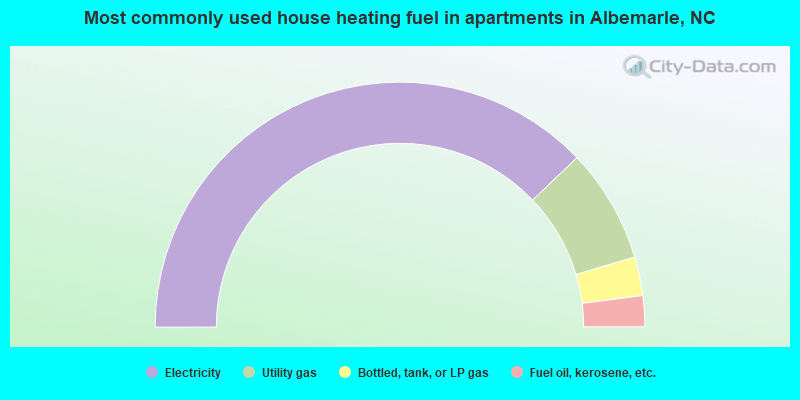
- 75.7%Electricity
- 15.1%Utility gas
- 5.1%Bottled, tank, or LP gas
- 4.1%Fuel oil, kerosene, etc.
Private vs. public school enrollment:
| Here: | 11.3% |
| North Carolina: | 13.8% |
| Here: | 4.3% |
| North Carolina: | 11.9% |
| Here: | 32.9% |
| North Carolina: | 19.3% |


