Albion, IN (Indiana) Houses and Residents
| Albion: | $131,063 |
| Indiana: | $208,700 |
Mean price in 2022:
Detached houses: $334,183
Here: $334,183 State: $257,916 Mobile homes: $118,290
Here: $118,290 State: $67,116
Total population: 2,319 (Urban population: 0, Rural population: 2,292 (all nonfarm))
Houses: 952 (878 occupied: 526 owner occupied, 362 renter occupied)
| % of renters here: | 41% |
| State: | 29% |
Housing density: 682 houses/condos per square mile
Median price asked for vacant for-sale houses and condos in 2022: $7,879,696.
Median contract rent in 2022: $668 (lower quartile is $508, upper quartile is $796)
Median rent asked for vacant for-rent units in 2022: $939
Median gross rent in Albion, IN in 2022: $867
Housing units in Albion with a mortgage: 313 (38 second mortgage, 0 home equity loan, 27 both second mortgage and home equity loan)
Houses without a mortgage: 8
Median household income for houses/condos with a mortgage: $103,601
Median household income for apartments without a mortgage: $65,089
Median monthly housing costs: $847
Compare current foreclosures near Albion, IN:
| Photo | Address | Area | Beds / Baths | Price | Details |
|---|---|---|---|---|---|

|
#1
W Hazel St
Albion, IN 46701
|
1,578 sq. feet
|
1 baths 4 beds |
show details | |

|
#2
E Hazel St
Albion, IN 46701
|
1,266 sq. feet
|
1 baths 3 beds |
show details | |

|
#3
N 150 E
Albion, IN 46701
|
1,664 sq. feet
|
2 baths 3 beds |
show details | |

|
#4
W 100 N
Albion, IN 46701
|
1,728 sq. feet
|
1 baths 3 beds |
show details | |

|
#5
E South St
Albion, IN 46701
|
888 sq. feet
|
1 baths 2 beds |
show details | |

|
#6
N Liberty Dr
Albion, IN 46701
|
1,100 sq. feet
|
1 baths 2 beds |
show details | |

|
#7
W Main St
Albion, IN 46701
|
- sq. feet
|
- baths - beds |
show details | |

|
#8
W Hazel St Apt 211
Albion, IN 46701
|
- sq. feet
|
- baths - beds |
show details | |

|
#9
S 50 W
Albion, IN 46701
|
- sq. feet
|
- baths - beds |
show details | |

|
#10
Riverview Dr
Albion, IN 46701
|
- sq. feet
|
- baths - beds |
show details |
| Photo | Address | Area | Beds / Baths | Price | Details |
|---|---|---|---|---|---|

|
#11
W Herron Dr
Albion, IN 46701
|
- sq. feet
|
- baths - beds |
show details | |

|
#12
E Seneca St Lot 31
Albion, IN 46701
|
- sq. feet
|
- baths - beds |
show details | |

|
#13
S 7th St Lot 44
Albion, IN 46701
|
- sq. feet
|
- baths - beds |
show details | |

|
#14
Weeks St
Albion, IN 46701
|
- sq. feet
|
- baths - beds |
show details | |

|
#15
W 300 N
Albion, IN 46701
|
- sq. feet
|
- baths - beds |
show details | |

|
#16
N Randolph St
Garrett, IN 46738
|
1,388 sq. feet
|
1 baths 3 beds |
$68,900
|
show details |

|
#17
E 175 N
Albion, IN 46701
|
- sq. feet
|
- baths - beds |
show details | |

|
#18
W Highland Dr
Albion, IN 46701
|
- sq. feet
|
- baths - beds |
show details | |

|
#19
N Line St
Columbia City, IN 46725
|
1,738 sq. feet
|
2 baths 3 beds |
show details | |

|
#20
E Ellsworth St
Columbia City, IN 46725
|
- sq. feet
|
1 baths 4 beds |
show details |
| Photo | Address | Area | Beds / Baths | Price | Details |
|---|---|---|---|---|---|

|
#21
E Beech Ave
Columbia City, IN 46725
|
2,606 sq. feet
|
1 baths 3 beds |
show details | |

|
#22
W Hill Dr
Columbia City, IN 46725
|
- sq. feet
|
1 baths 3 beds |
show details | |

|
#23
N Columbia Pkwy
Columbia City, IN 46725
|
1,822 sq. feet
|
3 baths 4 beds |
show details | |

|
#24
N 350 W
Columbia City, IN 46725
|
2,076 sq. feet
|
1 baths 3 beds |
show details | |

|
#25
N Sullivan Rd
Leesburg, IN 46538
|
- sq. feet
|
3 baths 3 beds |
show details | |

|
#26
E 6th St
Ligonier, IN 46767
|
1,707 sq. feet
|
1 baths 3 beds |
show details | |

|
#27
N Mulberry St
Churubusco, IN 46723
|
1,184 sq. feet
|
1 baths 3 beds |
show details | |

|
#28
N State Road 9
Columbia City, IN 46725
|
1,444 sq. feet
|
1 baths 3 beds |
show details | |

|
#29
West St
Churubusco, IN 46723
|
1,040 sq. feet
|
1 baths 3 beds |
show details | |

|
#30
N Main St
Churubusco, IN 46723
|
1,951 sq. feet
|
1 baths 3 beds |
show details |
| Photo | Address | Area | Beds / Baths | Price | Details |
|---|---|---|---|---|---|

|
#31
Shorewood Ct
Columbia City, IN 46725
|
1,270 sq. feet
|
2 baths 3 beds |
show details | |

|
#32
W Market St
Columbia City, IN 46725
|
1,452 sq. feet
|
1 baths 4 beds |
show details | |

|
#33
County Road 20
Corunna, IN 46730
|
3,027 sq. feet
|
2 baths 4 beds |
show details | |

|
#34
S Main St
Topeka, IN 46571
|
2,076 sq. feet
|
2 baths 3 beds |
show details | |

|
#35
E Wrights Way
Columbia City, IN 46725
|
1,737 sq. feet
|
2 baths 3 beds |
show details | |

|
#36
E Cree Lake Dr N
Kendallville, IN 46755
|
1,290 sq. feet
|
1 baths 2 beds |
show details | |

|
#37
South Rd
Garrett, IN 46738
|
1,044 sq. feet
|
1 baths 3 beds |
show details | |

|
#38
W River Dr
Wawaka, IN 46794
|
2,128 sq. feet
|
1 baths 4 beds |
show details | |

|
#39
Granada Dr
Kendallville, IN 46755
|
1,084 sq. feet
|
1 baths 3 beds |
show details | |

|
#40
E Baseline Rd
Avilla, IN 46710
|
1,457 sq. feet
|
1 baths 3 beds |
show details |
| Photo | Address | Area | Beds / Baths | Price | Details |
|---|---|---|---|---|---|

|
#41
W Us Highway 6
Wawaka, IN 46794
|
1,680 sq. feet
|
2 baths 4 beds |
show details | |

|
#42
N Memorial Pkwy
Cromwell, IN 46732
|
1,002 sq. feet
|
2 baths 3 beds |
show details | |

|
#43
S 1025 W
Hudson, IN 46747
|
2,074 sq. feet
|
2 baths 5 beds |
show details | |

|
#44
W Tidewater Trl
Columbia City, IN 46725
|
1,121 sq. feet
|
2 baths 3 beds |
show details | |

|
#45
N Randolph St
Garrett, IN 46738
|
2,640 sq. feet
|
1 baths 4 beds |
show details | |

|
#46
S Franklin St
Garrett, IN 46738
|
1,086 sq. feet
|
1 baths 2 beds |
show details | |

|
#47
W Himes St
North Webster, IN 46555
|
1,296 sq. feet
|
1 baths 2 beds |
show details | |

|
#48
N Hickory St W
North Webster, IN 46555
|
1,595 sq. feet
|
1 baths 3 beds |
show details | |

|
#49
N 825 E
North Webster, IN 46555
|
1,075 sq. feet
|
1 baths 3 beds |
show details | |

|
Check over 1 million property listings on Foreclosure.com!
|
browse all offers | |||

Latest news about housing in Albion, IN collected exclusively by city-data.com from local newspapers, TV, and radio stations

 | Where to park my travel Trailer (3 replies) |
| Best place to live near Albion, IN for a single man (6 replies) |
| Fort Wayne airport transportation (3 replies) |
| Looking for the Perfect Small Town (78 replies) |
| good schoold district in Fort wayne (2 replies) |
| Fun things to do in Indiana? (25 replies) |

Median year apartment built: 1982
Household type by relationship:
Households: 2,855- Male householders: 464 (107 living alone), Female householders: 406 (111 living alone)
393 spouses (348 opposite-sex spouses), 123 unmarried partners, (123 opposite-sex unmarried partners), 940 children (690 natural, 43 adopted, 206 stepchildren), 68 grandchildren, 26 brothers or sisters, 23 parents, 0 foster children, 74 other relatives, 114 non-relatives
- In group quarters: 218
Size of family households: 193 2-persons, 132 3-persons, 121 4-persons, 53 5-persons, 23 6-persons, 68 7-or-more-persons.
Size of nonfamily households: 225 1-person, 54 2-persons, 12 3-persons, 3 4-persons.
534 married couples with children.
187 single-parent households (71 men, 116 women).
96.1% of residents of Albion speak English at home.
2.1% of residents speak Spanish at home (83% speak English very well, 17% speak English well).
0.6% of residents speak other Indo-European language at home (100% speak English very well).
0.2% of residents speak Asian or Pacific Island language at home (100% speak English very well).
Foreign born population: 54 (1.9%)
(59.3% of them are naturalized citizens)
| Here: | 6.9 |
| State: | 6.6 |
| Here: | 4.4 |
| State: | 4.3 |

- Bedrooms in owner-occupied houses and condos in Albion, Indiana
- 0no bedroom
- 41 bedroom
- 612 bedrooms
- 3083 bedrooms
- 1344 bedrooms
- 205+ bedrooms

- Bedrooms in renter-occupied apartments in Albion, Indiana
- 17no bedroom
- 741 bedroom
- 1492 bedrooms
- 1113 bedrooms
- 114 bedrooms
- 05+ bedrooms

- Cars and other vehicles available in Albion in owner-occupied houses/condos
- 18no vehicle
- 1211 vehicle
- 1782 vehicles
- 1013 vehicles
- 904 vehicles
- 175+ vehicles

- Cars and other vehicles available in Albion in renter-occupied apartments
- 44no vehicle
- 1431 vehicle
- 1132 vehicles
- 373 vehicles
- 264 vehicles
- 05+ vehicles

- Rooms in owner-occupied houses in Albion, Indiana
- 01 room
- 02 rooms
- 103 rooms
- 204 rooms
- 935 rooms
- 796 rooms
- 1497 rooms
- 1008 rooms
- 759+ rooms

- Rooms in renter-occupied apartments in Albion, Indiana
- 171 room
- 272 rooms
- 333 rooms
- 1034 rooms
- 715 rooms
- 446 rooms
- 397 rooms
- 188 rooms
- 109+ rooms


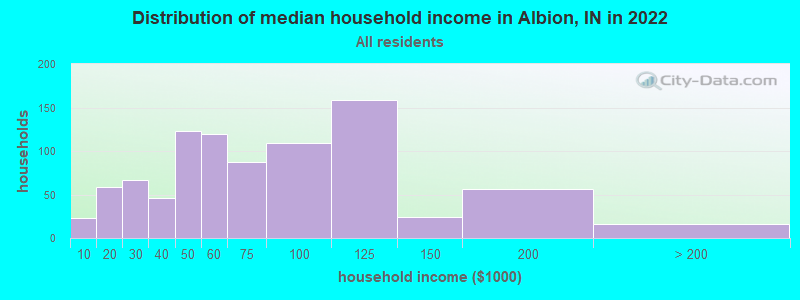
Albion, IN household income distribution

- 23Less than $10,000
- 59$10,000 to $19,999
- 67$20,000 to $29,999
- 46$30,000 to $39,999
- 123$40,000 to $49,999
- 119$50,000 to $59,999
- 87$60,000 to $74,999
- 109$75,000 to $99,999
- 159$100,000 to $124,999
- 24$125,000 to $149,999
- 56$150,000 to $199,999
- 16$200,000 or more
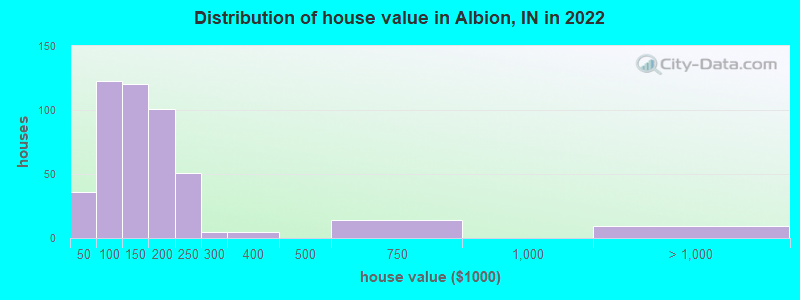
Home value of owner - occupied houses in 2022 in Albion, IN
-
- 6Less than $10,000
- 16$10,000 to $14,999
- 13$15,000 to $19,999
- 3$50,000 to $59,999
- 16$60,000 to $69,999
- 9$70,000 to $79,999
- 31$80,000 to $89,999
- 62$90,000 to $99,999
- 91$100,000 to $124,999
- 28$125,000 to $149,999
- 59$150,000 to $174,999
- 41$175,000 to $199,999
- 51$200,000 to $249,999
- 4$250,000 to $299,999
- 5$300,000 to $399,999
- 13$500,000 to $749,999
- 8$2,000,000 or more
Rent paid by renters in 2022 in Albion, IN
-
- 3$150 to $199
- 13$250 to $299
- 8$350 to $399
- 17$400 to $449
- 29$450 to $499
- 14$500 to $549
- 27$550 to $599
- 32$600 to $649
- 49$650 to $699
- 41$700 to $749
- 36$750 to $799
- 45$800 to $899
- 10$2,000 to $2,499
- 5No cash rent


Percentage of workers working in this county: 58.9%
Number of people working at home: 45 (3.6% of all workers)
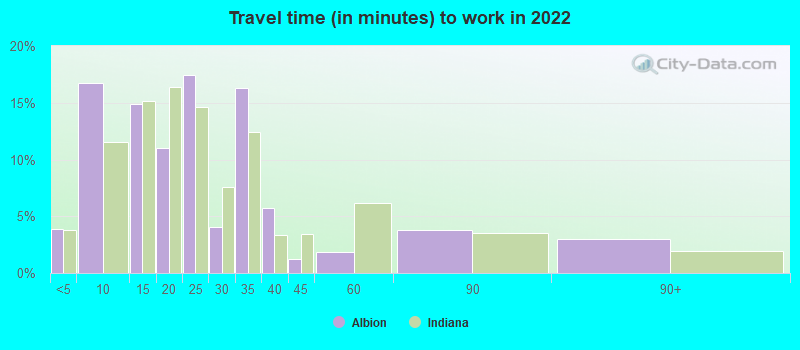
Travel time to work (commute)
- Less than 5 minutes: 151
- 5 to 9 minutes: 260
- 10 to 14 minutes: 34
- 15 to 19 minutes: 98
- 20 to 24 minutes: 105
- 25 to 29 minutes: 54
- 30 to 34 minutes: 152
- 35 to 39 minutes: 17
- 40 to 44 minutes: 74
- 45 to 59 minutes: 187
- 60 to 89 minutes: 22
- 90 or more minutes: 40
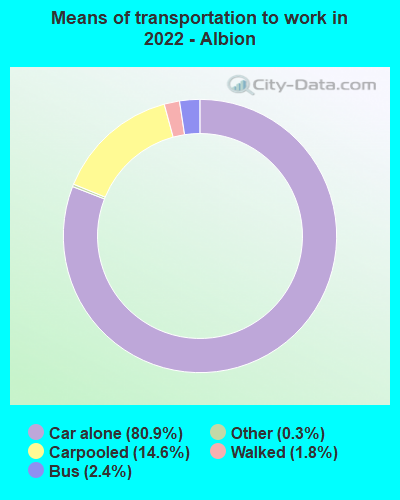
Means of transportation to work:
- Drove a car alone: 2,146 (76.9%)
- Carpooled: 425 (15.2%)
- Bus: 61 (2.2%)
- Taxi: 9 (0.3%)
- Walked: 48 (1.7%)
- Worked at home: 45 (1.6%)

- Unemployment by race in 2022
- Unemployment rate for White non-Hispanic residents
- 0.7%Males
- 1.4%Females

- Year of entry for the foreign-born population in Albion, Indiana
- 362010 or later
- 02000 to 2009
- 61990 to 1999
- 101980 to 1989
- 01970 to 1979
- 4Before 1970

First ancestries reported:
- European: 423 (30.0%)
- American: 418 (29.6%)
- German: 178 (12.6%)
- English: 97 (6.9%)
- Irish: 20 (1.4%)
- Dutch: 17 (1.2%)
- Scotch-Irish: 14 (1.0%)
- Polish: 10 (0.7%)
- Swiss: 10 (0.7%)
- British: 4 (0.3%)
- Eastern European: 4 (0.3%)
- Scottish: 3 (0.2%)
Most common places of birth for foreign-born residents (%):
| Albion: | 57.4% (31) |
| Indiana: | 27.0% (101,996) |
| Albion: | 20.4% (11) |
| Indiana: | 0.2% (705) |
| Albion: | 14.8% (8) |
| Indiana: | 2.1% (7,834) |
| Albion: | 9.3% (5) |
| Indiana: | 0.9% (3,307) |
Place of birth for U.S.-born residents:
- This state: 2,085
- Other state: 702
- Northeast: 64
- Midwest: 336
- South: 238
- West: 61
76.4% of Albion residents lived in the same house 1 years ago.
Out of people who lived in different houses, 37.5% lived in this county.
Out of people who lived in different counties, 90.2% lived in Indiana.
| Albion: | 76.4% |
| State average: | 87.1% |
Education attainment for males 25 years and older:
- No schooling: 6
- Nursery to 4th grade: 0
- 5th and 6th grade: 0
- 7th and 8th grade: 12
- 9th grade: 7
- 10th grade: 37
- 11th grade: 19
- 12th grade, no diploma: 12
- High school graduate (or equivalency): 431
- Less than 1 year of college: 42
- Some college more than 1 year, no degree: 149
- Associate degree: 70
- Bachelor's degree: 36
- Master's degree: 6
- Professional school degree: 4
- Doctorate degree: 0

Education attainment for females 25 years and older:
- No schooling: 5
- Nursery to 4th grade: 0
- 5th and 6th grade: 0
- 7th and 8th grade: 23
- 9th grade: 3
- 10th grade: 28
- 11th grade: 40
- 12th grade, no diploma: 0
- High school graduate (or equivalency): 392
- Less than 1 year of college: 55
- Some college more than 1 year, no degree: 123
- Associate degree: 81
- Bachelor's degree: 47
- Master's degree: 8
- Professional school degree: 0
- Doctorate degree: 0


Housing units in structures:
- One, detached: 620
- One, attached: 10
- Two: 31
- 3 or 4: 67
- 5 to 9: 37
- 10 to 19: 16
- 20 to 49: 21
- Mobile homes: 148
Housing units lacking complete kitchen facilities in 2022: 3.0%
House/condo owner moved in on average 10 years ago
Renter moved in on average 4 years ago

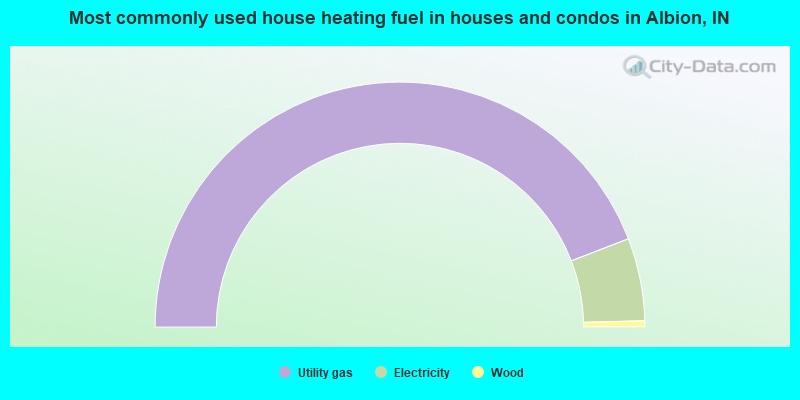
- 88.3%Utility gas
- 10.9%Electricity
- 0.8%Wood
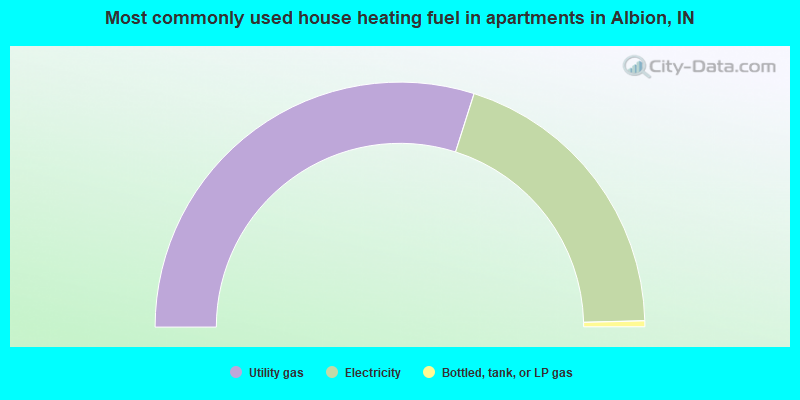
- 59.8%Utility gas
- 39.4%Electricity
- 0.8%Bottled, tank, or LP gas
Private vs. public school enrollment:
| Here: | 1.4% |
| Indiana: | 14.9% |
| Here: | 0.0% |
| Indiana: | 11.4% |
| Here: | 14.5% |
| Indiana: | 22.3% |


