Alexandria, IN (Indiana) Houses and Residents
| Alexandria: | $99,993 |
| Indiana: | $208,700 |
Total population: 5,067 (All urban)
Houses: 2,630 (2,046 occupied: 1,433 owner occupied, 661 renter occupied)
| % of renters here: | 32% |
| State: | 29% |
Housing density: 970 houses/condos per square mile
Median price asked for vacant for-sale houses and condos in 2022 in this county: $192,807.
Median contract rent in 2022: $592 (lower quartile is $462, upper quartile is $718)
Median rent asked for vacant for-rent units in 2022: $920
Median gross rent in Alexandria, IN in 2022: $718
Housing units in Alexandria with a mortgage: 972 (92 second mortgage, 0 home equity loan, 91 both second mortgage and home equity loan)
Houses without a mortgage: 0
Median household income for houses/condos with a mortgage: $84,525
Median household income for apartments without a mortgage: $71,807
Median monthly housing costs: $749
Compare current foreclosures near Alexandria, IN:
| Photo | Address | Area | Beds / Baths | Price | Details |
|---|---|---|---|---|---|

|
#1
Randolph Ave
Alexandria, IN 46001
|
1,024 sq. feet
|
1 baths 2 beds |
show details | |

|
#2
N Olivia Dr
Alexandria, IN 46001
|
2,543 sq. feet
|
2 baths 3 beds |
show details | |

|
#3
W Monroe St
Alexandria, IN 46001
|
876 sq. feet
|
1 baths 2 beds |
show details | |

|
#4
N Canal St
Alexandria, IN 46001
|
1,111 sq. feet
|
1 baths 3 beds |
show details | |

|
#5
S Harrison St
Alexandria, IN 46001
|
1,558 sq. feet
|
1 baths 3 beds |
show details | |

|
#6
N Melanie Dr
Alexandria, IN 46001
|
1,887 sq. feet
|
1 baths 3 beds |
show details | |

|
#7
N Ross St
Alexandria, IN 46001
|
1,391 sq. feet
|
1 baths 2 beds |
show details | |

|
#8
Norfolk Dr
Alexandria, IN 46001
|
1,140 sq. feet
|
1 baths 3 beds |
show details | |

|
#9
W State Road 28
Alexandria, IN 46001
|
3,357 sq. feet
|
2 baths 5 beds |
show details | |

|
#10
W 1300 N
Alexandria, IN 46001
|
1,880 sq. feet
|
1 baths - beds |
show details |
| Photo | Address | Area | Beds / Baths | Price | Details |
|---|---|---|---|---|---|

|
#11
S Clinton St
Alexandria, IN 46001
|
- sq. feet
|
- baths - beds |
show details | |

|
#12
E Monroe St
Alexandria, IN 46001
|
- sq. feet
|
- baths - beds |
show details | |

|
#13
E 900 N
Alexandria, IN 46001
|
- sq. feet
|
- baths - beds |
show details | |

|
#14
S Park Ave
Alexandria, IN 46001
|
- sq. feet
|
- baths - beds |
show details | |

|
#15
W Washington St
Alexandria, IN 46001
|
- sq. feet
|
- baths - beds |
show details | |

|
#16
W Adams St
Alexandria, IN 46001
|
- sq. feet
|
- baths - beds |
show details | |

|
#17
E Wabash Ave
Muncie, IN 47303
|
1,400 sq. feet
|
1 baths 3 beds |
$158,900
|
show details |

|
#18
West 500 North
Gaston, IN 47342
|
1,736 sq. feet
|
1 baths 3 beds |
$214,900
|
show details |

|
#19
W 10th St
Muncie, IN 47302
|
1,608 sq. feet
|
1 baths 2 beds |
$91,500
|
show details |

|
#20
E New York St
Summitville, IN 46070
|
- sq. feet
|
1 baths 2 beds |
$1
|
show details |
| Photo | Address | Area | Beds / Baths | Price | Details |
|---|---|---|---|---|---|

|
#21
E 31st St
Anderson, IN 46016
|
1,053 sq. feet
|
1 baths 2 beds |
$7,900
|
show details |

|
#22
E S G
Gas City, IN 46933
|
1,256 sq. feet
|
1 baths - beds |
$19,900
|
show details |

|
#23
Kerrwood Dr
Anderson, IN 46011
|
1,053 sq. feet
|
1 baths 3 beds |
show details | |

|
#24
Canterbury Ct
Anderson, IN 46012
|
1,868 sq. feet
|
2 baths 3 beds |
show details | |

|
#25
W Hellis Dr
Muncie, IN 47304
|
1,862 sq. feet
|
2 baths 4 beds |
show details | |

|
#26
N 10th St
Gas City, IN 46933
|
1,568 sq. feet
|
1 baths 3 beds |
show details | |

|
#27
E 5th St
Muncie, IN 47302
|
864 sq. feet
|
1 baths 2 beds |
show details | |

|
#28
N Scatterfield Rd
Anderson, IN 46012
|
1,460 sq. feet
|
2 baths 3 beds |
show details | |

|
#29
E Main St
Gas City, IN 46933
|
- sq. feet
|
2 baths 3 beds |
show details | |

|
#30
W North A St
Gas City, IN 46933
|
1,040 sq. feet
|
1 baths 2 beds |
show details |
| Photo | Address | Area | Beds / Baths | Price | Details |
|---|---|---|---|---|---|

|
#31
E 400 S
Greentown, IN 46936
|
1,341 sq. feet
|
2 baths 3 beds |
show details | |

|
#32
N Mechanicsburg Rd
Middletown, IN 47356
|
1,680 sq. feet
|
1 baths 3 beds |
show details | |

|
#33
W Kings Row St
Muncie, IN 47304
|
2,000 sq. feet
|
2 baths 3 beds |
show details | |

|
#34
Pearl St
Anderson, IN 46016
|
1,036 sq. feet
|
1 baths 2 beds |
show details | |

|
#35
E 1st St
Fowlerton, IN 46930
|
1,640 sq. feet
|
1 baths 2 beds |
show details | |

|
#36
Alexandria Pike
Anderson, IN 46012
|
961 sq. feet
|
1 baths 2 beds |
show details | |

|
#37
W 4th St
Daleville, IN 47334
|
1,048 sq. feet
|
1 baths 3 beds |
show details | |

|
#38
N 500 E
Anderson, IN 46012
|
1,314 sq. feet
|
1 baths 3 beds |
show details | |

|
#39
E South D St
Gas City, IN 46933
|
1,808 sq. feet
|
1 baths 3 beds |
show details | |

|
#40
W 11th St
Anderson, IN 46011
|
1,590 sq. feet
|
1 baths 3 beds |
show details |
| Photo | Address | Area | Beds / Baths | Price | Details |
|---|---|---|---|---|---|

|
#41
E 42nd St
Anderson, IN 46013
|
1,525 sq. feet
|
1 baths 2 beds |
show details | |

|
#42
E 41st St
Anderson, IN 46013
|
1,150 sq. feet
|
1 baths 3 beds |
show details | |

|
#43
E 200 S
Anderson, IN 46017
|
1,011 sq. feet
|
1 baths 2 beds |
show details | |

|
#44
Brown St
Anderson, IN 46013
|
947 sq. feet
|
1 baths 2 beds |
show details | |

|
#45
N Lakeside Dr
Muncie, IN 47304
|
1,642 sq. feet
|
2 baths 3 beds |
show details | |

|
#46
Piccadilli Rd
Anderson, IN 46013
|
1,504 sq. feet
|
1 baths 2 beds |
show details | |

|
#47
Alhambra Ct
Anderson, IN 46013
|
893 sq. feet
|
1 baths 2 beds |
show details | |

|
#48
Heritage Ln
Anderson, IN 46013
|
1,183 sq. feet
|
1 baths 2 beds |
show details | |

|
#49
W 39th St
Anderson, IN 46011
|
1,729 sq. feet
|
1 baths 5 beds |
show details | |

|
Check over 1 million property listings on Foreclosure.com!
|
browse all offers | |||

Latest news about housing in Alexandria, IN collected exclusively by city-data.com from local newspapers, TV, and radio stations

 | Carmel Short-Term Apartments (4 replies) |
| Reasonable apartments in Carmel/ Noblesfille/ Westfield area? (8 replies) |
| Best Small Towns (20 replies) |
| Non-parent couple from Washington DC area thinking of moving to Indy/Fishers area. Good fit? (26 replies) |
| Southeast fried chicken (5 replies) |
| Edward Rose Apartments - Opinions? (2 replies) |

Median year apartment built: 1959
Household type by relationship:
Households: 5,191- Male householders: 855 (259 living alone), Female householders: 1,196 (313 living alone)
986 spouses (980 opposite-sex spouses), 137 unmarried partners, (137 opposite-sex unmarried partners), 1,453 children (1,241 natural, 22 adopted, 189 stepchildren), 115 grandchildren, 58 brothers or sisters, 68 parents, 46 foster children, 107 other relatives, 85 non-relatives
- In group quarters: 78
Size of family households: 609 2-persons, 333 3-persons, 263 4-persons, 66 5-persons, 173 6-persons.
Size of nonfamily households: 575 1-person, 102 2-persons.
808 married couples with children.
230 single-parent households (77 men, 153 women).
96.4% of residents of Alexandria speak English at home.
0.5% of residents speak Spanish at home (100% speak English very well).
2.7% of residents speak other Indo-European language at home (100% speak English very well).
| Here: | 5.7 |
| State: | 6.6 |
| Here: | 3.7 |
| State: | 4.3 |

- Bedrooms in owner-occupied houses and condos in Alexandria, Indiana
- 0no bedroom
- 131 bedroom
- 4042 bedrooms
- 6633 bedrooms
- 3064 bedrooms
- 475+ bedrooms

- Bedrooms in renter-occupied apartments in Alexandria, Indiana
- 0no bedroom
- 1761 bedroom
- 4072 bedrooms
- 783 bedrooms
- 04 bedrooms
- 05+ bedrooms

- Cars and other vehicles available in Alexandria in owner-occupied houses/condos
- 200no vehicle
- 3031 vehicle
- 4492 vehicles
- 3353 vehicles
- 1274 vehicles
- 215+ vehicles

- Cars and other vehicles available in Alexandria in renter-occupied apartments
- 113no vehicle
- 4201 vehicle
- 1172 vehicles
- 103 vehicles
- 04 vehicles
- 05+ vehicles

- Rooms in owner-occupied houses in Alexandria, Indiana
- 01 room
- 02 rooms
- 03 rooms
- 3414 rooms
- 2385 rooms
- 3966 rooms
- 1567 rooms
- 1338 rooms
- 1709+ rooms

- Rooms in renter-occupied apartments in Alexandria, Indiana
- 01 room
- 02 rooms
- 2213 rooms
- 2804 rooms
- 515 rooms
- 466 rooms
- 197 rooms
- 308 rooms
- 139+ rooms


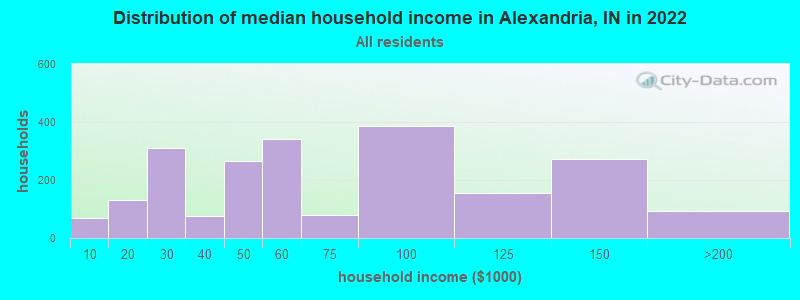
Alexandria, IN household income distribution

- 68Less than $10,000
- 131$10,000 to $19,999
- 312$20,000 to $29,999
- 77$30,000 to $39,999
- 267$40,000 to $49,999
- 341$50,000 to $59,999
- 78$60,000 to $74,999
- 387$75,000 to $99,999
- 154$100,000 to $124,999
- 274$125,000 to $149,999
- 94$150,000 to $199,999
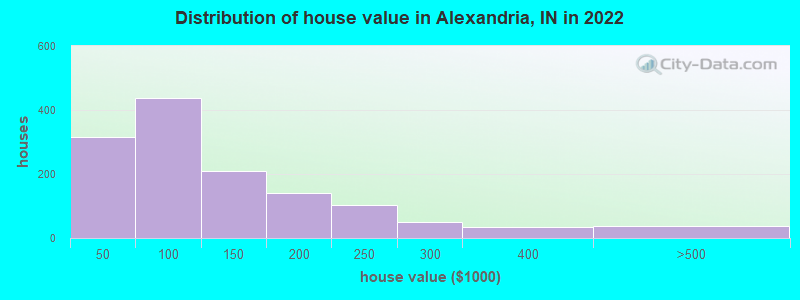
Home value of owner - occupied houses in 2022 in Alexandria, IN
-
- 99Less than $10,000
- 27$10,000 to $14,999
- 51$15,000 to $19,999
- 63$30,000 to $34,999
- 72$35,000 to $39,999
- 57$50,000 to $59,999
- 157$60,000 to $69,999
- 14$70,000 to $79,999
- 154$80,000 to $89,999
- 53$90,000 to $99,999
- 123$100,000 to $124,999
- 86$125,000 to $149,999
- 71$150,000 to $174,999
- 69$175,000 to $199,999
- 101$200,000 to $249,999
- 51$250,000 to $299,999
- 33$300,000 to $399,999
- 37$400,000 to $499,999
Rent paid by renters in 2022 in Alexandria, IN
-
- 26$200 to $249
- 17$250 to $299
- 23$400 to $449
- 136$450 to $499
- 140$500 to $549
- 23$550 to $599
- 55$600 to $649
- 79$650 to $699
- 55$700 to $749
- 40$750 to $799
- 67$800 to $899
- 5$900 to $999


Percentage of workers working in this county: 57.8%
Number of people working at home: 63 (2.6% of all workers)
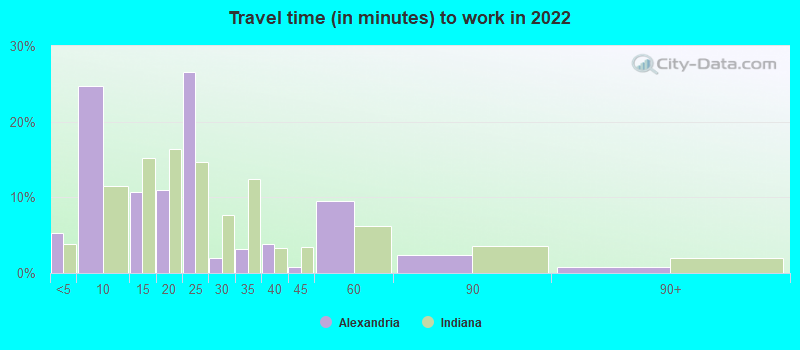
Travel time to work (commute)
- Less than 5 minutes: 70
- 5 to 9 minutes: 151
- 10 to 14 minutes: 117
- 15 to 19 minutes: 207
- 20 to 24 minutes: 435
- 25 to 29 minutes: 154
- 30 to 34 minutes: 407
- 35 to 39 minutes: 178
- 40 to 44 minutes: 12
- 45 to 59 minutes: 256
- 60 to 89 minutes: 161
- 90 or more minutes: 49

Means of transportation to work:
- Drove a car alone: 944 (76.9%)
- Carpooled: 147 (12.0%)
- Taxi: 42 (3.4%)
- Walked: 19 (1.5%)
- Worked at home: 63 (5.1%)

- Unemployment by race in 2022
- Unemployment rate for White non-Hispanic residents
- 13.3%Males
- 1.5%Females

- Year of entry for the foreign-born population in Alexandria, Indiana
- 01995 to March 2000
- 01990 to 1994
- 01985 to 1989
- 61980 to 1984
- 251975 to 1979
- 01970 to 1974
- 231965 to 1969
- 16Before 1965

First ancestries reported:
- American: 635 (24.1%)
- Irish: 387 (14.7%)
- English: 372 (14.1%)
- German: 363 (13.8%)
- Scottish: 42 (1.6%)
- European: 34 (1.3%)
- Polish: 17 (0.6%)
- Lithuanian: 13 (0.5%)
- Swedish: 2 (0.08%)
- African: 1 (0.04%)
Most common places of birth for foreign-born residents (%):
| Alexandria: | 35.7% (25) |
| Indiana: | 33.3% (62,113) |
| Alexandria: | 34.3% (24) |
| Indiana: | 4.2% (7,756) |
| Alexandria: | 21.4% (15) |
| Indiana: | 0.6% (1,105) |
| Alexandria: | 8.6% (6) |
| Indiana: | 0.3% (469) |
Place of birth for U.S.-born residents:
- This state: 4,255
- Other state: 920
- Northeast: 12
- Midwest: 341
- South: 420
- West: 123
83.9% of Alexandria residents lived in the same house 1 years ago.
Out of people who lived in different houses, 41.7% lived in this county.
Out of people who lived in different counties, 71.6% lived in Indiana.
| Alexandria: | 83.9% |
| State average: | 87.1% |
Education attainment for males 25 years and older:
- No schooling: 10
- Nursery to 4th grade: 3
- 5th and 6th grade: 0
- 7th and 8th grade: 2
- 9th grade: 51
- 10th grade: 0
- 11th grade: 53
- 12th grade, no diploma: 68
- High school graduate (or equivalency): 716
- Less than 1 year of college: 142
- Some college more than 1 year, no degree: 272
- Associate degree: 127
- Bachelor's degree: 153
- Master's degree: 88
- Professional school degree: 0
- Doctorate degree: 0

Education attainment for females 25 years and older:
- No schooling: 22
- Nursery to 4th grade: 0
- 5th and 6th grade: 0
- 7th and 8th grade: 0
- 9th grade: 36
- 10th grade: 68
- 11th grade: 0
- 12th grade, no diploma: 13
- High school graduate (or equivalency): 583
- Less than 1 year of college: 171
- Some college more than 1 year, no degree: 434
- Associate degree: 341
- Bachelor's degree: 162
- Master's degree: 46
- Professional school degree: 10
- Doctorate degree: 4


Housing units in structures:
- One, detached: 1,671
- One, attached: 23
- Two: 217
- 3 or 4: 310
- 5 to 9: 98
- 20 to 49: 38
- 50 or more: 12
- Mobile homes: 258
Housing units lacking complete kitchen facilities in 2022: 10.4%
House/condo owner moved in on average 6 years ago
Renter moved in on average 3 years ago

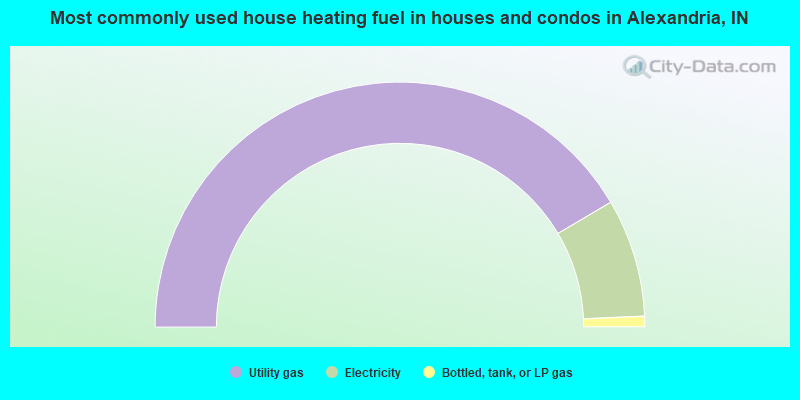
- 83.0%Utility gas
- 15.6%Electricity
- 1.4%Bottled, tank, or LP gas
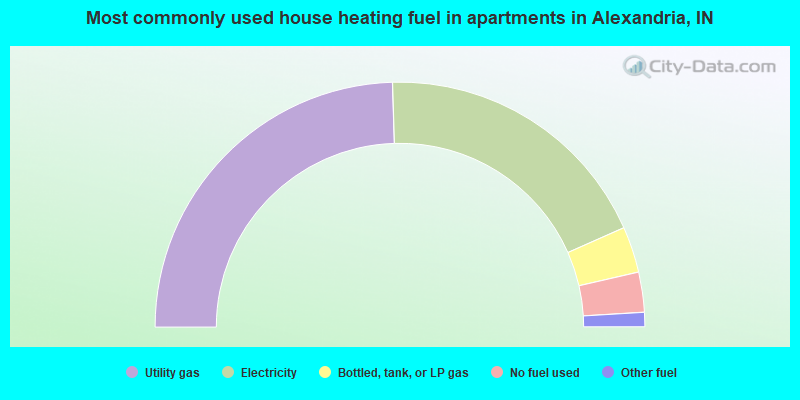
- 49.1%Utility gas
- 37.7%Electricity
- 6.1%Bottled, tank, or LP gas
- 5.3%No fuel used
- 1.9%Other fuel
Private vs. public school enrollment:
| Here: | 12.4% |
| Indiana: | 14.9% |
| Here: | 0.0% |
| Indiana: | 11.4% |
| Here: | 18.5% |
| Indiana: | 22.3% |


