Alford, MA (Massachusetts) Houses and Residents
| Alford: | $785,679 |
| Massachusetts: | $534,700 |
Total population: 494 (Urban population: 0, Rural population: 393 (23 farm, 370 nonfarm))
Houses: 280 (172 occupied: 156 owner occupied, 16 renter occupied)
| % of renters here: | 9% |
| State: | 38% |
Housing density: 24 houses/condos per square mile
Median price asked for vacant for-sale houses and condos in 2022 in this county: $708,441.
Median contract rent in 2022: $1,470 (lower quartile is $1,117, upper quartile is over $2,000)
Median gross rent in Alford, MA in 2022: $1,687
Housing units in Alford with a mortgage: 59 (4 second mortgage, 13 home equity loan, 0 both second mortgage and home equity loan)
Houses without a mortgage: 40


Latest news about housing in Alford, MA collected exclusively by city-data.com from local newspapers, TV, and radio stations

 | How Much Massachusetts Households Make Per Year: Census Data (37 replies) |
| Is it possible to escape hunters, ATVs and noise in a rural area? (278 replies) |
| Mattapan (25 replies) |
| Fisher cat in MA? (65 replies) |
| Art/Nature Person - Ideal Parts of Mass? (13 replies) |

Household type by relationship:
Households: 125,060- In family households: 97,905 (22,577 male householders, 11,041 female householders)
24,607 spouses, 32,029 children (29,913 natural, 899 adopted, 1,217 stepchildren), 1,640 grandchildren, 800 brothers or sisters, 888 parents, foster children, 744 other relatives, 3,122 non-relatives
- In nonfamily households: 27,155 (10,008 male householders (7,904 living alone)), 12,465 female householders (10,630 living alone)), 4,682 nonrelatives
- In group quarters: 6,159 (2,280 institutionalized population)
19,886 married couples with children.
7,840 single-parent households (1,582 men, 6,258 women).
93.5% of residents of Alford speak English at home.
3.4% of residents speak other Indo-European language at home (100% speak English very well).
3.1% of residents speak other language at home (67% speak English very well, 33% speak English well).
Foreign born population: 30 (8.1%)
(86.7% of them are naturalized citizens)
| Here: | 6.5 |
| State: | 6.5 |
| Here: | 4.2 |
| State: | 4.0 |

- Bedrooms in owner-occupied houses and condos in Alford, Massachusetts
- 0no bedroom
- 61 bedroom
- 232 bedrooms
- 773 bedrooms
- 384 bedrooms
- 125+ bedrooms

- Bedrooms in renter-occupied apartments in Alford, Massachusetts
- 0no bedroom
- 51 bedroom
- 32 bedrooms
- 63 bedrooms
- 24 bedrooms
- 05+ bedrooms

- Cars and other vehicles available in Alford in owner-occupied houses/condos
- 6no vehicle
- 491 vehicle
- 822 vehicles
- 113 vehicles
- 64 vehicles
- 25+ vehicles

- Cars and other vehicles available in Alford in renter-occupied apartments
- 0no vehicle
- 121 vehicle
- 42 vehicles
- 03 vehicles
- 04 vehicles
- 05+ vehicles

- Rooms in owner-occupied houses in Alford, Massachusetts
- 01 room
- 02 rooms
- 23 rooms
- 74 rooms
- 305 rooms
- 436 rooms
- 177 rooms
- 258 rooms
- 329+ rooms

- Rooms in renter-occupied apartments in Alford, Massachusetts
- 01 room
- 22 rooms
- 33 rooms
- 34 rooms
- 25 rooms
- 36 rooms
- 37 rooms
- 08 rooms
- 09+ rooms


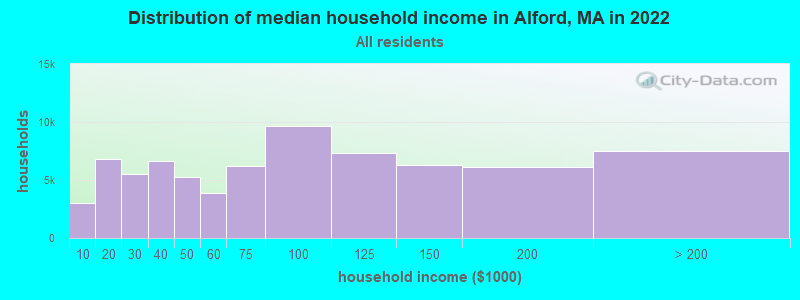
Alford, MA household income distribution

- 3,059Less than $10,000
- 6,815$10,000 to $19,999
- 5,535$20,000 to $29,999
- 6,597$30,000 to $39,999
- 5,293$40,000 to $49,999
- 3,883$50,000 to $59,999
- 6,167$60,000 to $74,999
- 9,689$75,000 to $99,999
- 7,292$100,000 to $124,999
- 6,282$125,000 to $149,999
- 6,092$150,000 to $199,999
- 7,489$200,000 or more
Percentage of workers working in this county: 82.2%
Number of people working at home: 41 (18.3% of all workers)
Travel time to work (commute)
- Less than 5 minutes: 3
- 5 to 9 minutes: 26
- 10 to 14 minutes: 36
- 15 to 19 minutes: 30
- 20 to 24 minutes: 26
- 25 to 29 minutes: 5
- 30 to 34 minutes: 9
- 35 to 39 minutes: 10
- 40 to 44 minutes: 1
- 45 to 59 minutes: 6
- 60 to 89 minutes: 17
- 90 or more minutes: 0
Means of transportation to work:
- Drove a car alone: 141 (70.9%)
- Carpooled: 15 (7.5%)
- Bus or trolley bus: 3 (1.5%)
- Subway or elevated: 2 (1.0%)
- Railroad: 5 (2.5%)
- Walked: 3 (1.5%)
- Worked at home: 30 (15.1%)


- Year of entry for the foreign-born population in Alford, Massachusetts
- 01995 to March 2000
- 01990 to 1994
- 01985 to 1989
- 01980 to 1984
- 21975 to 1979
- 01970 to 1974
- 21965 to 1969
- 14Before 1965
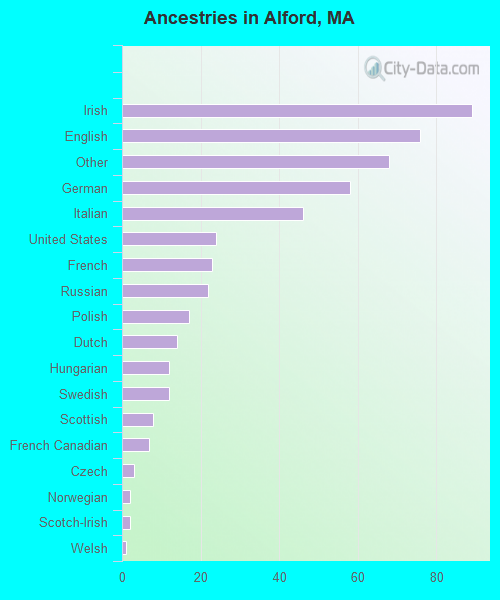
First ancestries reported:
- Irish: 89 (18.4%)
- English: 76 (15.7%)
- Other: 68 (14.0%)
- German: 58 (12.0%)
- Italian: 46 (9.5%)
- United States: 24 (5.0%)
- French: 23 (4.8%)
- Russian: 22 (4.5%)
- Polish: 17 (3.5%)
- Dutch: 14 (2.9%)
- Hungarian: 12 (2.5%)
- Swedish: 12 (2.5%)
- Scottish: 8 (1.7%)
- French Canadian: 7 (1.4%)
- Czech: 3 (0.6%)
- Norwegian: 2 (0.4%)
- Scotch-Irish: 2 (0.4%)
- Welsh: 1 (0.2%)
Most common places of birth for foreign-born residents (%):
| Alford: | 38.9% (7) |
| Massachusetts: | 1.9% (14,883) |
| Alford: | 22.2% (4) |
| Massachusetts: | 2.3% (17,987) |
| Alford: | 22.2% (4) |
| Massachusetts: | 0.2% (1,710) |
| Alford: | 11.1% (2) |
| Massachusetts: | 1.8% (13,543) |
Place of birth for U.S.-born residents:
- This state: 153
- Other state: 220
- Northeast: 165
- Midwest: 17
- South: 16
- West: 22
57% of Alford residents lived in the same house 5 years ago.
Out of people who lived in different houses, 62% lived in this county.
Out of people who lived in different counties, 11% lived in Massachusetts.
Education attainment for males 25 years and older:
- No schooling: 0
- Nursery to 4th grade: 0
- 5th and 6th grade: 0
- 7th and 8th grade: 2
- 9th grade: 0
- 10th grade: 0
- 11th grade: 5
- 12th grade, no diploma: 0
- High school graduate (or equivalency): 28
- Less than 1 year of college: 2
- Some college more than 1 year, no degree: 23
- Associate degree: 8
- Bachelor's degree: 35
- Master's degree: 24
- Professional school degree: 13
- Doctorate degree: 8

Education attainment for females 25 years and older:
- No schooling: 0
- Nursery to 4th grade: 0
- 5th and 6th grade: 0
- 7th and 8th grade: 0
- 9th grade: 0
- 10th grade: 0
- 11th grade: 1
- 12th grade, no diploma: 2
- High school graduate (or equivalency): 30
- Less than 1 year of college: 8
- Some college more than 1 year, no degree: 22
- Associate degree: 16
- Bachelor's degree: 34
- Master's degree: 28
- Professional school degree: 8
- Doctorate degree: 6


Housing units in structures:
- One, detached: 273
- One, attached: 6
- Mobile homes: 1

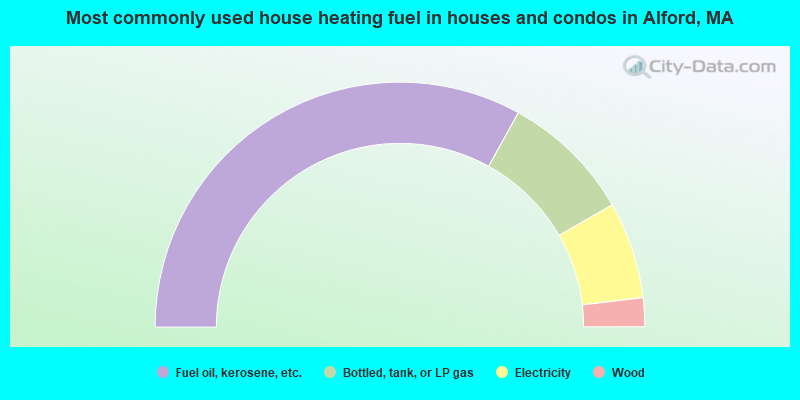
- 66.0%Fuel oil, kerosene, etc.
- 17.3%Bottled, tank, or LP gas
- 12.8%Electricity
- 3.8%Wood
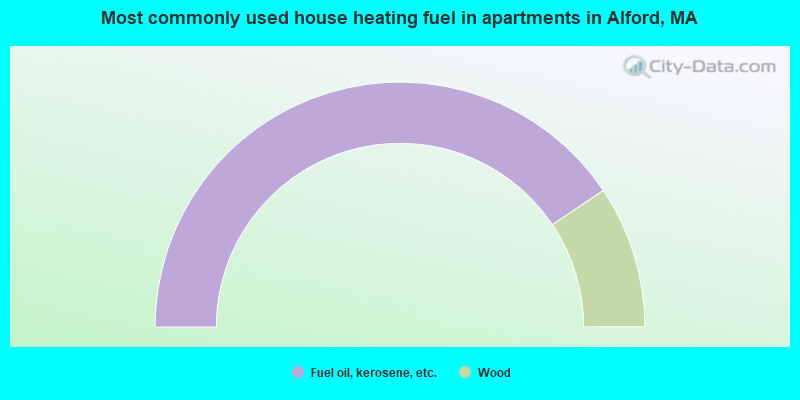
- 81.2%Fuel oil, kerosene, etc.
- 18.8%Wood
Private vs. public school enrollment:
| Here: | 13.0% |
| Massachusetts: | 10.8% |
| Here: | 15.4% |
| Massachusetts: | 12.2% |
| Here: | 0.0% |
| Massachusetts: | 48.2% |


