Alfred-South La Paloma, TX (Texas) Houses and Residents
| Alfred-South La Paloma: | $78,709 |
| Texas: | $275,400 |
Total population: 470 (Urban population: 0, Rural population: 278 (all nonfarm))
Houses: 129 (110 occupied: 94 owner occupied, 16 renter occupied)
| % of renters here: | 15% |
| State: | 38% |
Housing density: 29 houses/condos per square mile
Median price asked for vacant for-sale houses and condos in 2022 in this county: $116,179.
Median contract rent in 2022: $831 (lower quartile is $938, upper quartile is $916)
Median gross rent in Alfred-South La Paloma, TX in 2022: $1,094
Housing units in Alfred-South La Paloma with a mortgage: 8 (0 second mortgage, 0 home equity loan, 0 both second mortgage and home equity loan)
Houses without a mortgage: 32
Compare current foreclosures near Alfred-South La Paloma, TX:


Household type by relationship:
Households: 40,481- In family households: 36,380 (7,051 male householders, 3,431 female householders)
7,145 spouses, 13,779 children (12,612 natural, 263 adopted, 904 stepchildren), 2,069 grandchildren, 375 brothers or sisters, 317 parents, foster children, 669 other relatives, 1,124 non-relatives
- In nonfamily households: 4,101 (1,748 male householders (1,437 living alone)), 1,731 female householders (1,512 living alone)), 622 nonrelatives
- In group quarters: 357 (345 institutionalized population)
7,683 married couples with children.
2,775 single-parent households (594 men, 2,181 women).
54.3% of residents of Alfred-South La Paloma speak English at home.
45.7% of residents speak Spanish at home (53% speak English very well, 36% speak English well, 11% speak English not well).
Foreign born population: 22 (5.8%)
(118.2% of them are naturalized citizens)
| Here: | 4.8 |
| State: | 6.3 |
| Here: | 3.6 |
| State: | 4.0 |

- Bedrooms in owner-occupied houses and condos in Alfred-South La Paloma, Texas
- 0no bedroom
- 121 bedroom
- 312 bedrooms
- 313 bedrooms
- 204 bedrooms
- 05+ bedrooms

- Bedrooms in renter-occupied apartments in Alfred-South La Paloma, Texas
- 0no bedroom
- 91 bedroom
- 02 bedrooms
- 73 bedrooms
- 04 bedrooms
- 05+ bedrooms

- Cars and other vehicles available in Alfred-South La Paloma in owner-occupied houses/condos
- 8no vehicle
- 321 vehicle
- 442 vehicles
- 103 vehicles
- 04 vehicles
- 05+ vehicles

- Cars and other vehicles available in Alfred-South La Paloma in renter-occupied apartments
- 0no vehicle
- 161 vehicle
- 02 vehicles
- 03 vehicles
- 04 vehicles
- 05+ vehicles

- Rooms in owner-occupied houses in Alfred-South La Paloma, Texas
- 01 room
- 82 rooms
- 253 rooms
- 124 rooms
- 105 rooms
- 196 rooms
- 107 rooms
- 08 rooms
- 109+ rooms

- Rooms in renter-occupied apartments in Alfred-South La Paloma, Texas
- 01 room
- 02 rooms
- 93 rooms
- 04 rooms
- 75 rooms
- 06 rooms
- 07 rooms
- 08 rooms
- 09+ rooms


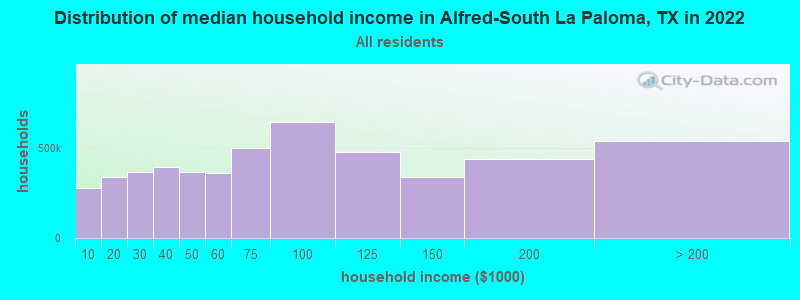
Alfred-South La Paloma, TX household income distribution

- 81,397Less than $10,000
- 110,659$10,000 to $19,999
- 120,385$20,000 to $29,999
- 126,797$30,000 to $39,999
- 119,627$40,000 to $49,999
- 114,810$50,000 to $59,999
- 158,932$60,000 to $74,999
- 217,614$75,000 to $99,999
- 164,964$100,000 to $124,999
- 121,619$125,000 to $149,999
- 141,429$150,000 to $199,999
- 158,972$200,000 or more
Percentage of workers working in this county: 45.3%
Number of people working at home: 13 (11.1% of all workers)
Travel time to work (commute)
- Less than 5 minutes: 0
- 5 to 9 minutes: 0
- 10 to 14 minutes: 9
- 15 to 19 minutes: 11
- 20 to 24 minutes: 18
- 25 to 29 minutes: 0
- 30 to 34 minutes: 6
- 35 to 39 minutes: 0
- 40 to 44 minutes: 4
- 45 to 59 minutes: 19
- 60 to 89 minutes: 0
- 90 or more minutes: 19
Means of transportation to work:
- Drove a car alone: 62 (72.1%)
- Carpooled: 16 (18.6%)
- Other means: 8 (9.3%)


- Year of entry for the foreign-born population in Alfred-South La Paloma, Texas
- 01995 to March 2000
- 01990 to 1994
- 01985 to 1989
- 01980 to 1984
- 01975 to 1979
- 01970 to 1974
- 01965 to 1969
- 10Before 1965

First ancestries reported:
- Other: 184 (67.6%)
- German: 21 (7.7%)
- United States: 17 (6.2%)
- French: 13 (4.8%)
- Czech: 11 (4.0%)
- Dutch: 9 (3.3%)
- Irish: 9 (3.3%)
- English: 8 (2.9%)
Most common places of birth for foreign-born residents (%):
| Alfred-South La Paloma: | 100.0% (10) |
| Texas: | 64.8% (1,879,369) |
Place of birth for U.S.-born residents:
- This state: 250
- Other state: 7
- Northeast: 0
- Midwest: 7
- South: 0
- West: 0
39% of Alfred-South La Paloma residents lived in the same house 5 years ago.
Out of people who lived in different houses, 57% lived in this county.
Out of people who lived in different counties, 100% lived in Texas.
Education attainment for males 25 years and older:
- No schooling: 24
- Nursery to 4th grade: 0
- 5th and 6th grade: 3
- 7th and 8th grade: 3
- 9th grade: 0
- 10th grade: 0
- 11th grade: 6
- 12th grade, no diploma: 13
- High school graduate (or equivalency): 42
- Less than 1 year of college: 0
- Some college more than 1 year, no degree: 0
- Associate degree: 0
- Bachelor's degree: 0
- Master's degree: 0
- Professional school degree: 0
- Doctorate degree: 0

Education attainment for females 25 years and older:
- No schooling: 6
- Nursery to 4th grade: 3
- 5th and 6th grade: 0
- 7th and 8th grade: 0
- 9th grade: 0
- 10th grade: 0
- 11th grade: 8
- 12th grade, no diploma: 9
- High school graduate (or equivalency): 38
- Less than 1 year of college: 5
- Some college more than 1 year, no degree: 0
- Associate degree: 3
- Bachelor's degree: 0
- Master's degree: 0
- Professional school degree: 0
- Doctorate degree: 0


Housing units in structures:
- One, detached: 59
- Mobile homes: 70
Median worth of mobile homes: $67,607
Housing units lacking complete kitchen facilities: 14.7%

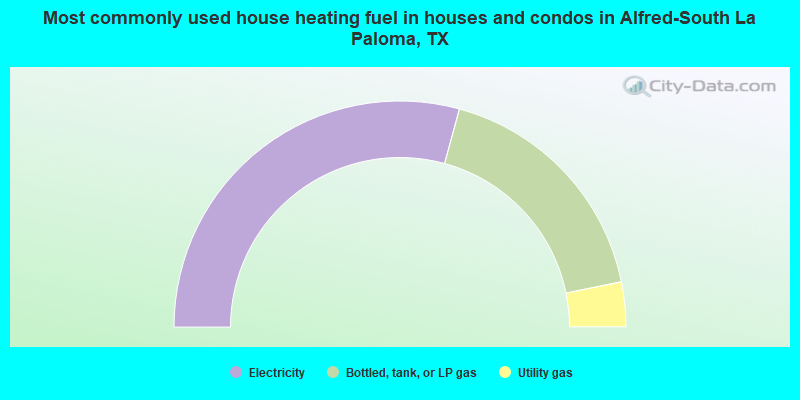
- 58.5%Electricity
- 35.1%Bottled, tank, or LP gas
- 6.4%Utility gas
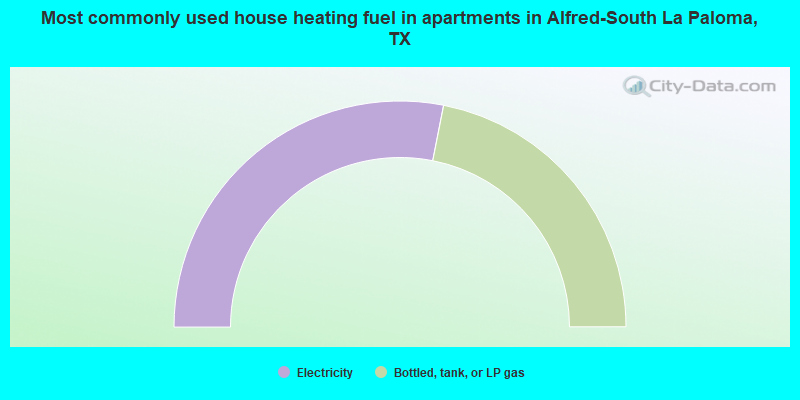
- 56.2%Electricity
- 43.8%Bottled, tank, or LP gas
Private vs. public school enrollment:
| Here: | 0.0% |
| Texas: | 6.8% |
| Here: | 0.0% |
| Texas: | 6.2% |


