Allen, TX (Texas) Houses and Residents
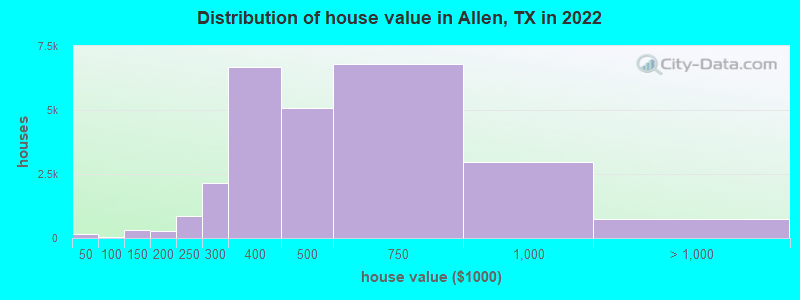
Estimated median house or condo value in 2022: $470,700 (it was $142,200 in 2000 )
Allen:
$470,700Texas:
$275,400
Lower value quartile - upper value quartile: $355,000 - $669,700Mean price in 2022: Detached houses: $493,748 Here:
$493,748State:
$369,058
Townhouses or other attached units: $356,232 Here:
$356,232State:
$327,631
In 3-to-4-unit structures: $393,293 Here:
$393,293State:
$209,652
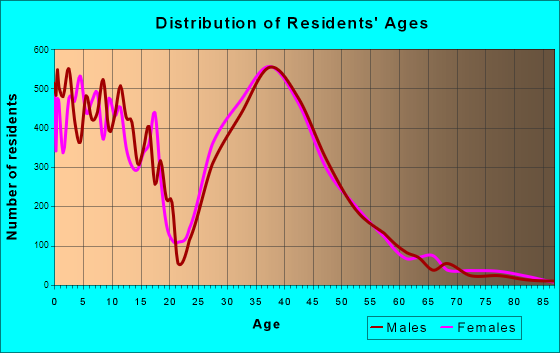
Total population: 94,179 (Urban population: 42,500, Rural population: 957 (22 farm, 935 nonfarm ))
Houses: 40,891 (39,697 occupied: 28,055 owner occupied, 11,642 renter occupied )
% of renters here:
29%State:
38%
Housing density: 1,553 houses/condos per square mile
Median price asked for vacant for-sale houses and condos in 2022: $466,398.
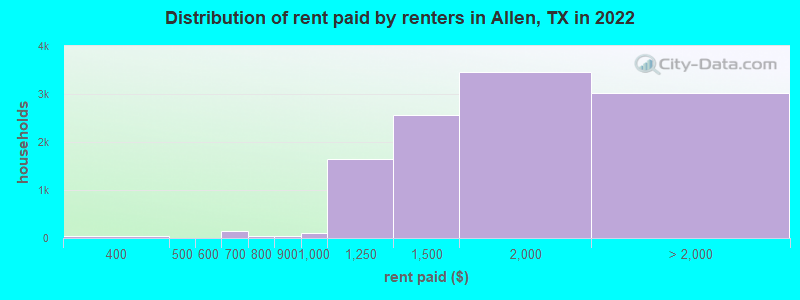
Median contract rent in 2022: $1,630 (lower quartile is $1,338, upper quartile is $1,982)
Median rent asked for vacant for-rent units in 2022: $4,194
Median gross rent in Allen, TX in 2022: $1,758
Housing units in Allen with a mortgage: 19,020 (1,249 second mortgage, 58 home equity loan, 763 both second mortgage and home equity loan )Houses without a mortgage: 284
Median household income for houses/condos with a mortgage: $171,673
Median household income for apartments without a mortgage: $109,971
Median monthly housing costs: $1,958
Data:
Median house or condo value ($)
Median house or condo value ($ change since 2000)
Median house or condo value ($) - White
Median house or condo value ($) - Black or African American
Median house or condo value ($) - Asian
Median house or condo value ($) - Hispanic or Latino
Median house or condo value ($) - American Indian and Alaska Native
Median house or condo value ($) - Multirace
Median house or condo value ($) - Other Race
Median price asked for mobile homes ($)
Household density (households per square mile)
Mean house or condo value by units in structure - 1, detached ($)
Mean house or condo value by units in structure - 1, attached ($)
Mean house or condo value by units in structure - 2 ($)
Mean house or condo value by units in structure by units in structure - 3 or 4 ($)
Mean house or condo value by units in structure - 5 or more ($)
Mean house or condo value by units in structure - Boat, RV, van, etc. ($)
Mean house or condo value by units in structure - Mobile home ($)
Median contract rent ($)
Median contract rent - Lower quartile ($)
Median contract rent - Upper quartile ($)
Median gross rent ($)
Urban houses (%)
Rural houses (%)
Houses occupied (%)
Houses occupied (% change since 2000)
Houses owner occupied (%)
Houses owner occupied (% change since 2000)
Houses renter occupied (%)
Houses renter occupied (% change since 2000)
Vacant housing units - For rent (%)
Vacant housing units - For rent (% change since 2000)
Vacant housing units - For sale only (%)
Vacant housing units - For sale only (% change since 2000)
Vacant housing units - Rented or sold, not occupied (%)
Vacant housing units - Rented or sold, not occupied (% change since 2000)
Vacant housing units - For seasonal, recreational, or occasional use (%)
Vacant housing units - For seasonal, recreational, or occasional use (% change since 2000)
Vacant housing units - For migrant workers (%)
Vacant housing units - For migrant workers (% change since 2000)
Vacant housing units - Other vacant (%)
Vacant housing units - Other vacant (% change since 2000)
Median monthly housing costs ($)
Median household income for houses/condos with a mortgage ($)
Median household income for houses/condos without a mortgage ($)
Median household income ($)
Median household income ($) - White
Median household income ($) - Black or African American
Median household income ($) - Asian
Median household income ($) - Hispanic or Latino
Median household income ($) - American Indian and Alaska Native
Median household income ($) - Multirace
Median household income ($) - Other Race
Mortgage status - with mortgage (%)
Mortgage status - with second mortgage (%)
Mortgage status - with home equity loan (%)
Mortgage status - with both second mortgage and home equity loan (%)
Mortgage status - without a mortgage (%)
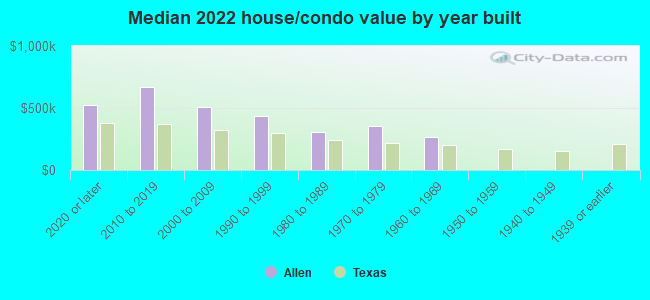
Median year house/condo built
Median year apartment built
Household type by relationship - Male householder living alone (%)
Household type by relationship - Male householder not living alone (%)
Household type by relationship - Female householder living alone (%)
Household type by relationship - Female householder not living alone (%)
Household type by relationship - Opposite-Sex spouse (%)
Household type by relationship - Same-Sex spouse (%)
Household type by relationship - Opposite-Sex unmarried partner (%)
Household type by relationship - Same-Sex unmarried partner (%)
Household type by relationship - In group quarters (%)
Size of family households - 2-person household (%)
Size of family households - 3-person household (%)
Size of family households - 4-person household (%)
Size of family households - 5-person household (%)
Size of family households - 6-person household (%)
Size of family households - 7-or-more-person household (%)
Size of nonfamily households - 1-person household (%)
Size of nonfamily households - 2-person household (%)
Size of nonfamily households - 3-person household (%)
Size of nonfamily households - 4-person household (%)
Size of nonfamily households - 5-person household (%)
Size of nonfamily households - 6-person household (%)
Size of nonfamily households - 7-or-moreperson household (%)
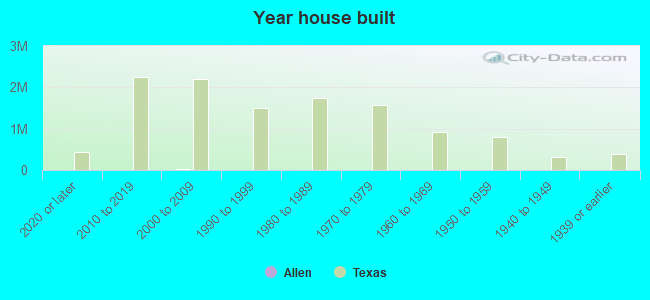
Year house built - Built 2010 or later (%)
Year house built - Built 2000 to 2009 (%)
Year house built - Built 1990 to 1999 (%)
Year house built - Built 1980 to 1989 (%)
Year house built - Built 1970 to 1979 (%)
Year house built - Built 1960 to 1969 (%)
Year house built - Built 1950 to 1959 (%)
Year house built - Built 1940 to 1949 (%)
Year house built - Built 1939 or earlier (%)
Median number of rooms in houses and condos
Median number of rooms in apartments
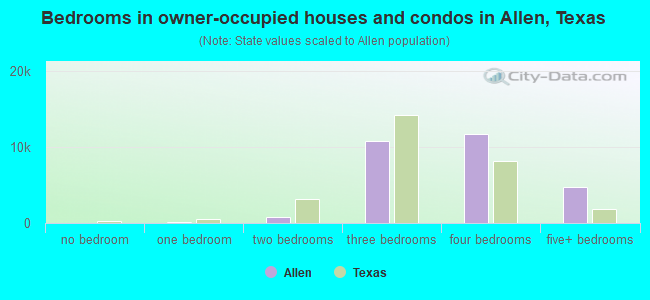
Median number of bedrooms in owner occupied houses
Mean number of bedrooms in owner occupied houses
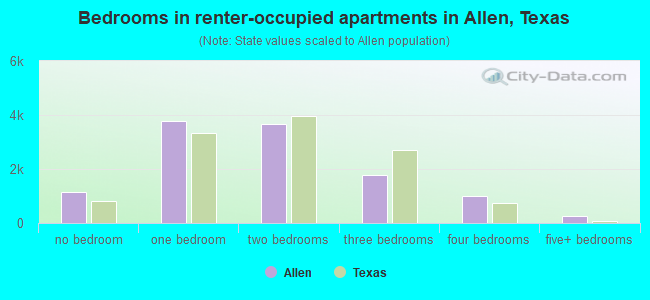
Median number of bedrooms in renter occupied houses
Mean number of bedrooms in renter occupied houses
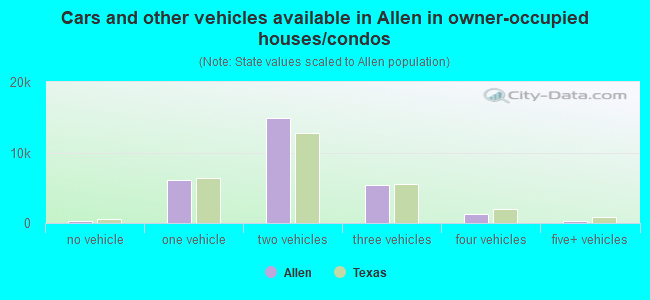
Median number of vehichles in owner occupied houses
Mean number of vehichles in owner occupied houses
Median number of vehichles in renter occupied houses
Mean number of vehichles in renter occupied houses
Rooms in owner-occupied houses - 1 room (%)
Rooms in owner-occupied houses - 2 rooms (%)
Rooms in owner-occupied houses - 3 rooms (%)
Rooms in owner-occupied houses - 4 rooms (%)
Rooms in owner-occupied houses - 5 rooms (%)
Rooms in owner-occupied houses - 6 rooms (%)
Rooms in owner-occupied houses - 7 rooms (%)
Rooms in owner-occupied houses - 8 rooms (%)
Rooms in owner-occupied houses - 9+ rooms (%)
Rooms in renter-occupied houses - 1 room (%)
Rooms in renter-occupied houses - 2 rooms (%)
Rooms in renter-occupied houses - 3 rooms (%)
Rooms in renter-occupied houses - 4 rooms (%)
Rooms in renter-occupied houses - 5 rooms (%)
Rooms in renter-occupied houses - 6 rooms (%)
Rooms in renter-occupied houses - 7 rooms (%)
Rooms in renter-occupied houses - 8 rooms (%)
Rooms in renter-occupied houses - 9+ rooms (%)
Bedrooms in owner-occupied houses - no bedrooms (%)
Bedrooms in owner-occupied houses - 1 bedroom (%)
Bedrooms in owner-occupied houses - 2 bedrooms (%)
Bedrooms in owner-occupied houses - 3 bedrooms (%)
Bedrooms in owner-occupied houses - 4 bedrooms (%)
Bedrooms in owner-occupied houses - 5+ bedrooms (%)
Bedrooms in renter-occupied houses - no bedrooms (%)
Bedrooms in renter-occupied houses - 1 bedroom (%)
Bedrooms in renter-occupied houses - 2 bedrooms (%)
Bedrooms in renter-occupied houses - 3 bedrooms (%)
Bedrooms in renter-occupied houses - 4 bedrooms (%)
Bedrooms in renter-occupied houses - 5+ bedrooms (%)
Vehicles available in owner-occupied houses - no vehicle available (%)
Vehicles available in owner-occupied houses - 1 vehicle available(%)
Vehicles available in owner-occupied houses - 2 Vehicles available (%)
Vehicles available in owner-occupied houses - 3 Vehicles available (%)
Vehicles available in owner-occupied houses - 4 Vehicles available (%)
Vehicles available in owner-occupied houses - 5+ Vehicles available (%)
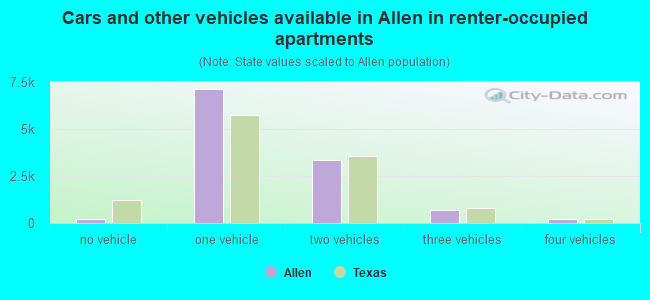
Vehicles available in renter-occupied houses - no vehicle available (%)
Vehicles available in renter-occupied houses - 1 vehicle available (%)
Vehicles available in renter-occupied houses - 2 Vehicles available (%)
Vehicles available in renter-occupied houses - 3 Vehicles available (%)
Vehicles available in renter-occupied houses - 4 Vehicles available (%)
Vehicles available in renter-occupied houses - 5+ Vehicles available (%)
Housing units in structures - 1, detached (%)
Housing units in structures - 1, attached (%)
Housing units in structures - 2 (%)
Housing units in structures - 3 or 4 (%)
Housing units in structures - 5 to 9 (%)
Housing units in structures - 10 to 19 (%)
Housing units in structures - 20 to 49 (%)
Housing units in structures - 50 or more (%)
Housing units in structures - Mobile home (%)
Housing units in structures - Boat, RV, van, etc. (%)
Housing units in structures - Owners - 1, detached (%)
Housing units in structures - Owners - 1, attached (%)
Housing units in structures - Owners - 2 (%)
Housing units in structures - Owners - 3 or 4 (%)
Housing units in structures - Owners - 5 to 9 (%)
Housing units in structures - Owners - 10 to 19 (%)
Housing units in structures - Owners - 20 to 49 (%)
Housing units in structures - Owners - 50 or more (%)
Housing units in structures - Owners - Mobile home (%)
Housing units in structures - Owners - Boat, RV, van, etc. (%)
Housing units in structures - Renters - 1, detached (%)
Housing units in structures - Renters - 1, attached (%)
Housing units in structures - Renters - 2 (%)
Housing units in structures - Renters - 3 or 4 (%)
Housing units in structures - Renters - 5 to 9 (%)
Housing units in structures - Renters - 10 to 19 (%)
Housing units in structures - Renters - 20 to 49 (%)
Housing units in structures - Renters - 50 or more (%)
Housing units in structures - Renters - Mobile home (%)
Housing units in structures - Renters - Boat, RV, van, etc. (%)
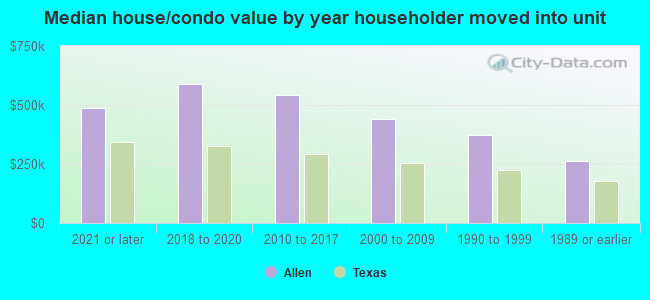
House/condo owner moved in on average (years ago)
Renter moved in on average (years ago)
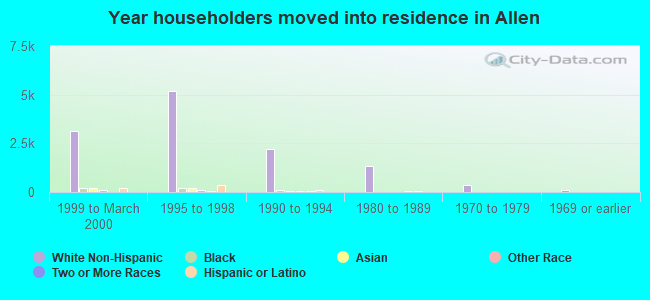
Year householder moved into unit - Moved in 1999 to March 2000 (%)
Year householder moved into unit - Moved in 1999 to March 2000 (%) - White
Year householder moved into unit - Moved in 1999 to March 2000 (%) - Black or African American
Year householder moved into unit - Moved in 1999 to March 2000 (%) - Asian
Year householder moved into unit - Moved in 1999 to March 2000 (%) - Hispanic or Latino
Year householder moved into unit - Moved in 1999 to March 2000 (%) - American Indian and Alaska Native
Year householder moved into unit - Moved in 1999 to March 2000 (%) - Multirace
Year householder moved into unit - Moved in 1999 to March 2000 (%) - Other Race
Year householder moved into unit - Moved in 1995 to 1998 (%)
Year householder moved into unit - Moved in 1995 to 1998 (%) - White
Year householder moved into unit - Moved in 1995 to 1998 (%) - Black or African American
Year householder moved into unit - Moved in 1995 to 1998 (%) - Asian
Year householder moved into unit - Moved in 1995 to 1998 (%) - Hispanic or Latino
Year householder moved into unit - Moved in 1995 to 1998 (%) - American Indian and Alaska Native
Year householder moved into unit - Moved in 1995 to 1998 (%) - Multirace
Year householder moved into unit - Moved in 1995 to 1998 (%) - Other Race
Year householder moved into unit - Moved in 1990 to 1994 (%)
Year householder moved into unit - Moved in 1990 to 1994 (%) - White
Year householder moved into unit - Moved in 1990 to 1994 (%) - Black or African American
Year householder moved into unit - Moved in 1990 to 1994 (%) - Asian
Year householder moved into unit - Moved in 1990 to 1994 (%) - Hispanic or Latino
Year householder moved into unit - Moved in 1990 to 1994 (%) - American Indian and Alaska Native
Year householder moved into unit - Moved in 1990 to 1994 (%) - Multirace
Year householder moved into unit - Moved in 1990 to 1994 (%) - Other Race
Year householder moved into unit - Moved in 1980 to 1989 (%)
Year householder moved into unit - Moved in 1980 to 1989 (%) - White
Year householder moved into unit - Moved in 1980 to 1989 (%) - Black or African American
Year householder moved into unit - Moved in 1980 to 1989 (%) - Asian
Year householder moved into unit - Moved in 1980 to 1989 (%) - Hispanic or Latino
Year householder moved into unit - Moved in 1980 to 1989 (%) - American Indian and Alaska Native
Year householder moved into unit - Moved in 1980 to 1989 (%) - Multirace
Year householder moved into unit - Moved in 1980 to 1989 (%) - Other Race
Year householder moved into unit - Moved in 1970 to 1979 (%)
Year householder moved into unit - Moved in 1970 to 1979 (%) - White
Year householder moved into unit - Moved in 1970 to 1979 (%) - Black or African American
Year householder moved into unit - Moved in 1970 to 1979 (%) - Asian
Year householder moved into unit - Moved in 1970 to 1979 (%) - Hispanic or Latino
Year householder moved into unit - Moved in 1970 to 1979 (%) - American Indian and Alaska Native
Year householder moved into unit - Moved in 1970 to 1979 (%) - Multirace
Year householder moved into unit - Moved in 1970 to 1979 (%) - Other Race
Year householder moved into unit - Moved in 1969 or earlier (%)
Year householder moved into unit - Moved in 1969 or earlier (%) - White
Year householder moved into unit - Moved in 1969 or earlier (%) - Black or African American
Year householder moved into unit - Moved in 1969 or earlier (%) - Asian
Year householder moved into unit - Moved in 1969 or earlier (%) - Hispanic or Latino
Year householder moved into unit - Moved in 1969 or earlier (%) - American Indian and Alaska Native
Year householder moved into unit - Moved in 1969 or earlier (%) - Multirace
Year householder moved into unit - Moved in 1969 or earlier (%) - Other Race
Housing units lacking complete plumbing facilities (%)
Housing units lacking complete kitchen facilities (%)
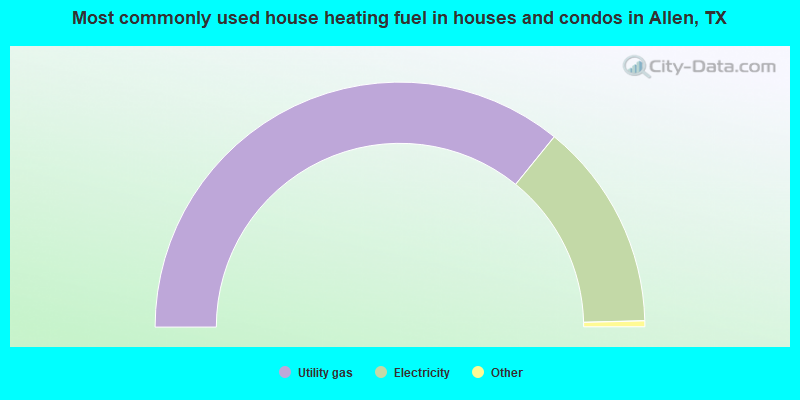
House heating fuel used in houses and condos - Utility gas (%)
House heating fuel used in houses and condos - Bottled, tank, or LP gas (%)
House heating fuel used in houses and condos - Electricity (%)
House heating fuel used in houses and condos - Fuel oil, kerosene, etc. (%)
House heating fuel used in houses and condos - Coal or coke (%)
House heating fuel used in houses and condos - Wood (%)
House heating fuel used in houses and condos - Solar energy (%)
House heating fuel used in houses and condos - Other fuel (%)
House heating fuel used in houses and condos - No fuel used (%)
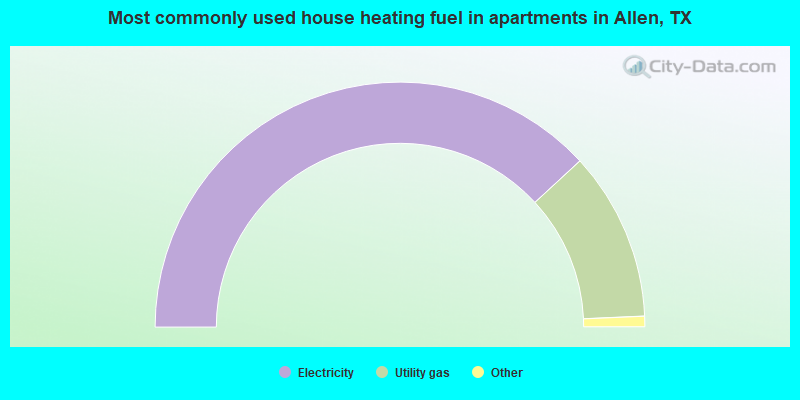
House heating fuel used in apartments - Utility gas (%)
House heating fuel used in apartments - Bottled, tank, or LP gas (%)
House heating fuel used in apartments - Electricity (%)
House heating fuel used in apartments - Fuel oil, kerosene, etc. (%)
House heating fuel used in apartments - Coal or coke (%)
House heating fuel used in apartments - Wood (%)
House heating fuel used in apartments - Solar energy (%)
House heating fuel used in apartments - Other fuel (%)
House heating fuel used in apartments - No fuel used (%)
Latest news about housing in Allen, TX collected exclusively by city-data.com from local newspapers, TV, and radio stations
Median year house/condo built: 2002Median year apartment built: 2009Household type by relationship:
Households: 111,548
Male householders: 23,506 (3,042 living alone ), Female householders: 16,191 (5,752 living alone )24,599 spouses (24,382 opposite-sex spouses ), 1,207 unmarried partners , (1,099 opposite-sex unmarried partners ), 37,868 children (35,614 natural , 834 adopted , 1,420 stepchildren ), 1,322 grandchildren , 487 brothers or sisters , 1,362 parents , 0 foster children , 2,717 other relatives , 1,635 non-relatives In group quarters: 654
Size of family households: 11,617 2-persons , 7,491 3-persons , 6,360 4-persons , 2,608 5-persons , 1,235 6-persons , 470 7-or-more-persons .
Size of nonfamily households: 8,794 1-person , 1,079 2-persons , 43 5-persons .
22,601 married couples with children. single-parent households (730 men , 2,478 women ).
70.7% of residents of Allen speak English at home. of residents speak Spanish at home (68% speak English very well , 23% speak English well , 9% speak English not well , 1% don't speak English at all ).of residents speak other Indo-European language at home (75% speak English very well , 18% speak English well , 6% speak English not well ).of residents speak Asian or Pacific Island language at home (66% speak English very well , 23% speak English well , 10% speak English not well , 2% don't speak English at all ).of residents speak other language at home (61% speak English very well , 37% speak English well , 2% speak English not well ).
Foreign born population: 20,502 (18.4%)of them are naturalized citizens )
Median number of rooms in houses and condos:
Median number of rooms in apartments
Owner-occupied Renter-occupied
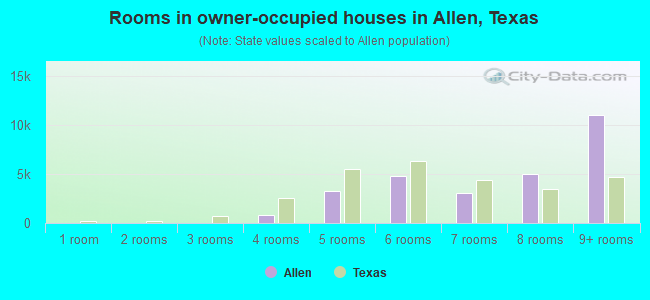
Rooms in owner-occupied houses in Allen, Texas
0 1 room 0 2 rooms 51 3 rooms 845 4 rooms 3,248 5 rooms 4,807 6 rooms 3,022 7 rooms 5,028 8 rooms 11,054 9+ rooms
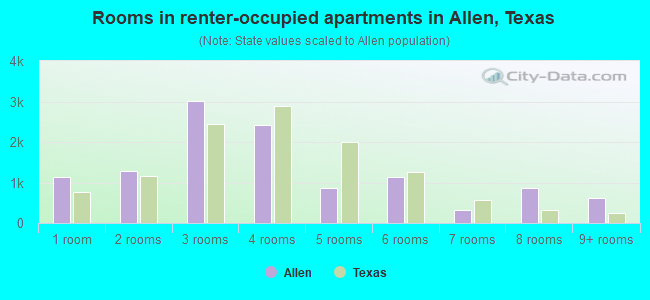
Rooms in renter-occupied apartments in Allen, Texas
1,145 1 room 1,277 2 rooms 3,010 3 rooms 2,410 4 rooms 874 5 rooms 1,125 6 rooms 316 7 rooms 868 8 rooms 617 9+ rooms
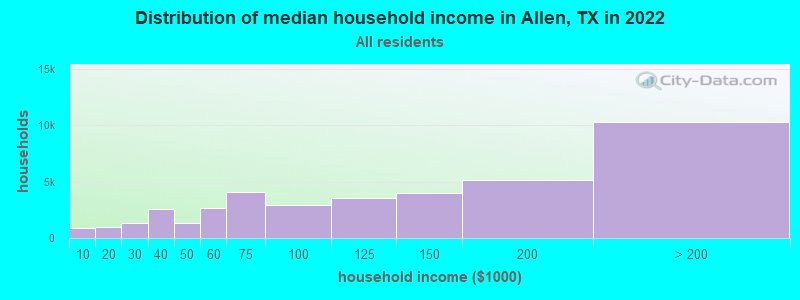
Allen, TX household income distribution 900 Less than $10,000955 $10,000 to $19,9991,333 $20,000 to $29,9992,579 $30,000 to $39,9991,294 $40,000 to $49,9992,634 $50,000 to $59,9994,112 $60,000 to $74,9992,946 $75,000 to $99,9993,582 $100,000 to $124,9993,946 $125,000 to $149,9995,136 $150,000 to $199,99910,280 $200,000 or more
Home value of owner - occupied houses in 2022 in Allen, TX 86 Less than $10,0009 $15,000 to $19,9997 $25,000 to $29,99915 $30,000 to $34,99917 $35,000 to $39,9997 $40,000 to $49,99910 $60,000 to $69,99911 $80,000 to $89,9997 $90,000 to $99,999229 $100,000 to $124,99997 $125,000 to $149,999102 $150,000 to $174,999157 $175,000 to $199,999843 $200,000 to $249,9992,138 $250,000 to $299,9996,687 $300,000 to $399,9995,073 $400,000 to $499,9996,809 $500,000 to $749,9992,977 $750,000 to $999,999517 $1,000,000 to $1,499,999236 $2,000,000 or moreRent paid by renters in 2022 in Allen, TX 43 $350 to $3998 $400 to $449144 $650 to $69933 $700 to $74947 $800 to $89999 $900 to $9991,651 $1,000 to $1,2492,565 $1,250 to $1,4993,465 $1,500 to $1,9992,152 $2,000 to $2,499198 $2,500 to $2,999174 $3,000 to $3,499342 $3,500 or more155 No cash rent
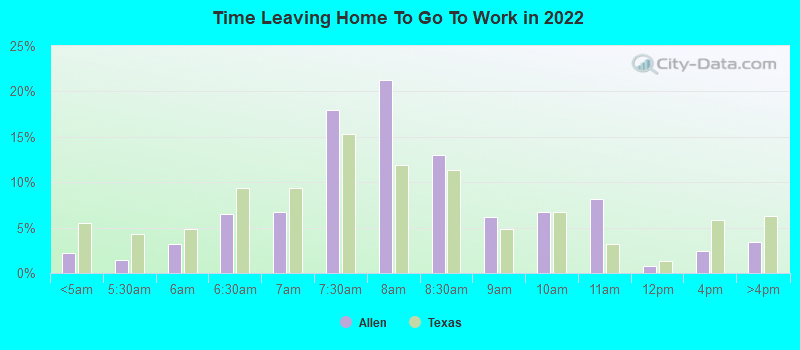
Percentage of workers working in this county: 72.8%Number of people working at home: 16,922 (28.4% of all workers )
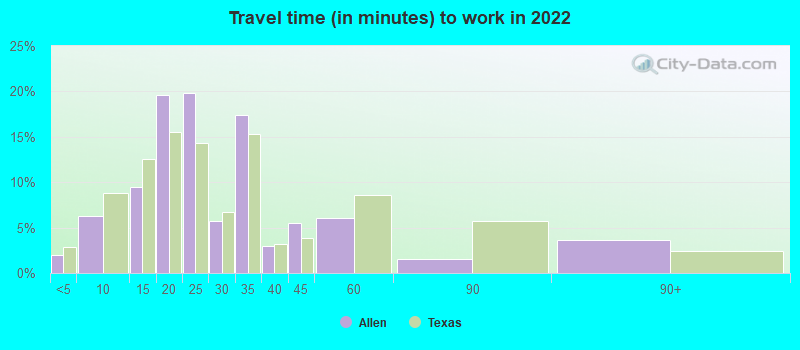
Travel time to work (commute)
Less than 5 minutes: 6695 to 9 minutes: 2,24410 to 14 minutes: 3,52615 to 19 minutes: 4,81320 to 24 minutes: 7,23925 to 29 minutes: 3,02030 to 34 minutes: 5,56135 to 39 minutes: 1,06540 to 44 minutes: 2,53045 to 59 minutes: 5,64060 to 89 minutes: 1,34190 or more minutes: 525
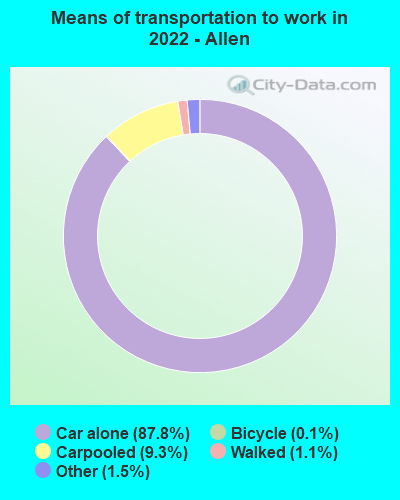
Means of transportation to work:
Drove a car alone: 27,432 (57.5%)Carpooled: 3,123 (6.5%)Bus : 7 (0.0%)Subway or elevated rail : 5 (0.0%)Taxi: 476 (1.0%)Bicycle: 35 (0.1%)Walked: 521 (1.1%)Worked at home: 16,922 (35.5%)
Unemployment by race in 2022
Unemployment rate for White non-Hispanic residents 1.8% Males4.6% FemalesUnemployment rate for Black residents 2.4% Males10.3% FemalesUnemployment rate for American Indian and Alaska Native residents 3.1% MalesUnemployment rate for Asian residents 1.2% Males1.1% FemalesUnemployment rate for other race residents 6.8% Males25.7% FemalesUnemployment rate for two or more race residents 2.4% Males4.9% FemalesUnemployment rate for Hispanic or Latino residents 1.6% Males7.2% Females
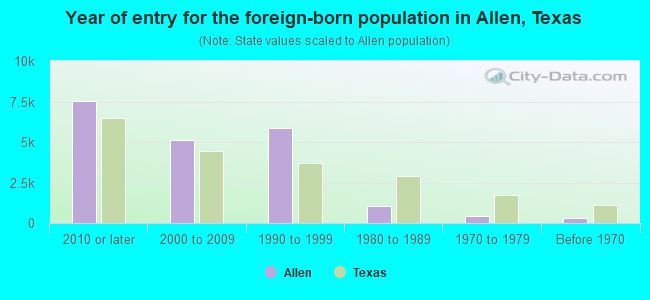
Year of entry for the foreign-born population in Allen, Texas
7,540 2010 or later 5,135 2000 to 2009 5,838 1990 to 1999 1,028 1980 to 1989 417 1970 to 1979 311 Before 1970
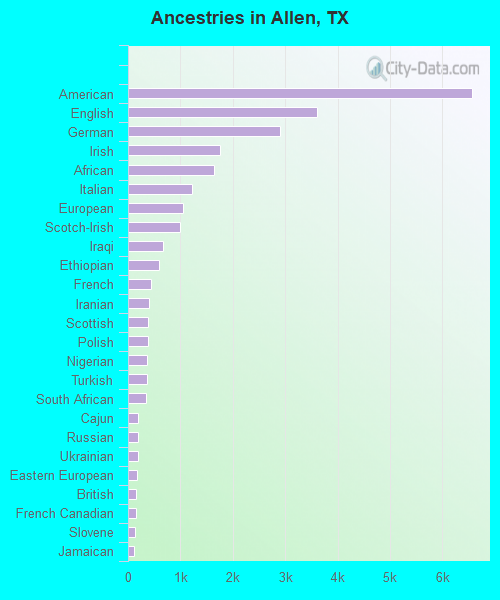
First ancestries reported:
American: 6,564 (10.5%)
English: 3,609 (5.8%)
German: 2,902 (4.6%)
Irish: 1,766 (2.8%)
African: 1,647 (2.6%)
Italian: 1,227 (2.0%)
European: 1,051 (1.7%)
Scotch-Irish: 986 (1.6%)
Iraqi: 672 (1.1%)
Ethiopian: 586 (0.9%)
French: 431 (0.7%)
Iranian: 400 (0.6%)
Scottish: 391 (0.6%)
Polish: 390 (0.6%)
Nigerian: 372 (0.6%)
Turkish: 361 (0.6%)
South African: 339 (0.5%)
Cajun: 200 (0.3%)
Russian: 194 (0.3%)
Ukrainian: 182 (0.3%)
Eastern European: 169 (0.3%)
British: 157 (0.3%)
French Canadian: 149 (0.2%)
Slovene: 143 (0.2%)
Jamaican: 108 (0.2%)
Swedish: 102 (0.2%)
Greek: 98 (0.2%)
Afghan: 95 (0.2%)
Hungarian: 95 (0.2%)
Lebanese: 90 (0.1%)
Romanian: 83 (0.1%)
Swiss: 80 (0.1%)
Czech: 71 (0.1%)
Israeli: 68 (0.1%)
Dutch: 63 (0.1%)
Ghanaian: 59 (0.09%)
Czechoslovakian: 58 (0.09%)
Norwegian: 57 (0.09%)
Austrian: 52 (0.08%)
Scandinavian: 48 (0.08%)
Egyptian: 46 (0.07%)
Belgian: 46 (0.07%)
Slovak: 40 (0.06%)
Jordanian: 39 (0.06%)
Canadian: 37 (0.06%)
Slavic: 33 (0.05%)
Brazilian: 32 (0.05%)
Palestinian: 29 (0.05%)
Danish: 25 (0.04%)
Haitian: 20 (0.03%)
Syrian: 18 (0.03%)
Albanian: 17 (0.03%)
Finnish: 17 (0.03%)
Welsh: 15 (0.02%)
Barbadian: 15 (0.02%)
Northern European: 11 (0.02%)
Australian: 11 (0.02%)
Trinidadian and Tobagonian: 7 (0.01%)
Arab: 6 (0.01%)
Most common places of birth for foreign-born residents (%): India Allen:
19.8% (4,477)Texas:
6.1% (306,347)
China, excluding Hong Kong and Taiwan Allen:
14.0% (3,153)Texas:
2.3% (115,558)
Mexico Allen:
5.2% (1,178)Texas:
48.4% (2,411,723)
Vietnam Allen:
4.5% (1,007)Texas:
3.7% (184,770)
Turkey Allen:
3.6% (805)Texas:
0.3% (13,298)
Korea Allen:
3.1% (694)Texas:
1.2% (60,172)
Philippines Allen:
3.0% (674)Texas:
2.1% (103,148)
Taiwan Allen:
2.7% (616)Texas:
0.6% (27,844)
Pakistan Allen:
2.5% (574)Texas:
1.2% (62,159)
Venezuela Allen:
2.3% (517)Texas:
1.5% (72,413)
Canada Allen:
2.2% (486)Texas:
1.1% (55,371)
Brazil Allen:
2.1% (479)Texas:
0.5% (24,723)
Africa, n.e.c. Allen:
1.9% (427)Texas:
0.2% (11,205)
Bangladesh Allen:
1.8% (410)Texas:
0.3% (16,549)
Lebanon Allen:
1.8% (408)Texas:
0.2% (9,332)
Peru Allen:
1.8% (399)Texas:
0.4% (21,746)
Place of birth for U.S.-born residents:
This state: 45,142Other state: 43,878Northeast: 6,324Midwest: 12,964South: 13,879West: 10,711 88.8% of Allen residents lived in the same house 1 years ago.
Out of people who lived in different houses, 36.4% lived in this county.
Out of people who lived in different counties, 51.6% lived in Texas.
Allen:
88.8%State average:
85.7%
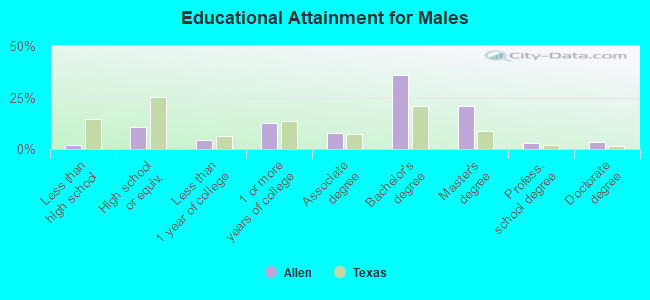
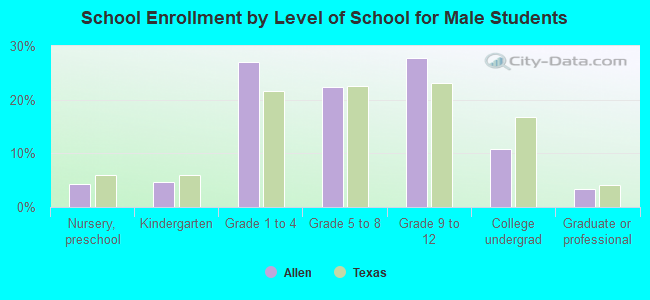
Education attainment for males 25 years and older:
No schooling: 412Nursery to 4th grade: 05th and 6th grade: 07th and 8th grade: 499th grade: 010th grade: 11211th grade: 012th grade, no diploma: 51High school graduate (or equivalency): 3,861Less than 1 year of college: 1,547Some college more than 1 year, no degree: 4,591Associate degree: 2,754Bachelor's degree: 12,820Master's degree: 7,522Professional school degree: 983Doctorate degree: 1,194
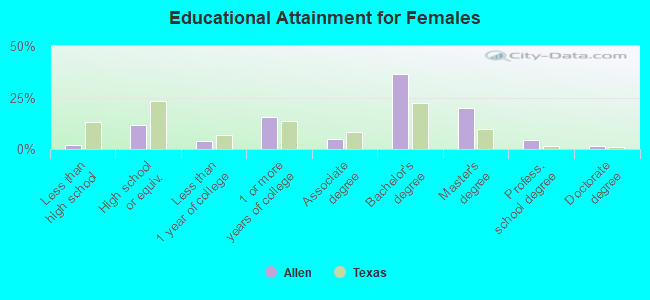
Education attainment for females 25 years and older:
No schooling: 443Nursery to 4th grade: 05th and 6th grade: 887th and 8th grade: 09th grade: 6210th grade: 011th grade: 012th grade, no diploma: 153High school graduate (or equivalency): 4,265Less than 1 year of college: 1,387Some college more than 1 year, no degree: 5,726Associate degree: 1,857Bachelor's degree: 13,543Master's degree: 7,372Professional school degree: 1,659Doctorate degree: 463
Housing units in structures:
One, detached: 29,925One, attached: 869Two: 4993 or 4: 5965 to 9: 87710 to 19: 1,30120 to 49: 1,91250 or more: 4,858Mobile homes: 54Housing units lacking complete kitchen facilities in 2022: 1.6%House/condo owner moved in on average 9 years ago
Renter moved in on average 1 years ago
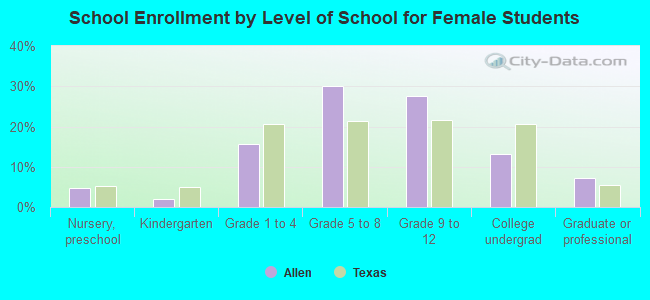
Private vs. public school enrollment:
Students in private schools in grades 1 to 8 (elementary and middle school): 1,803 Students in private schools in grades 9 to 12 (high school): 267 Students in private undergraduate colleges: 474