Allentown, PA (Pennsylvania) Houses and Residents
Estimated median house or condo value in 2022: $206,200 (it was $77,000 in 2000 )
Allentown:
$206,200Pennsylvania:
$245,500
Lower value quartile - upper value quartile: $154,300 - $263,400Mean price in 2022: Detached houses: $279,336 Here:
$279,336State:
$317,202
Townhouses or other attached units: $161,802 Here:
$161,802State:
$254,369
In 2-unit structures: $260,052 Here:
$260,052State:
$249,182
In 3-to-4-unit structures: $195,428 Here:
$195,428State:
$297,446
In 5-or-more-unit structures: $269,273 Here:
$269,273State:
$320,068
Mobile homes: $65,682 Here:
$65,682State:
$92,414
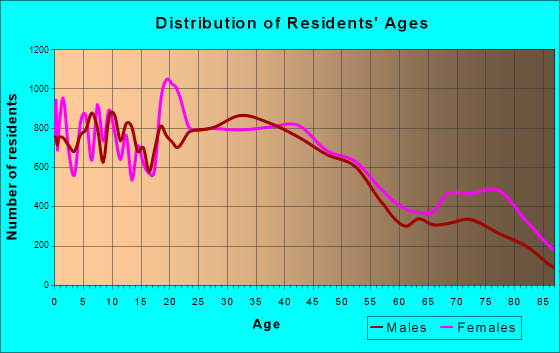
Total population: 119,104 (Urban population: 106,632, Rural population: 0)
Houses: 49,553 (46,536 occupied: 19,107 owner occupied, 27,429 renter occupied )
% of renters here:
59%State:
31%
Housing density: 2,794 houses/condos per square mile
Median price asked for vacant for-sale houses and condos in 2022: $215,755.
Median contract rent in 2022: $1,025 (lower quartile is $857, upper quartile is $1,308)
Median rent asked for vacant for-rent units in 2022: $1,222
Median gross rent in Allentown, PA in 2022: $1,201
Housing units in Allentown with a mortgage: 11,992 (1,205 second mortgage, 24 home equity loan, 947 both second mortgage and home equity loan )Houses without a mortgage: 226
Median household income for houses/condos with a mortgage: $81,978
Median household income for apartments without a mortgage: $71,006
Median monthly housing costs: $1,188
Data:
Median house or condo value ($)
Median house or condo value ($ change since 2000)
Median house or condo value ($) - White
Median house or condo value ($) - Black or African American
Median house or condo value ($) - Asian
Median house or condo value ($) - Hispanic or Latino
Median house or condo value ($) - American Indian and Alaska Native
Median house or condo value ($) - Multirace
Median house or condo value ($) - Other Race
Median price asked for mobile homes ($)
Household density (households per square mile)
Mean house or condo value by units in structure - 1, detached ($)
Mean house or condo value by units in structure - 1, attached ($)
Mean house or condo value by units in structure - 2 ($)
Mean house or condo value by units in structure by units in structure - 3 or 4 ($)
Mean house or condo value by units in structure - 5 or more ($)
Mean house or condo value by units in structure - Boat, RV, van, etc. ($)
Mean house or condo value by units in structure - Mobile home ($)
Median contract rent ($)
Median contract rent - Lower quartile ($)
Median contract rent - Upper quartile ($)
Median gross rent ($)
Urban houses (%)
Rural houses (%)
Houses occupied (%)
Houses occupied (% change since 2000)
Houses owner occupied (%)
Houses owner occupied (% change since 2000)
Houses renter occupied (%)
Houses renter occupied (% change since 2000)
Vacant housing units - For rent (%)
Vacant housing units - For rent (% change since 2000)
Vacant housing units - For sale only (%)
Vacant housing units - For sale only (% change since 2000)
Vacant housing units - Rented or sold, not occupied (%)
Vacant housing units - Rented or sold, not occupied (% change since 2000)
Vacant housing units - For seasonal, recreational, or occasional use (%)
Vacant housing units - For seasonal, recreational, or occasional use (% change since 2000)
Vacant housing units - For migrant workers (%)
Vacant housing units - For migrant workers (% change since 2000)
Vacant housing units - Other vacant (%)
Vacant housing units - Other vacant (% change since 2000)
Median monthly housing costs ($)
Median household income for houses/condos with a mortgage ($)
Median household income for houses/condos without a mortgage ($)
Median household income ($)
Median household income ($) - White
Median household income ($) - Black or African American
Median household income ($) - Asian
Median household income ($) - Hispanic or Latino
Median household income ($) - American Indian and Alaska Native
Median household income ($) - Multirace
Median household income ($) - Other Race
Mortgage status - with mortgage (%)
Mortgage status - with second mortgage (%)
Mortgage status - with home equity loan (%)
Mortgage status - with both second mortgage and home equity loan (%)
Mortgage status - without a mortgage (%)
Median year house/condo built
Median year apartment built
Household type by relationship - Male householder living alone (%)
Household type by relationship - Male householder not living alone (%)
Household type by relationship - Female householder living alone (%)
Household type by relationship - Female householder not living alone (%)
Household type by relationship - Opposite-Sex spouse (%)
Household type by relationship - Same-Sex spouse (%)
Household type by relationship - Opposite-Sex unmarried partner (%)
Household type by relationship - Same-Sex unmarried partner (%)
Household type by relationship - In group quarters (%)
Size of family households - 2-person household (%)
Size of family households - 3-person household (%)
Size of family households - 4-person household (%)
Size of family households - 5-person household (%)
Size of family households - 6-person household (%)
Size of family households - 7-or-more-person household (%)
Size of nonfamily households - 1-person household (%)
Size of nonfamily households - 2-person household (%)
Size of nonfamily households - 3-person household (%)
Size of nonfamily households - 4-person household (%)
Size of nonfamily households - 5-person household (%)
Size of nonfamily households - 6-person household (%)
Size of nonfamily households - 7-or-moreperson household (%)
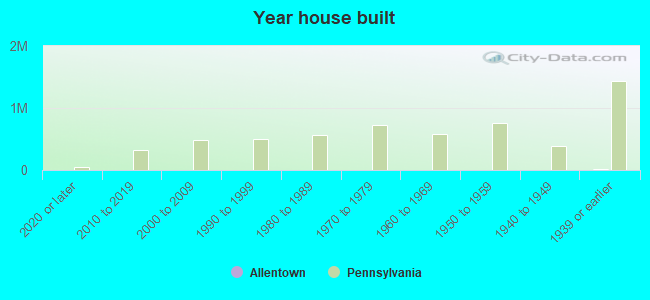
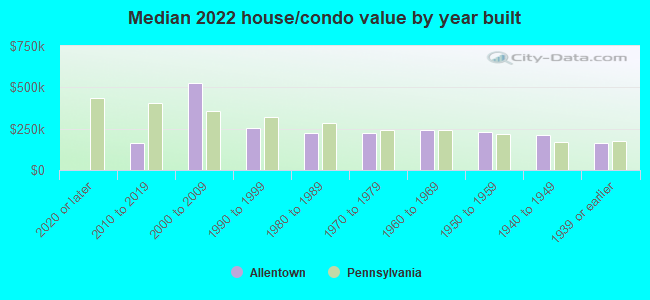
Year house built - Built 2010 or later (%)
Year house built - Built 2000 to 2009 (%)
Year house built - Built 1990 to 1999 (%)
Year house built - Built 1980 to 1989 (%)
Year house built - Built 1970 to 1979 (%)
Year house built - Built 1960 to 1969 (%)
Year house built - Built 1950 to 1959 (%)
Year house built - Built 1940 to 1949 (%)
Year house built - Built 1939 or earlier (%)
Median number of rooms in houses and condos
Median number of rooms in apartments
Median number of bedrooms in owner occupied houses
Mean number of bedrooms in owner occupied houses
Median number of bedrooms in renter occupied houses
Mean number of bedrooms in renter occupied houses
Median number of vehichles in owner occupied houses
Mean number of vehichles in owner occupied houses
Median number of vehichles in renter occupied houses
Mean number of vehichles in renter occupied houses
Rooms in owner-occupied houses - 1 room (%)
Rooms in owner-occupied houses - 2 rooms (%)
Rooms in owner-occupied houses - 3 rooms (%)
Rooms in owner-occupied houses - 4 rooms (%)
Rooms in owner-occupied houses - 5 rooms (%)
Rooms in owner-occupied houses - 6 rooms (%)
Rooms in owner-occupied houses - 7 rooms (%)
Rooms in owner-occupied houses - 8 rooms (%)
Rooms in owner-occupied houses - 9+ rooms (%)
Rooms in renter-occupied houses - 1 room (%)
Rooms in renter-occupied houses - 2 rooms (%)
Rooms in renter-occupied houses - 3 rooms (%)
Rooms in renter-occupied houses - 4 rooms (%)
Rooms in renter-occupied houses - 5 rooms (%)
Rooms in renter-occupied houses - 6 rooms (%)
Rooms in renter-occupied houses - 7 rooms (%)
Rooms in renter-occupied houses - 8 rooms (%)
Rooms in renter-occupied houses - 9+ rooms (%)
Bedrooms in owner-occupied houses - no bedrooms (%)
Bedrooms in owner-occupied houses - 1 bedroom (%)
Bedrooms in owner-occupied houses - 2 bedrooms (%)
Bedrooms in owner-occupied houses - 3 bedrooms (%)
Bedrooms in owner-occupied houses - 4 bedrooms (%)
Bedrooms in owner-occupied houses - 5+ bedrooms (%)
Bedrooms in renter-occupied houses - no bedrooms (%)
Bedrooms in renter-occupied houses - 1 bedroom (%)
Bedrooms in renter-occupied houses - 2 bedrooms (%)
Bedrooms in renter-occupied houses - 3 bedrooms (%)
Bedrooms in renter-occupied houses - 4 bedrooms (%)
Bedrooms in renter-occupied houses - 5+ bedrooms (%)
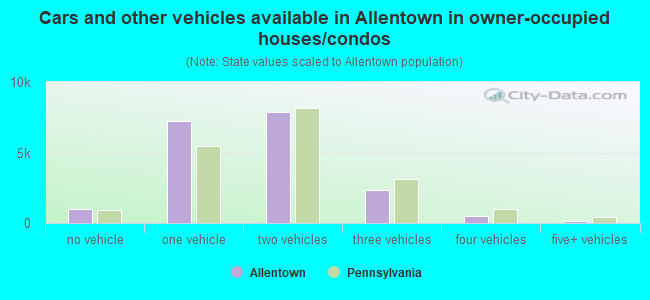
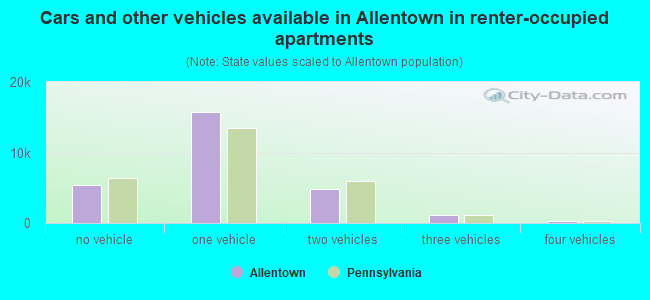
Vehicles available in owner-occupied houses - no vehicle available (%)
Vehicles available in owner-occupied houses - 1 vehicle available(%)
Vehicles available in owner-occupied houses - 2 Vehicles available (%)
Vehicles available in owner-occupied houses - 3 Vehicles available (%)
Vehicles available in owner-occupied houses - 4 Vehicles available (%)
Vehicles available in owner-occupied houses - 5+ Vehicles available (%)
Vehicles available in renter-occupied houses - no vehicle available (%)
Vehicles available in renter-occupied houses - 1 vehicle available (%)
Vehicles available in renter-occupied houses - 2 Vehicles available (%)
Vehicles available in renter-occupied houses - 3 Vehicles available (%)
Vehicles available in renter-occupied houses - 4 Vehicles available (%)
Vehicles available in renter-occupied houses - 5+ Vehicles available (%)
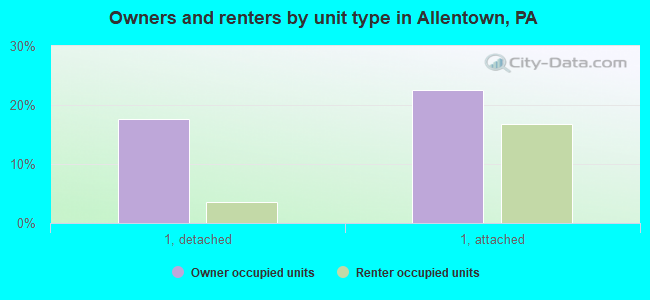
Housing units in structures - 1, detached (%)
Housing units in structures - 1, attached (%)
Housing units in structures - 2 (%)
Housing units in structures - 3 or 4 (%)
Housing units in structures - 5 to 9 (%)
Housing units in structures - 10 to 19 (%)
Housing units in structures - 20 to 49 (%)
Housing units in structures - 50 or more (%)
Housing units in structures - Mobile home (%)
Housing units in structures - Boat, RV, van, etc. (%)
Housing units in structures - Owners - 1, detached (%)
Housing units in structures - Owners - 1, attached (%)
Housing units in structures - Owners - 2 (%)
Housing units in structures - Owners - 3 or 4 (%)
Housing units in structures - Owners - 5 to 9 (%)
Housing units in structures - Owners - 10 to 19 (%)
Housing units in structures - Owners - 20 to 49 (%)
Housing units in structures - Owners - 50 or more (%)
Housing units in structures - Owners - Mobile home (%)
Housing units in structures - Owners - Boat, RV, van, etc. (%)
Housing units in structures - Renters - 1, detached (%)
Housing units in structures - Renters - 1, attached (%)
Housing units in structures - Renters - 2 (%)
Housing units in structures - Renters - 3 or 4 (%)
Housing units in structures - Renters - 5 to 9 (%)
Housing units in structures - Renters - 10 to 19 (%)
Housing units in structures - Renters - 20 to 49 (%)
Housing units in structures - Renters - 50 or more (%)
Housing units in structures - Renters - Mobile home (%)
Housing units in structures - Renters - Boat, RV, van, etc. (%)
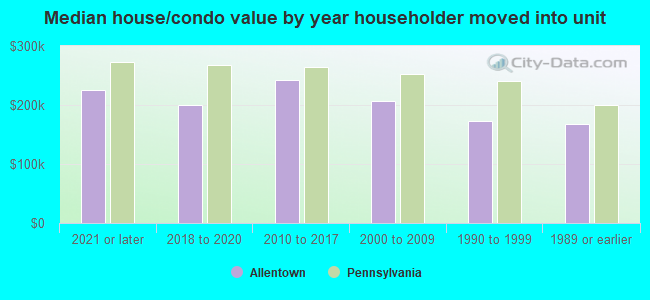
House/condo owner moved in on average (years ago)
Renter moved in on average (years ago)
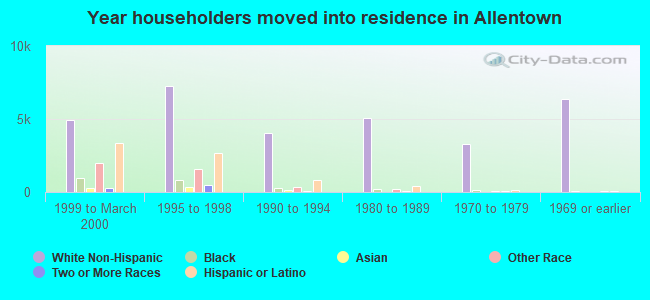
Year householder moved into unit - Moved in 1999 to March 2000 (%)
Year householder moved into unit - Moved in 1999 to March 2000 (%) - White
Year householder moved into unit - Moved in 1999 to March 2000 (%) - Black or African American
Year householder moved into unit - Moved in 1999 to March 2000 (%) - Asian
Year householder moved into unit - Moved in 1999 to March 2000 (%) - Hispanic or Latino
Year householder moved into unit - Moved in 1999 to March 2000 (%) - American Indian and Alaska Native
Year householder moved into unit - Moved in 1999 to March 2000 (%) - Multirace
Year householder moved into unit - Moved in 1999 to March 2000 (%) - Other Race
Year householder moved into unit - Moved in 1995 to 1998 (%)
Year householder moved into unit - Moved in 1995 to 1998 (%) - White
Year householder moved into unit - Moved in 1995 to 1998 (%) - Black or African American
Year householder moved into unit - Moved in 1995 to 1998 (%) - Asian
Year householder moved into unit - Moved in 1995 to 1998 (%) - Hispanic or Latino
Year householder moved into unit - Moved in 1995 to 1998 (%) - American Indian and Alaska Native
Year householder moved into unit - Moved in 1995 to 1998 (%) - Multirace
Year householder moved into unit - Moved in 1995 to 1998 (%) - Other Race
Year householder moved into unit - Moved in 1990 to 1994 (%)
Year householder moved into unit - Moved in 1990 to 1994 (%) - White
Year householder moved into unit - Moved in 1990 to 1994 (%) - Black or African American
Year householder moved into unit - Moved in 1990 to 1994 (%) - Asian
Year householder moved into unit - Moved in 1990 to 1994 (%) - Hispanic or Latino
Year householder moved into unit - Moved in 1990 to 1994 (%) - American Indian and Alaska Native
Year householder moved into unit - Moved in 1990 to 1994 (%) - Multirace
Year householder moved into unit - Moved in 1990 to 1994 (%) - Other Race
Year householder moved into unit - Moved in 1980 to 1989 (%)
Year householder moved into unit - Moved in 1980 to 1989 (%) - White
Year householder moved into unit - Moved in 1980 to 1989 (%) - Black or African American
Year householder moved into unit - Moved in 1980 to 1989 (%) - Asian
Year householder moved into unit - Moved in 1980 to 1989 (%) - Hispanic or Latino
Year householder moved into unit - Moved in 1980 to 1989 (%) - American Indian and Alaska Native
Year householder moved into unit - Moved in 1980 to 1989 (%) - Multirace
Year householder moved into unit - Moved in 1980 to 1989 (%) - Other Race
Year householder moved into unit - Moved in 1970 to 1979 (%)
Year householder moved into unit - Moved in 1970 to 1979 (%) - White
Year householder moved into unit - Moved in 1970 to 1979 (%) - Black or African American
Year householder moved into unit - Moved in 1970 to 1979 (%) - Asian
Year householder moved into unit - Moved in 1970 to 1979 (%) - Hispanic or Latino
Year householder moved into unit - Moved in 1970 to 1979 (%) - American Indian and Alaska Native
Year householder moved into unit - Moved in 1970 to 1979 (%) - Multirace
Year householder moved into unit - Moved in 1970 to 1979 (%) - Other Race
Year householder moved into unit - Moved in 1969 or earlier (%)
Year householder moved into unit - Moved in 1969 or earlier (%) - White
Year householder moved into unit - Moved in 1969 or earlier (%) - Black or African American
Year householder moved into unit - Moved in 1969 or earlier (%) - Asian
Year householder moved into unit - Moved in 1969 or earlier (%) - Hispanic or Latino
Year householder moved into unit - Moved in 1969 or earlier (%) - American Indian and Alaska Native
Year householder moved into unit - Moved in 1969 or earlier (%) - Multirace
Year householder moved into unit - Moved in 1969 or earlier (%) - Other Race
Housing units lacking complete plumbing facilities (%)
Housing units lacking complete kitchen facilities (%)
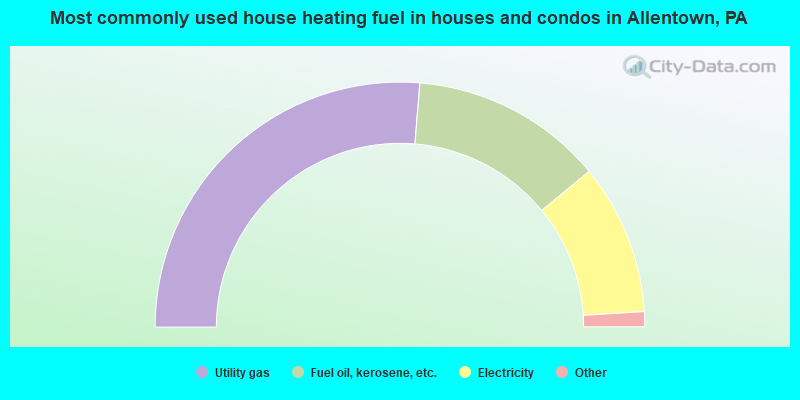
House heating fuel used in houses and condos - Utility gas (%)
House heating fuel used in houses and condos - Bottled, tank, or LP gas (%)
House heating fuel used in houses and condos - Electricity (%)
House heating fuel used in houses and condos - Fuel oil, kerosene, etc. (%)
House heating fuel used in houses and condos - Coal or coke (%)
House heating fuel used in houses and condos - Wood (%)
House heating fuel used in houses and condos - Solar energy (%)
House heating fuel used in houses and condos - Other fuel (%)
House heating fuel used in houses and condos - No fuel used (%)
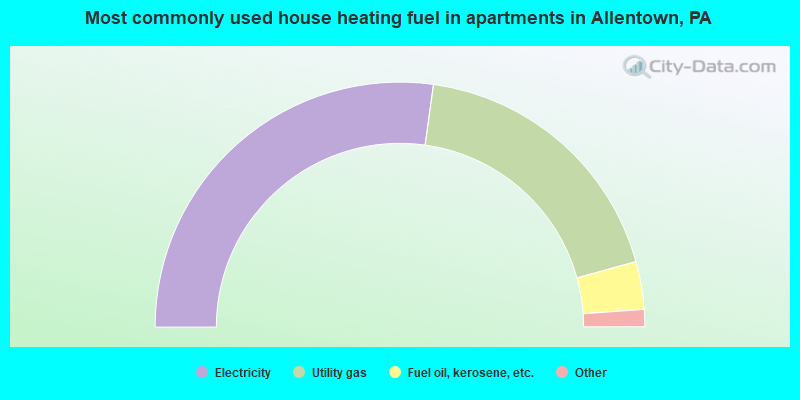
House heating fuel used in apartments - Utility gas (%)
House heating fuel used in apartments - Bottled, tank, or LP gas (%)
House heating fuel used in apartments - Electricity (%)
House heating fuel used in apartments - Fuel oil, kerosene, etc. (%)
House heating fuel used in apartments - Coal or coke (%)
House heating fuel used in apartments - Wood (%)
House heating fuel used in apartments - Solar energy (%)
House heating fuel used in apartments - Other fuel (%)
House heating fuel used in apartments - No fuel used (%)
Latest news about housing in Allentown, PA collected exclusively by city-data.com from local newspapers, TV, and radio stations
Median year house/condo built: 1950Median year apartment built: 1954Household type by relationship:
Households: 125,105
Male householders: 21,691 (8,188 living alone ), Female householders: 24,845 (6,730 living alone )14,517 spouses (14,383 opposite-sex spouses ), 4,400 unmarried partners , (4,251 opposite-sex unmarried partners ), 39,258 children (38,034 natural , 144 adopted , 1,080 stepchildren ), 2,557 grandchildren , 1,432 brothers or sisters , 3,710 parents , 0 foster children , 3,122 other relatives , 4,392 non-relatives In group quarters: 5,181
Size of family households: 11,350 2-persons , 6,649 3-persons , 5,291 4-persons , 2,605 5-persons , 299 6-persons , 1,017 7-or-more-persons .
Size of nonfamily households: 14,918 1-person , 3,769 2-persons , 109 3-persons , 422 4-persons , 107 5-persons .
9,453 married couples with children. single-parent households (2,008 men , 13,375 women ).
53.4% of residents of Allentown speak English at home. of residents speak Spanish at home (44% speak English very well , 23% speak English well , 23% speak English not well , 10% don't speak English at all ).of residents speak other Indo-European language at home (63% speak English very well , 18% speak English well , 15% speak English not well , 4% don't speak English at all ).of residents speak Asian or Pacific Island language at home (56% speak English very well , 19% speak English well , 25% speak English not well ).of residents speak other language at home (57% speak English very well , 26% speak English well , 14% speak English not well , 3% don't speak English at all ).
Foreign born population: 32,678 (26.1%)of them are naturalized citizens )
Median number of rooms in houses and condos:
Median number of rooms in apartments
Owner-occupied Renter-occupied
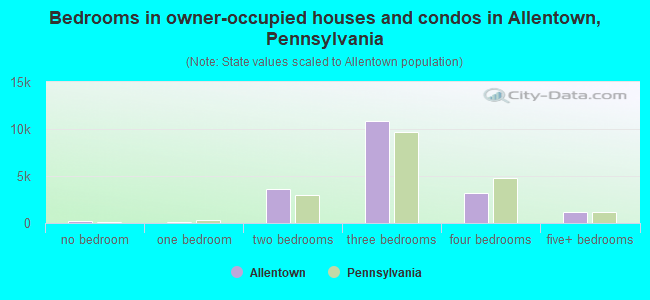
Bedrooms in owner-occupied houses and condos in Allentown, Pennsylvania
217 no bedroom 69 1 bedroom 3,616 2 bedrooms 10,895 3 bedrooms 3,154 4 bedrooms 1,156 5+ bedrooms
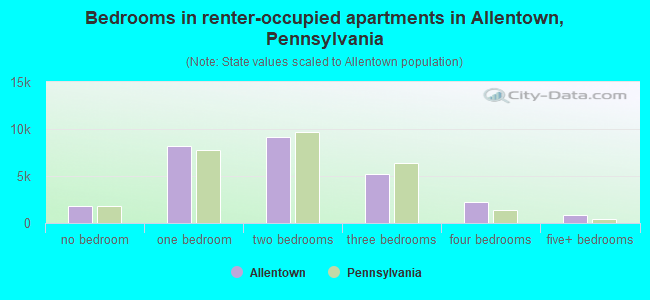
Bedrooms in renter-occupied apartments in Allentown, Pennsylvania
1,785 no bedroom 8,164 1 bedroom 9,185 2 bedrooms 5,204 3 bedrooms 2,269 4 bedrooms 822 5+ bedrooms
Owner-occupied Renter-occupied
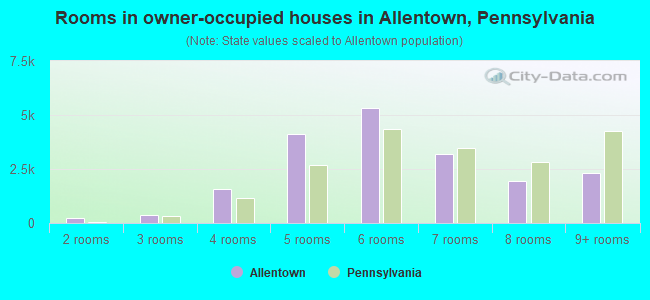
Rooms in owner-occupied houses in Allentown, Pennsylvania
0 1 room 217 2 rooms 386 3 rooms 1,597 4 rooms 4,111 5 rooms 5,338 6 rooms 3,199 7 rooms 1,950 8 rooms 2,309 9+ rooms
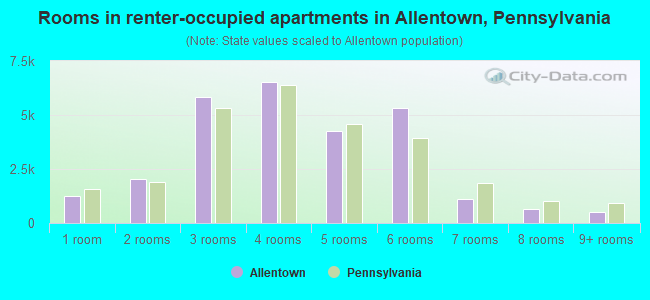
Rooms in renter-occupied apartments in Allentown, Pennsylvania
1,236 1 room 2,045 2 rooms 5,833 3 rooms 6,528 4 rooms 4,242 5 rooms 5,307 6 rooms 1,105 7 rooms 633 8 rooms 500 9+ rooms
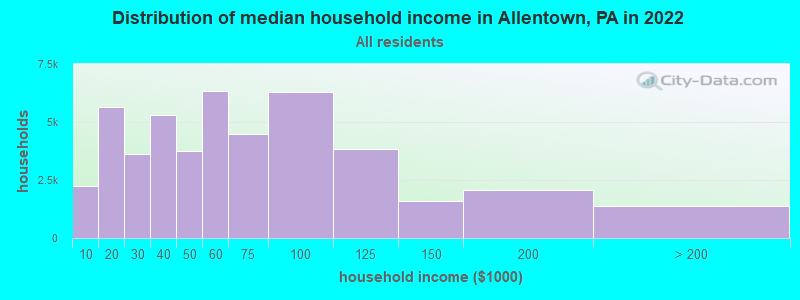
Allentown, PA household income distribution 2,220 Less than $10,0005,634 $10,000 to $19,9993,607 $20,000 to $29,9995,312 $30,000 to $39,9993,729 $40,000 to $49,9996,337 $50,000 to $59,9994,500 $60,000 to $74,9996,307 $75,000 to $99,9993,856 $100,000 to $124,9991,590 $125,000 to $149,9992,078 $150,000 to $199,9991,366 $200,000 or more
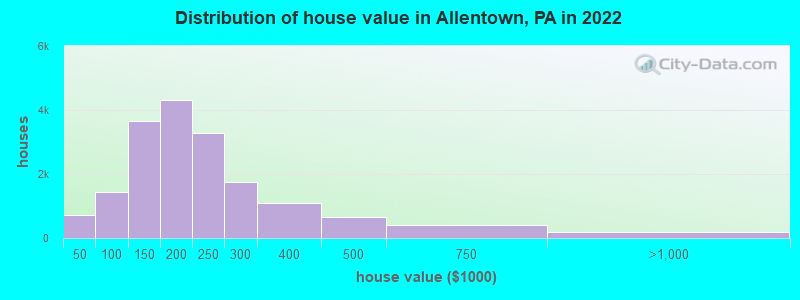
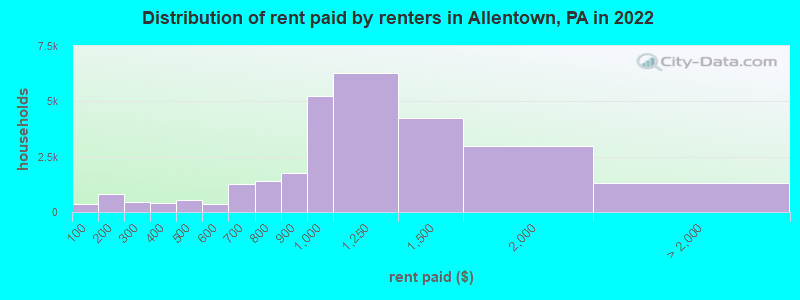
Home value of owner - occupied houses in 2022 in Allentown, PA 99 Less than $10,00036 $10,000 to $14,999173 $15,000 to $19,99969 $20,000 to $24,99986 $25,000 to $29,99973 $30,000 to $34,99937 $35,000 to $39,999130 $40,000 to $49,999155 $50,000 to $59,999177 $60,000 to $69,999306 $70,000 to $79,999182 $80,000 to $89,999494 $90,000 to $99,9991,344 $100,000 to $124,9992,310 $125,000 to $149,9992,715 $150,000 to $174,9991,611 $175,000 to $199,9993,282 $200,000 to $249,9991,752 $250,000 to $299,9991,093 $300,000 to $399,999646 $400,000 to $499,999407 $500,000 to $749,999123 $750,000 to $999,99945 $1,000,000 to $1,499,99921 $2,000,000 or moreRent paid by renters in 2022 in Allentown, PA 356 Less than $100250 $100 to $149544 $150 to $19969 $200 to $249384 $250 to $299414 $350 to $399345 $400 to $449213 $450 to $499151 $500 to $549200 $550 to $599833 $600 to $649454 $650 to $699701 $700 to $749696 $750 to $7991,779 $800 to $8995,233 $900 to $9996,285 $1,000 to $1,2494,225 $1,250 to $1,4992,974 $1,500 to $1,999230 $2,000 to $2,49992 $2,500 to $2,99990 $3,500 or more911 No cash rent
Percentage of workers working in this county: 70.1%Number of people working at home: 5,098 (8.7% of all workers )
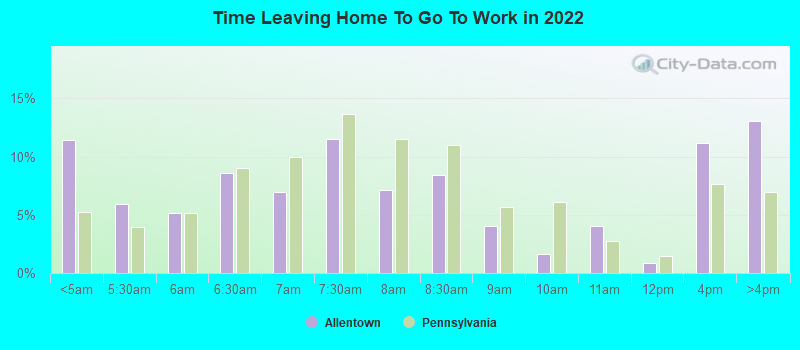
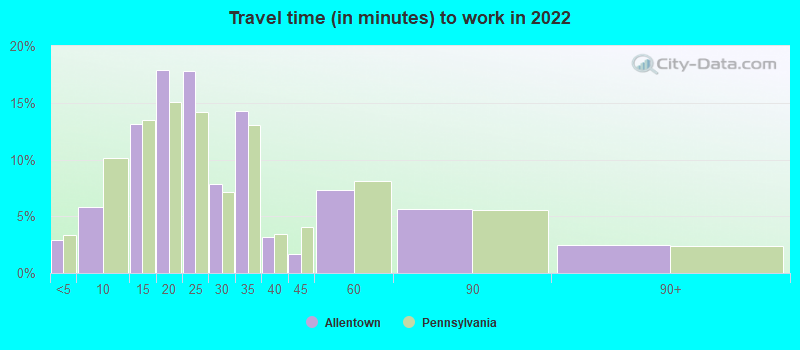
Travel time to work (commute)
Less than 5 minutes: 1,4105 to 9 minutes: 3,18110 to 14 minutes: 6,53115 to 19 minutes: 10,28420 to 24 minutes: 13,17425 to 29 minutes: 4,91330 to 34 minutes: 10,36935 to 39 minutes: 77940 to 44 minutes: 1,01845 to 59 minutes: 2,45460 to 89 minutes: 2,16890 or more minutes: 1,565
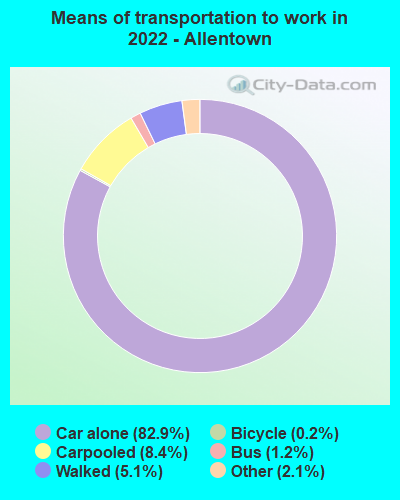
Means of transportation to work:
Drove a car alone: 38,314 (72.5%)Carpooled: 4,677 (8.9%)Bus : 532 (1.0%)Ferryboat: 20 (0.0%)Taxi: 1,965 (3.7%)Bicycle: 124 (0.2%)Walked: 2,210 (4.2%)Worked at home: 5,098 (9.6%)
Unemployment by race in 2022
Unemployment rate for White non-Hispanic residents 6.0% Males2.4% FemalesUnemployment rate for Black residents 7.4% Males9.7% FemalesUnemployment rate for American Indian and Alaska Native residents 4.6% MalesUnemployment rate for Asian residents 3.9% Males5.5% FemalesUnemployment rate for other race residents 9.8% Males15.1% FemalesUnemployment rate for two or more race residents 6.1% Males9.0% FemalesUnemployment rate for Hispanic or Latino residents 8.8% Males12.3% Females
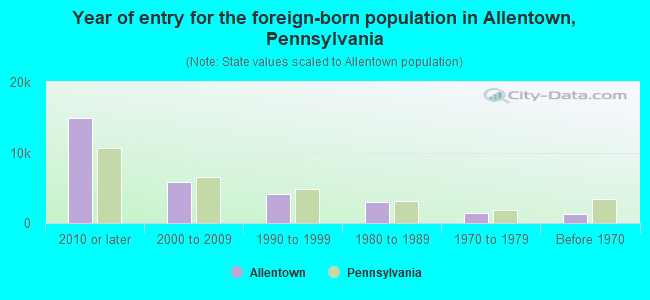
Year of entry for the foreign-born population in Allentown, Pennsylvania
14,920 2010 or later 5,754 2000 to 2009 4,131 1990 to 1999 2,938 1980 to 1989 1,360 1970 to 1979 1,344 Before 1970
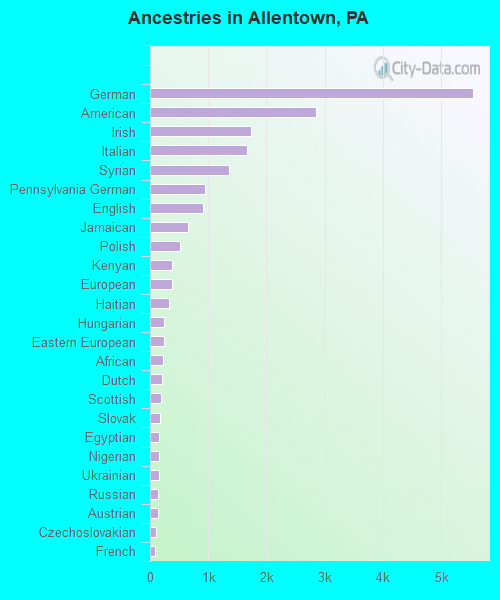
First ancestries reported:
German: 5,547 (6.9%)
American: 2,850 (3.5%)
Irish: 1,741 (2.2%)
Italian: 1,674 (2.1%)
Syrian: 1,365 (1.7%)
Pennsylvania German: 944 (1.2%)
English: 912 (1.1%)
Jamaican: 654 (0.8%)
Polish: 519 (0.6%)
Kenyan: 375 (0.5%)
European: 374 (0.5%)
Haitian: 329 (0.4%)
Hungarian: 245 (0.3%)
Eastern European: 244 (0.3%)
African: 215 (0.3%)
Dutch: 208 (0.3%)
Scottish: 197 (0.2%)
Slovak: 169 (0.2%)
Egyptian: 158 (0.2%)
Nigerian: 155 (0.2%)
Ukrainian: 155 (0.2%)
Russian: 134 (0.2%)
Austrian: 130 (0.2%)
Czechoslovakian: 100 (0.1%)
French: 86 (0.1%)
Brazilian: 79 (0.10%)
Lebanese: 75 (0.09%)
Swedish: 72 (0.09%)
Portuguese: 69 (0.09%)
Slavic: 65 (0.08%)
Jordanian: 63 (0.08%)
Guyanese: 54 (0.07%)
Ugandan: 53 (0.07%)
British: 52 (0.06%)
Moroccan: 50 (0.06%)
Serbian: 50 (0.06%)
Greek: 48 (0.06%)
Arab: 45 (0.06%)
Slovene: 44 (0.05%)
Barbadian: 44 (0.05%)
Turkish: 38 (0.05%)
U.S. Virgin Islander: 35 (0.04%)
Lithuanian: 34 (0.04%)
Welsh: 30 (0.04%)
Romanian: 28 (0.03%)
Swiss: 22 (0.03%)
Trinidadian and Tobagonian: 19 (0.02%)
Scotch-Irish: 17 (0.02%)
West Indian: 17 (0.02%)
Albanian: 15 (0.02%)
Iranian: 15 (0.02%)
Senegalese: 13 (0.02%)
Armenian: 11 (0.01%)
Belgian: 10 (0.01%)
Northern European: 10 (0.01%)
Latvian: 10 (0.01%)
Celtic: 5 (0.01%)
Most common places of birth for foreign-born residents (%): Dominican Republic Allentown:
60.4% (16,097)Pennsylvania:
9.2% (86,544)
Ecuador Allentown:
7.1% (1,899)Pennsylvania:
1.1% (10,035)
Mexico Allentown:
5.5% (1,459)Pennsylvania:
5.8% (54,190)
Syria Allentown:
3.9% (1,032)Pennsylvania:
0.5% (5,121)
Venezuela Allentown:
2.5% (660)Pennsylvania:
0.6% (5,742)
Jamaica Allentown:
2.4% (640)Pennsylvania:
2.4% (22,612)
Colombia Allentown:
2.4% (635)Pennsylvania:
1.5% (13,823)
Dominica Allentown:
2.3% (609)Pennsylvania:
0.3% (2,729)
Kenya Allentown:
2.1% (557)Pennsylvania:
0.5% (4,946)
India Allentown:
1.7% (449)Pennsylvania:
10.7% (100,596)
Korea Allentown:
1.7% (442)Pennsylvania:
2.9% (27,433)
Place of birth for U.S.-born residents:
This state: 52,739Other state: 23,988Northeast: 16,799Midwest: 965South: 5,547West: 677 90.6% of Allentown residents lived in the same house 1 years ago.
Out of people who lived in different houses, 37.7% lived in this county.
Out of people who lived in different counties, 77.5% lived in Pennsylvania.
Allentown:
90.6%State average:
89.3%
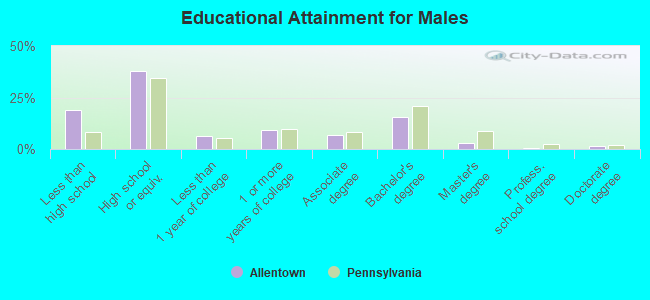
Education attainment for males 25 years and older:
No schooling: 1,058Nursery to 4th grade: 6565th and 6th grade: 1817th and 8th grade: 2,2189th grade: 94510th grade: 86511th grade: 45612th grade, no diploma: 1,674High school graduate (or equivalency): 16,005Less than 1 year of college: 2,725Some college more than 1 year, no degree: 3,924Associate degree: 2,890Bachelor's degree: 6,565Master's degree: 1,200Professional school degree: 153Doctorate degree: 679
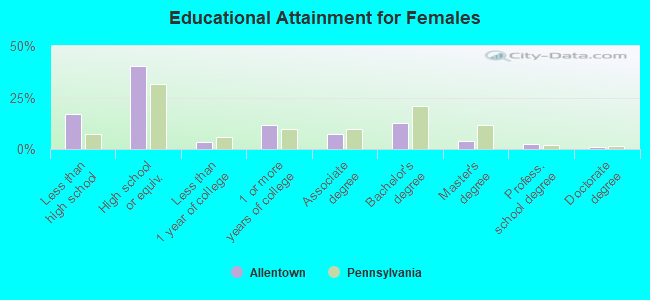
Education attainment for females 25 years and older:
No schooling: 1,033Nursery to 4th grade: 4375th and 6th grade: 2867th and 8th grade: 1,7099th grade: 22410th grade: 1,60111th grade: 57712th grade, no diploma: 1,058High school graduate (or equivalency): 16,255Less than 1 year of college: 1,465Some college more than 1 year, no degree: 4,623Associate degree: 2,993Bachelor's degree: 5,156Master's degree: 1,631Professional school degree: 1,040Doctorate degree: 400
Housing units in structures:
One, detached: 11,370One, attached: 18,030Two: 2,8473 or 4: 5,3795 to 9: 3,34910 to 19: 2,58520 to 49: 2,41450 or more: 3,528Mobile homes: 51Housing units lacking complete plumbing facilities in 2022: 1.9%Housing units lacking complete kitchen facilities in 2022: 1.3%House/condo owner moved in on average 13 years ago
Renter moved in on average 2 years ago
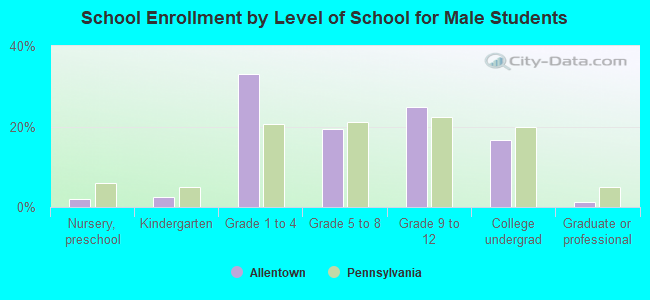
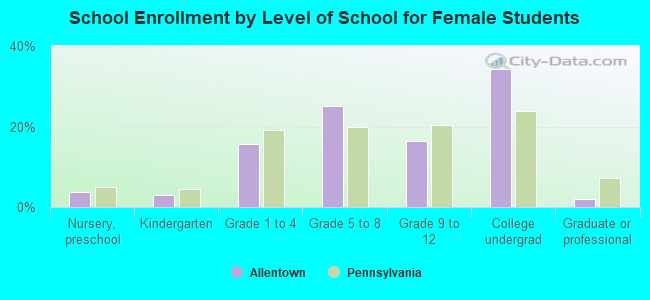
Private vs. public school enrollment:
Students in private schools in grades 1 to 8 (elementary and middle school): 699 Here:
5.3%Pennsylvania:
15.7%
Students in private schools in grades 9 to 12 (high school): 419 Here:
7.1%Pennsylvania:
13.4%
Students in private undergraduate colleges: 4,383 Here:
57.9%Pennsylvania:
39.8%