Housing density: 2,236 houses/condos per square mile
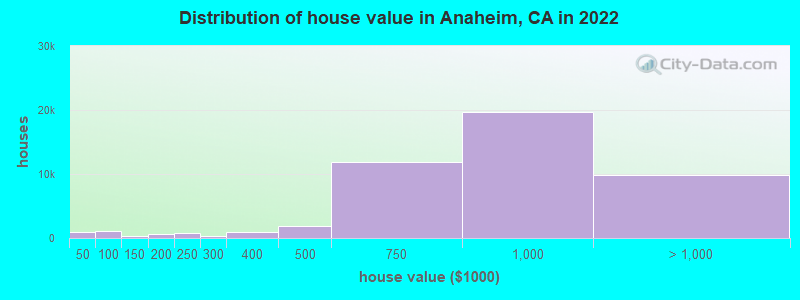
Median price asked for vacant for-sale houses and condos in 2022: $639,924.
Median contract rent in 2022: $1,813 (lower quartile is $1,472, upper quartile is over $2,000)
Median rent asked for vacant for-rent units in 2022: $1,483
Median gross rent in Anaheim, CA in 2022: $1,955
Housing units in Anaheim with a mortgage: 32,122 (2,157 second mortgage, 165 home equity loan, 1,624 both second mortgage and home equity loan) Houses without a mortgage: 666
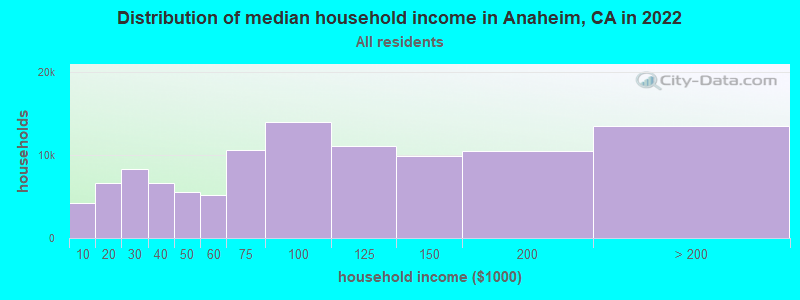
Median household income for houses/condos with a mortgage: $126,796
Median household income for apartments without a mortgage: $84,882
38,281 married couples with children.
23,172 single-parent households (7,588 men, 15,584 women).
38.1% of residents of Anaheim speak English at home.
42.0% of residents speak Spanish at home (60% speak English very well, 19% speak English well, 16% speak English not well, 5% don't speak English at all).
5.7% of residents speak other Indo-European language at home (65% speak English very well, 14% speak English well, 14% speak English not well, 7% don't speak English at all).
12.4% of residents speak Asian or Pacific Island language at home (49% speak English very well, 28% speak English well, 18% speak English not well, 5% don't speak English at all).
1.8% of residents speak other language at home (70% speak English very well, 24% speak English well, 5% speak English not well).
Foreign born population: 124,645 (36.2%)
(51.4% of them are naturalized citizens)
Percentage of workers working in this county: 86.1% Number of people working at home: 20,455 (11.6% of all workers)
Travel time to work (commute)
Less than 5 minutes: 2,282
5 to 9 minutes: 10,636
10 to 14 minutes: 18,993
15 to 19 minutes: 20,806
20 to 24 minutes: 25,377
25 to 29 minutes: 9,765
30 to 34 minutes: 28,470
35 to 39 minutes: 3,765
40 to 44 minutes: 6,575
45 to 59 minutes: 17,901
60 to 89 minutes: 7,980
90 or more minutes: 2,815
Means of transportation to work:
Drove a car alone: 132,177 (72.8%)
Carpooled: 19,086 (10.5%)
Bus: 3,402 (1.9%)
Long-distance train or commuter rail: 202 (0.1%)
Light rail, streetcar or trolley: 120 (0.1%)
Ferryboat: 43 (0.0%)
Taxi: 1,945 (1.1%)
Bicycle: 775 (0.4%)
Walked: 3,330 (1.8%)
Worked at home: 20,455 (11.3%)
Unemployment by race in 2022
Unemployment rate for White non-Hispanic residents
3.4%Males
4.7%Females
Unemployment rate for Black residents
11.0%Males
10.5%Females
Unemployment rate for American Indian and Alaska Native residents
3.6%Males
2.8%Females
Unemployment rate for Asian residents
3.9%Males
3.0%Females
Unemployment rate for other race residents
4.0%Males
2.5%Females
Unemployment rate for two or more race residents
3.3%Males
3.6%Females
Unemployment rate for Hispanic or Latino residents
3.4%Males
3.7%Females
Year of entry for the foreign-born population in Anaheim, California
19,6042010 or later
29,4862000 to 2009
30,7841990 to 1999
44,2451980 to 1989
19,4321970 to 1979
8,563Before 1970
First ancestries reported:
American: 26,394 (11.7%)
English: 4,154 (1.8%)
German: 4,086 (1.8%)
Iranian: 2,657 (1.2%)
Irish: 2,596 (1.2%)
Italian: 2,483 (1.1%)
European: 1,623 (0.7%)
Egyptian: 1,612 (0.7%)
Romanian: 784 (0.3%)
Polish: 784 (0.3%)
Palestinian: 689 (0.3%)
Jordanian: 688 (0.3%)
Norwegian: 569 (0.3%)
Greek: 550 (0.2%)
Afghan: 522 (0.2%)
Kenyan: 492 (0.2%)
Dutch: 491 (0.2%)
Swedish: 487 (0.2%)
African: 467 (0.2%)
Scottish: 429 (0.2%)
Armenian: 410 (0.2%)
Syrian: 381 (0.2%)
Lebanese: 371 (0.2%)
Arab: 349 (0.2%)
French: 342 (0.2%)
Nigerian: 310 (0.1%)
Ukrainian: 258 (0.1%)
Ethiopian: 257 (0.1%)
Russian: 218 (0.10%)
British: 175 (0.08%)
Croatian: 172 (0.08%)
Canadian: 160 (0.07%)
Assyrian: 159 (0.07%)
Eastern European: 151 (0.07%)
French Canadian: 140 (0.06%)
Portuguese: 129 (0.06%)
Scotch-Irish: 126 (0.06%)
Hungarian: 124 (0.06%)
Scandinavian: 121 (0.05%)
Danish: 118 (0.05%)
Iraqi: 117 (0.05%)
Yugoslavian: 116 (0.05%)
Guyanese: 106 (0.05%)
Albanian: 97 (0.04%)
Welsh: 94 (0.04%)
Swiss: 93 (0.04%)
Brazilian: 84 (0.04%)
Turkish: 66 (0.03%)
Somali: 62 (0.03%)
Lithuanian: 54 (0.02%)
Israeli: 51 (0.02%)
Finnish: 51 (0.02%)
Jamaican: 45 (0.02%)
Slovak: 42 (0.02%)
Northern European: 28 (0.01%)
Serbian: 21 (0.01%)
Latvian: 20 (0.01%)
Trinidadian and Tobagonian: 20 (0.01%)
Czechoslovakian: 16 (0.01%)
Austrian: 16 (0.01%)
Ghanaian: 14 (0.01%)
Most common places of birth for foreign-born residents (%):
Mexico
Anaheim:
47.1% (57,601)
California:
37.2% (3,881,193)
Vietnam
Anaheim:
12.0% (14,707)
California:
4.9% (512,335)
Philippines
Anaheim:
8.4% (10,223)
California:
7.8% (818,297)
Korea
Anaheim:
3.6% (4,448)
California:
3.0% (315,248)
India
Anaheim:
3.0% (3,695)
California:
5.2% (539,184)
Guatemala
Anaheim:
2.4% (2,965)
California:
2.8% (290,436)
El Salvador
Anaheim:
2.4% (2,885)
California:
4.2% (440,287)
Iran
Anaheim:
1.9% (2,342)
California:
2.0% (206,004)
Place of birth for U.S.-born residents:
This state: 185,271
Other state: 30,931
Northeast: 6,531
Midwest: 9,791
South: 7,445
West: 7,164
89.0% of Anaheim residents lived in the same house 1 years ago. Out of people who lived in different houses, 41.4% lived in this county. Out of people who lived in different counties, 81.0% lived in California.
Anaheim:
89.0%
State average:
88.9%
Education attainment for males 25 years and older:
No schooling: 6,859
Nursery to 4th grade: 2,267
5th and 6th grade: 4,641
7th and 8th grade: 1,968
9th grade: 2,416
10th grade: 859
11th grade: 1,502
12th grade, no diploma: 4,859
High school graduate (or equivalency): 27,056
Less than 1 year of college: 6,555
Some college more than 1 year, no degree: 14,275
Associate degree: 7,232
Bachelor's degree: 22,064
Master's degree: 6,086
Professional school degree: 2,039
Doctorate degree: 1,278
Education attainment for females 25 years and older:
No schooling: 7,001
Nursery to 4th grade: 2,567
5th and 6th grade: 6,142
7th and 8th grade: 1,981
9th grade: 2,032
10th grade: 1,253
11th grade: 2,812
12th grade, no diploma: 5,742
High school graduate (or equivalency): 21,772
Less than 1 year of college: 8,290
Some college more than 1 year, no degree: 16,595
Associate degree: 10,041
Bachelor's degree: 23,879
Master's degree: 6,855
Professional school degree: 2,494
Doctorate degree: 1,032
Housing units in structures:
One, detached: 44,043
One, attached: 10,050
Two: 1,356
3 or 4: 7,906
5 to 9: 9,860
10 to 19: 7,012
20 to 49: 5,977
50 or more: 19,964
Mobile homes: 2,896
Boats, RVs, vans, etc.: 395
Median worth of mobile homes: $210,300
Housing units lacking complete plumbing facilities in 2022: 1.1%
Housing units lacking complete kitchen facilities in 2022: 4.0%
House/condo owner moved in on average 13 years ago