Anderson, CA (California) Houses and Residents
| Anderson: | $269,442 |
| California: | $715,900 |
Mean price in 2022:
Detached houses: $319,865
Here: $319,865 State: $988,808 Townhouses or other attached units: $103,413
Here: $103,413 State: $838,546 Mobile homes: $16,998
Here: $16,998 State: $184,506
Total population: 10,209 (Urban population: 9,052, Rural population: 8 (all nonfarm))
Houses: 5,148 (4,860 occupied: 2,476 owner occupied, 2,361 renter occupied)
| % of renters here: | 49% |
| State: | 44% |
Housing density: 806 houses/condos per square mile
Median price asked for vacant for-sale houses and condos in 2022 in this county: $232,775.
Median contract rent in 2022: $743 (lower quartile is $516, upper quartile is $941)
Median rent asked for vacant for-rent units in 2022: $878
Median gross rent in Anderson, CA in 2022: $915
Housing units in Anderson with a mortgage: 1,765 (101 second mortgage, 0 home equity loan, 55 both second mortgage and home equity loan)
Houses without a mortgage: 14
Median household income for houses/condos with a mortgage: $86,571
Median household income for apartments without a mortgage: $29,331
Median monthly housing costs: $1,067
Compare current foreclosures near Anderson, CA:
| Photo | Address | Area | Beds / Baths | Price | Details |
|---|---|---|---|---|---|

|
#1
Sharon Ave
Anderson, CA 96007
|
1,162 sq. feet
|
2 baths 3 beds |
show details | |

|
#2
Franklin St
Anderson, CA 96007
|
1,086 sq. feet
|
2 baths 3 beds |
show details | |

|
#3
Lloyd Ln
Anderson, CA 96007
|
800 sq. feet
|
1 baths 2 beds |
show details | |

|
#4
Lodgepole Ave
Anderson, CA 96007
|
- sq. feet
|
2 baths 3 beds |
show details | |

|
#5
Balls Ferry Rd
Anderson, CA 96007
|
- sq. feet
|
2 baths 3 beds |
show details | |

|
#6
Pinon Ave
Anderson, CA 96007
|
- sq. feet
|
2 baths 3 beds |
show details | |

|
#7
Pinon Ave
Anderson, CA 96007
|
- sq. feet
|
2 baths 3 beds |
show details | |

|
#8
Southwood Dr
Anderson, CA 96007
|
- sq. feet
|
2 baths 3 beds |
show details | |

|
#9
Loren Ct
Anderson, CA 96007
|
- sq. feet
|
1 baths 2 beds |
show details | |

|
#10
Oak St
Anderson, CA 96007
|
- sq. feet
|
- baths - beds |
show details |
| Photo | Address | Area | Beds / Baths | Price | Details |
|---|---|---|---|---|---|

|
#11
Cloverdale Rd
Anderson, CA 96007
|
- sq. feet
|
- baths - beds |
show details | |

|
#12
State Highway 273, Unit 322
Anderson, CA 96007
|
- sq. feet
|
- baths - beds |
show details | |

|
#13
Loop St
Anderson, CA 96007
|
- sq. feet
|
- baths - beds |
show details | |

|
#14
Oasis Rd
Redding, CA 96003
|
1,233 sq. feet
|
2 baths 3 beds |
$109,900
|
show details |

|
#15
River Valley Dr Spc 17
Anderson, CA 96007
|
- sq. feet
|
- baths - beds |
show details | |

|
#16
Barney Rd
Anderson, CA 96007
|
- sq. feet
|
- baths - beds |
show details | |

|
#17
Warwick Pl
Anderson, CA 96007
|
- sq. feet
|
- baths - beds |
show details | |

|
#18
Hooker Creek Rd
Cottonwood, CA 96022
|
1,782 sq. feet
|
2 baths 3 beds |
show details | |

|
#19
Leonard Dr
Redding, CA 96001
|
1,550 sq. feet
|
2 baths 3 beds |
show details | |

|
#20
Bowman Rd
Cottonwood, CA 96022
|
1,500 sq. feet
|
2 baths 3 beds |
show details |
| Photo | Address | Area | Beds / Baths | Price | Details |
|---|---|---|---|---|---|

|
#21
Deer Creek Rd
Shasta Lake, CA 96019
|
- sq. feet
|
2 baths 2 beds |
show details | |

|
#22
Big Horn Dr
Redding, CA 96002
|
2,539 sq. feet
|
3 baths 4 beds |
show details | |

|
#23
Jaxon Way
Redding, CA 96003
|
1,400 sq. feet
|
2 baths 3 beds |
show details | |

|
#24
Hunting Club Rd
Palo Cedro, CA 96073
|
- sq. feet
|
3 baths 3 beds |
show details | |

|
#25
Mccann Rd
Cottonwood, CA 96022
|
1,482 sq. feet
|
2 baths 3 beds |
show details | |

|
#26
Hartnell Ave
Redding, CA 96002
|
- sq. feet
|
1 baths 3 beds |
show details | |

|
#27
Regal Ave
Redding, CA 96002
|
1,305 sq. feet
|
1 baths 3 beds |
show details | |

|
#28
La Mesa Ave
Shasta Lake, CA 96019
|
- sq. feet
|
2 baths 3 beds |
show details | |

|
#29
Zapatero Ln
Cottonwood, CA 96022
|
2,050 sq. feet
|
2 baths 3 beds |
show details | |

|
#30
Newport Dr
Redding, CA 96001
|
- sq. feet
|
2 baths 3 beds |
show details |
| Photo | Address | Area | Beds / Baths | Price | Details |
|---|---|---|---|---|---|

|
#31
Benson Rd
Cottonwood, CA 96022
|
1,890 sq. feet
|
2 baths 4 beds |
show details | |

|
#32
Antler Way
Cottonwood, CA 96022
|
1,516 sq. feet
|
2 baths 3 beds |
show details | |

|
#33
Chico St
Shasta Lake, CA 96019
|
- sq. feet
|
2 baths 3 beds |
show details | |

|
#34
Bowman Rd
Cottonwood, CA 96022
|
1,943 sq. feet
|
1 baths 2 beds |
show details | |

|
#35
Melody Ln
Redding, CA 96001
|
- sq. feet
|
2 baths 3 beds |
show details | |

|
#36
Broadhurst Rd
Cottonwood, CA 96022
|
1,196 sq. feet
|
2 baths 3 beds |
show details | |

|
#37
Alamine Dr
Redding, CA 96003
|
- sq. feet
|
2 baths 4 beds |
show details | |

|
#38
Wales Ct
Redding, CA 96003
|
- sq. feet
|
2 baths 3 beds |
show details | |

|
#39
Ridge Rd
Redding, CA 96003
|
- sq. feet
|
2 baths 3 beds |
show details | |

|
#40
Ironwood Ln
Redding, CA 96003
|
- sq. feet
|
2 baths 3 beds |
show details |
| Photo | Address | Area | Beds / Baths | Price | Details |
|---|---|---|---|---|---|

|
#41
Snow Ln
Redding, CA 96003
|
- sq. feet
|
2 baths 3 beds |
show details | |

|
#42
Stetson Way
Redding, CA 96003
|
- sq. feet
|
2 baths 3 beds |
show details | |

|
#43
Del Mar Ave
Redding, CA 96003
|
- sq. feet
|
2 baths 2 beds |
show details | |

|
#44
Tralee Ln
Redding, CA 96001
|
- sq. feet
|
2 baths 3 beds |
show details | |

|
#45
Hidden Hills Rd
Cottonwood, CA 96022
|
- sq. feet
|
2 baths 3 beds |
show details | |

|
#46
Doral Trl
Redding, CA 96003
|
- sq. feet
|
2 baths 2 beds |
show details | |

|
#47
Tanglewood Dr
Redding, CA 96003
|
- sq. feet
|
3 baths 3 beds |
show details | |

|
#48
Glendive Ln
Redding, CA 96001
|
- sq. feet
|
3 baths 3 beds |
show details | |

|
#49
Merle Dr
Redding, CA 96001
|
- sq. feet
|
2 baths 3 beds |
show details | |

|
Check over 1 million property listings on Foreclosure.com!
|
browse all offers | |||

Latest news about housing in Anderson, CA collected exclusively by city-data.com from local newspapers, TV, and radio stations

 | The Los Angeles Homeless Containment Thread (9136 replies) |
| It's official : Homeless housing will cost $350,000 PER unit (157 replies) |
| SF could be in for a big 'doom loop' (349 replies) |
| San Joaquin Valley Gentrification thread(Fresno, Merced, Stockton, Bakersfield) (351 replies) |
| Slab leak? (46 replies) |
| Lmao, anyone else frustrated with the housing market? (161 replies) |

Median year apartment built: 1980
Household type by relationship:
Households: 11,209- Male householders: 2,302 (955 living alone), Female householders: 2,504 (871 living alone)
1,748 spouses (1,740 opposite-sex spouses), 281 unmarried partners, (272 opposite-sex unmarried partners), 3,221 children (3,062 natural, 23 adopted, 135 stepchildren), 126 grandchildren, 84 brothers or sisters, 220 parents, 222 foster children, 175 other relatives, 282 non-relatives
- In group quarters: 39
Size of family households: 1,057 2-persons, 605 3-persons, 359 4-persons, 229 5-persons, 55 6-persons, 148 7-or-more-persons.
Size of nonfamily households: 2,032 1-person, 398 2-persons, 38 3-persons, 13 5-persons.
1,395 married couples with children.
1,171 single-parent households (285 men, 886 women).
92.0% of residents of Anderson speak English at home.
5.0% of residents speak Spanish at home (76% speak English very well, 22% speak English well, 2% speak English not well).
0.8% of residents speak other Indo-European language at home (100% speak English very well).
1.2% of residents speak Asian or Pacific Island language at home (10% speak English very well, 56% speak English well, 34% speak English not well).
0.3% of residents speak other language at home (48% speak English very well, 52% speak English not well).
Foreign born population: 521 (4.6%)
(65.1% of them are naturalized citizens)
| Here: | 5.5 |
| State: | 6.0 |
| Here: | 4.1 |
| State: | 3.9 |

- Bedrooms in owner-occupied houses and condos in Anderson, California
- 43no bedroom
- 51 bedroom
- 5802 bedrooms
- 1,5823 bedrooms
- 2234 bedrooms
- 435+ bedrooms

- Bedrooms in renter-occupied apartments in Anderson, California
- 16no bedroom
- 6591 bedroom
- 9002 bedrooms
- 6873 bedrooms
- 844 bedrooms
- 155+ bedrooms

- Cars and other vehicles available in Anderson in owner-occupied houses/condos
- 37no vehicle
- 7791 vehicle
- 9912 vehicles
- 4573 vehicles
- 1294 vehicles
- 835+ vehicles

- Cars and other vehicles available in Anderson in renter-occupied apartments
- 432no vehicle
- 1,1831 vehicle
- 4202 vehicles
- 2483 vehicles
- 134 vehicles
- 665+ vehicles

- Rooms in owner-occupied houses in Anderson, California
- 141 room
- 292 rooms
- 553 rooms
- 3724 rooms
- 7645 rooms
- 7416 rooms
- 2627 rooms
- 1658 rooms
- 749+ rooms

- Rooms in renter-occupied apartments in Anderson, California
- 161 room
- 1262 rooms
- 5203 rooms
- 7694 rooms
- 4835 rooms
- 2706 rooms
- 1367 rooms
- 178 rooms
- 249+ rooms


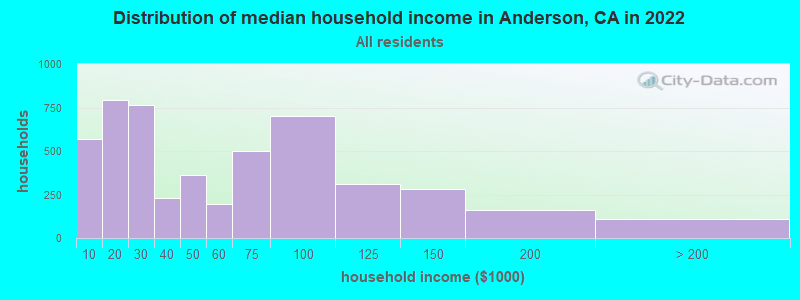
Anderson, CA household income distribution

- 567Less than $10,000
- 791$10,000 to $19,999
- 763$20,000 to $29,999
- 232$30,000 to $39,999
- 364$40,000 to $49,999
- 194$50,000 to $59,999
- 499$60,000 to $74,999
- 700$75,000 to $99,999
- 308$100,000 to $124,999
- 280$125,000 to $149,999
- 161$150,000 to $199,999
- 107$200,000 or more
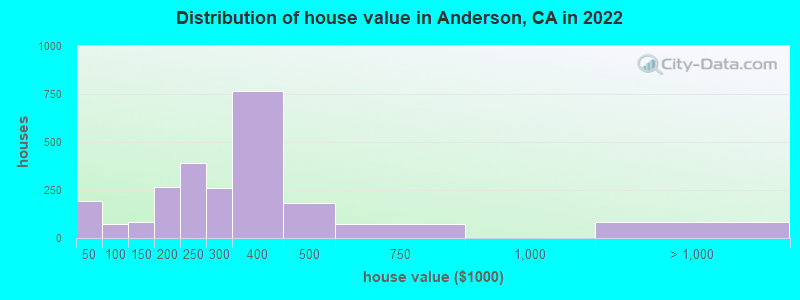
Home value of owner - occupied houses in 2022 in Anderson, CA
-
- 138Less than $10,000
- 27$10,000 to $14,999
- 10$15,000 to $19,999
- 15$40,000 to $49,999
- 3$50,000 to $59,999
- 54$90,000 to $99,999
- 84$125,000 to $149,999
- 134$150,000 to $174,999
- 132$175,000 to $199,999
- 391$200,000 to $249,999
- 259$250,000 to $299,999
- 766$300,000 to $399,999
- 183$400,000 to $499,999
- 71$500,000 to $749,999
- 24$1,000,000 to $1,499,999
- 58$2,000,000 or more
Rent paid by renters in 2022 in Anderson, CA
-
- 154Less than $100
- 10$150 to $199
- 74$200 to $249
- 35$250 to $299
- 75$300 to $349
- 54$350 to $399
- 113$400 to $449
- 23$450 to $499
- 35$500 to $549
- 4$550 to $599
- 226$600 to $649
- 108$650 to $699
- 195$700 to $749
- 154$750 to $799
- 283$800 to $899
- 179$900 to $999
- 380$1,000 to $1,249
- 161$1,250 to $1,499
- 63$1,500 to $1,999
- 84No cash rent

Percentage of workers working in this county: 89.2%
Number of people working at home: 399 (8.5% of all workers)
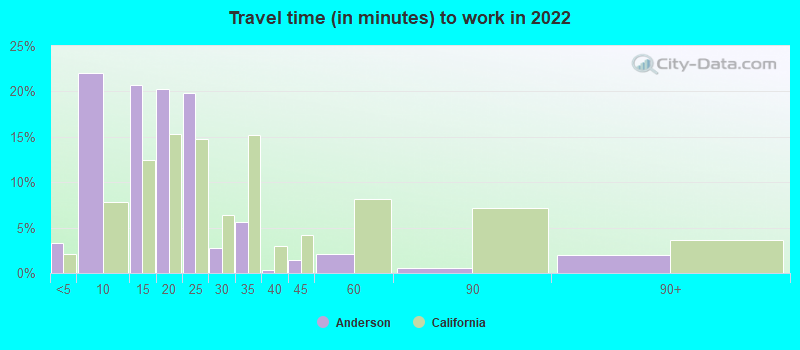
Travel time to work (commute)
- Less than 5 minutes: 194
- 5 to 9 minutes: 918
- 10 to 14 minutes: 700
- 15 to 19 minutes: 800
- 20 to 24 minutes: 1,075
- 25 to 29 minutes: 321
- 30 to 34 minutes: 171
- 35 to 39 minutes: 0
- 40 to 44 minutes: 45
- 45 to 59 minutes: 17
- 60 to 89 minutes: 124
- 90 or more minutes: 29
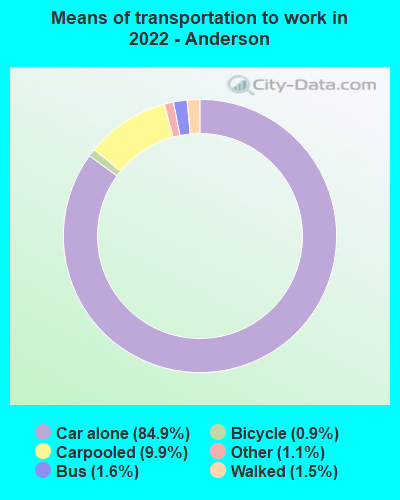
Means of transportation to work:
- Drove a car alone: 3,037 (75.9%)
- Carpooled: 407 (10.2%)
- Bus: 90 (2.2%)
- Taxi: 35 (0.9%)
- Bicycle: 35 (0.9%)
- Walked: 40 (1.0%)
- Worked at home: 399 (10.0%)
- Unemployment by race in 2022
- Unemployment rate for White non-Hispanic residents
- 2.2%Males
- 3.9%Females
- Unemployment rate for two or more race residents
- 2.4%Females
- Unemployment rate for Hispanic or Latino residents
- 8.1%Males

- Year of entry for the foreign-born population in Anderson, California
- 612010 or later
- 1012000 to 2009
- 1641990 to 1999
- 1261980 to 1989
- 571970 to 1979
- 113Before 1970

First ancestries reported:
- American: 881 (17.7%)
- European: 557 (11.2%)
- English: 357 (7.2%)
- Irish: 328 (6.6%)
- Italian: 253 (5.1%)
- German: 223 (4.5%)
- Welsh: 114 (2.3%)
- Norwegian: 57 (1.1%)
- Portuguese: 47 (0.9%)
- Scandinavian: 46 (0.9%)
- Scottish: 32 (0.6%)
- Swedish: 28 (0.6%)
- Czech: 20 (0.4%)
- British: 18 (0.4%)
- Greek: 18 (0.4%)
- Lebanese: 15 (0.3%)
- Pennsylvania German: 13 (0.3%)
- Polish: 13 (0.3%)
- French Canadian: 12 (0.2%)
- Eastern European: 10 (0.2%)
- Finnish: 8 (0.2%)
- Dutch: 7 (0.1%)
- Scotch-Irish: 6 (0.1%)
Most common places of birth for foreign-born residents (%):
| Anderson: | 35.9% (213) |
| California: | 37.2% (3,881,193) |
| Anderson: | 18.4% (109) |
| California: | 5.2% (539,184) |
| Anderson: | 8.9% (53) |
| California: | 0.5% (48,911) |
| Anderson: | 7.1% (42) |
| California: | 4.9% (512,335) |
| Anderson: | 5.6% (33) |
| California: | 0.2% (17,937) |
| Anderson: | 5.4% (32) |
| California: | 0.4% (40,941) |
| Anderson: | 5.1% (30) |
| California: | 7.8% (818,297) |
| Anderson: | 4.2% (25) |
| California: | 4.2% (440,287) |
| Anderson: | 2.9% (17) |
| California: | 0.0% (3,349) |
| Anderson: | 2.0% (12) |
| California: | 6.6% (684,672) |
| Anderson: | 1.9% (11) |
| California: | 3.0% (315,248) |
| Anderson: | 1.5% (9) |
| California: | 0.1% (9,241) |
Place of birth for U.S.-born residents:
- This state: 8,340
- Other state: 2,223
- Northeast: 270
- Midwest: 644
- South: 364
- West: 934
88.4% of Anderson residents lived in the same house 1 years ago.
Out of people who lived in different houses, 44.4% lived in this county.
Out of people who lived in different counties, 45.2% lived in California.
| Anderson: | 88.4% |
| State average: | 88.9% |
Education attainment for males 25 years and older:
- No schooling: 159
- Nursery to 4th grade: 0
- 5th and 6th grade: 19
- 7th and 8th grade: 17
- 9th grade: 25
- 10th grade: 127
- 11th grade: 136
- 12th grade, no diploma: 106
- High school graduate (or equivalency): 1,278
- Less than 1 year of college: 241
- Some college more than 1 year, no degree: 933
- Associate degree: 271
- Bachelor's degree: 490
- Master's degree: 12
- Professional school degree: 15
- Doctorate degree: 1

Education attainment for females 25 years and older:
- No schooling: 182
- Nursery to 4th grade: 0
- 5th and 6th grade: 0
- 7th and 8th grade: 19
- 9th grade: 39
- 10th grade: 88
- 11th grade: 52
- 12th grade, no diploma: 56
- High school graduate (or equivalency): 1,205
- Less than 1 year of college: 447
- Some college more than 1 year, no degree: 890
- Associate degree: 435
- Bachelor's degree: 370
- Master's degree: 95
- Professional school degree: 31
- Doctorate degree: 0


Housing units in structures:
- One, detached: 3,268
- One, attached: 200
- Two: 101
- 3 or 4: 396
- 5 to 9: 532
- 10 to 19: 173
- 20 to 49: 153
- 50 or more: 221
- Mobile homes: 100
Median worth of mobile homes: $17,560
Housing units lacking complete kitchen facilities in 2022: 0.9%
House/condo owner moved in on average 9 years ago
Renter moved in on average 5 years ago

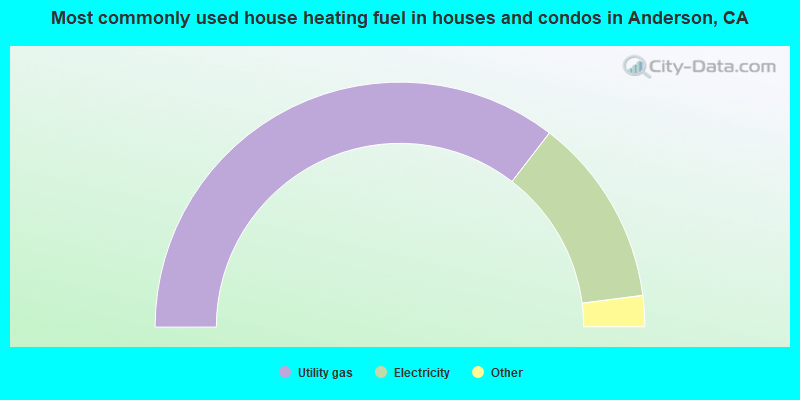
- 70.9%Utility gas
- 25.0%Electricity
- 2.7%Wood
- 0.9%Solar energy
- 0.4%Other fuel
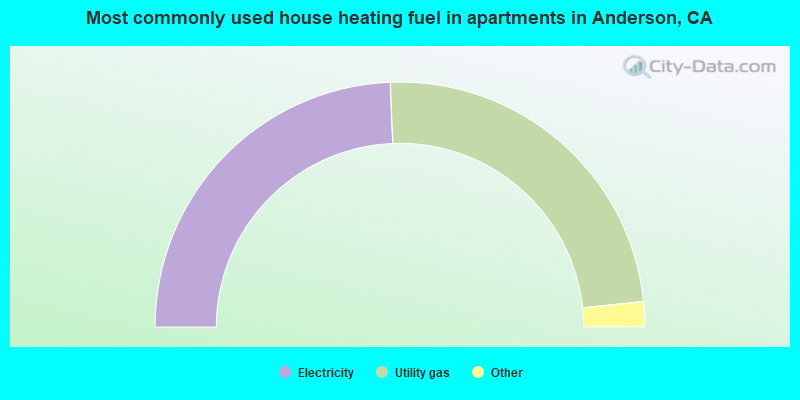
- 48.8%Electricity
- 48.0%Utility gas
- 2.0%Wood
- 0.9%Bottled, tank, or LP gas
- 0.3%Fuel oil, kerosene, etc.
Private vs. public school enrollment:
| Here: | 11.9% |
| California: | 10.5% |
| Here: | 2.2% |
| California: | 8.5% |
| Here: | 14.6% |
| California: | 15.9% |