Andover, IL (Illinois) Houses and Residents
| Andover: | $140,164 |
| Illinois: | $251,600 |
Mean price in 2022:
Detached houses: $136,820
Here: $136,820 State: $310,164
Total population: 574 (Urban population: 0, Rural population: 594 (11 farm, 583 nonfarm))
Houses: 189 (189 occupied: 159 owner occupied, 32 renter occupied)
| % of renters here: | 17% |
| State: | 33% |
Housing density: 189 houses/condos per square mile
Median price asked for vacant for-sale houses and condos in 2022 in this county: $76,206.
Median contract rent in 2022: $606 (lower quartile is $552, upper quartile is $865)
Median gross rent in Andover, IL in 2022: $818
Housing units in Andover with a mortgage: 96 (6 second mortgage, 0 home equity loan, 5 both second mortgage and home equity loan)
Houses without a mortgage: 4
Median household income for houses/condos with a mortgage: $77,247
Median monthly housing costs: $779
Compare current foreclosures near Andover, IL:
| Photo | Address | Area | Beds / Baths | Price | Details |
|---|---|---|---|---|---|

|
#1
9th Ave N
East Moline, IL 61244
|
1,492 sq. feet
|
1 baths 3 beds |
$235,000
|
show details |

|
#2
114th Ave
Milan, IL 61264
|
- sq. feet
|
1 baths 2 beds |
$59,900
|
show details |

|
#3
163rd St N
East Moline, IL 61244
|
- sq. feet
|
1 baths 2 beds |
$46,800
|
show details |

|
#4
14th Ave
Silvis, IL 61282
|
858 sq. feet
|
1 baths 3 beds |
show details | |

|
#5
50th Ave
Moline, IL 61265
|
- sq. feet
|
1 baths 3 beds |
show details | |

|
#6
4th Street A
East Moline, IL 61244
|
1,640 sq. feet
|
2 baths 3 beds |
show details | |

|
#7
Us Highway 150
Orion, IL 61273
|
600 sq. feet
|
1 baths 2 beds |
show details | |

|
#8
N College Ave
Geneseo, IL 61254
|
1,584 sq. feet
|
2 baths 3 beds |
show details | |

|
#9
Cypress Dr
Colona, IL 61241
|
1,396 sq. feet
|
1 baths 3 beds |
show details | |

|
#10
Rustic Lake Dr
Colona, IL 61241
|
2,860 sq. feet
|
1 baths 4 beds |
show details |
| Photo | Address | Area | Beds / Baths | Price | Details |
|---|---|---|---|---|---|

|
#11
Goldfinch Ct
Geneseo, IL 61254
|
3,240 sq. feet
|
1 baths 5 beds |
show details | |

|
#12
Hilltop St
Colona, IL 61241
|
2,551 sq. feet
|
1 baths 4 beds |
show details | |

|
#13
Cleveland Rd
Colona, IL 61241
|
912 sq. feet
|
1 baths 2 beds |
show details | |

|
#14
N West St
Cambridge, IL 61238
|
1,868 sq. feet
|
1 baths 3 beds |
show details | |

|
#15
4th St
Colona, IL 61241
|
768 sq. feet
|
- baths 2 beds |
show details | |

|
#16
Meadow Ln
Colona, IL 61241
|
1,392 sq. feet
|
1 baths 3 beds |
show details | |

|
#17
S Center St
Geneseo, IL 61254
|
1,159 sq. feet
|
1 baths 4 beds |
show details | |

|
#18
Us Highway 150
Alpha, IL 61413
|
1,288 sq. feet
|
1 baths 3 beds |
show details | |

|
#19
Talbot Rd
Geneseo, IL 61254
|
1,520 sq. feet
|
1 baths 2 beds |
show details | |

|
#20
Lake Lynnwood
Lynn Center, IL 61262
|
3,256 sq. feet
|
1 baths 4 beds |
show details |
| Photo | Address | Area | Beds / Baths | Price | Details |
|---|---|---|---|---|---|

|
#21
Elk St
Cambridge, IL 61238
|
1,296 sq. feet
|
1 baths 3 beds |
show details | |

|
#22
N West St
Cambridge, IL 61238
|
953 sq. feet
|
1 baths 2 beds |
show details | |

|
#23
4th St
East Moline, IL 61244
|
1,944 sq. feet
|
- baths - beds |
show details | |

|
#24
4th St
Carbon Cliff, IL 61239
|
912 sq. feet
|
- baths - beds |
show details | |

|
#25
4th Ave
Silvis, IL 61282
|
- sq. feet
|
- baths - beds |
show details | |

|
#26
4th Ave
Silvis, IL 61282
|
- sq. feet
|
- baths - beds |
show details | |

|
#27
110th Ave
Milan, IL 61264
|
- sq. feet
|
- baths - beds |
show details | |

|
#28
39th Ave
East Moline, IL 61244
|
- sq. feet
|
- baths - beds |
show details | |

|
#29
40th St
Moline, IL 61265
|
- sq. feet
|
- baths - beds |
show details | |

|
#30
47th St
Moline, IL 61265
|
- sq. feet
|
- baths - beds |
show details |
| Photo | Address | Area | Beds / Baths | Price | Details |
|---|---|---|---|---|---|

|
#31
13th St
Silvis, IL 61282
|
- sq. feet
|
- baths - beds |
show details | |

|
#32
14th St
Moline, IL 61265
|
- sq. feet
|
- baths - beds |
show details | |

|
#33
Coyne Center Rd Lot 164
Milan, IL 61264
|
- sq. feet
|
- baths - beds |
show details | |

|
#34
38th Ave
Moline, IL 61265
|
- sq. feet
|
- baths - beds |
show details | |

|
#35
10th St
East Moline, IL 61244
|
- sq. feet
|
- baths - beds |
show details | |

|
#36
36 1/2 Ave
East Moline, IL 61244
|
- sq. feet
|
- baths - beds |
show details | |

|
#37
15th St # B
Moline, IL 61265
|
- sq. feet
|
- baths - beds |
show details | |

|
#38
15th St
Moline, IL 61265
|
- sq. feet
|
- baths - beds |
show details | |

|
#39
10th Street Pl
East Moline, IL 61244
|
- sq. feet
|
- baths - beds |
show details | |

|
#40
18th St
East Moline, IL 61244
|
- sq. feet
|
- baths - beds |
show details |
| Photo | Address | Area | Beds / Baths | Price | Details |
|---|---|---|---|---|---|

|
#41
6th Ave
East Moline, IL 61244
|
- sq. feet
|
- baths - beds |
show details | |

|
#42
32nd St
Moline, IL 61265
|
- sq. feet
|
- baths - beds |
show details | |

|
#43
11th Avenue B
Moline, IL 61265
|
- sq. feet
|
- baths - beds |
show details | |

|
#44
38th Avenue Dr
Moline, IL 61265
|
- sq. feet
|
- baths - beds |
show details | |

|
#45
25th Ave
East Moline, IL 61244
|
- sq. feet
|
- baths - beds |
show details | |

|
#46
45th St
Moline, IL 61265
|
- sq. feet
|
- baths - beds |
show details | |

|
#47
W Center St
Cambridge, IL 61238
|
- sq. feet
|
- baths - beds |
show details | |

|
#48
36th Ave
Moline, IL 61265
|
- sq. feet
|
- baths - beds |
show details | |

|
#49
1st Ave N
Hillsdale, IL 61257
|
- sq. feet
|
- baths - beds |
show details | |

|
Check over 1 million property listings on Foreclosure.com!
|
browse all offers | |||

Latest news about housing in Andover, IL collected exclusively by city-data.com from local newspapers, TV, and radio stations

 | Why are homes so overpriced in the Chicago suburbs? (41 replies) |
| Moving to IL - is there any future? (202 replies) |
| Desperately seeking Good high schools near the South Suburbs. (15 replies) |
| Bannockburn - help please (2 replies) |
| Public Middle/High Schools in North/Northwest Suburbs (32 replies) |
| Comparable town Chicago - Boston - NY (14 replies) |

Median year apartment built: 1956
Household type by relationship:
Households: 428- Male householders: 97 (32 living alone), Female householders: 88 (31 living alone)
105 spouses (105 opposite-sex spouses), 5 unmarried partners, (5 opposite-sex unmarried partners), 115 children (107 natural, 2 adopted, 4 stepchildren), 0 grandchildren, 4 brothers or sisters, 3 parents, 5 foster children, 0 other relatives, 0 non-relatives
Size of family households: 64 2-persons, 17 3-persons, 30 4-persons, 5 5-persons.
Size of nonfamily households: 67 1-person, 7 2-persons.
80 married couples with children.
8 single-parent households (7 men, 1 women).
96.9% of residents of Andover speak English at home.
2.6% of residents speak Spanish at home (55% speak English very well, 45% speak English well).
Foreign born population: 5 (1.2%)
(60.0% of them are naturalized citizens)
| Here: | 6.2 |
| State: | 6.4 |
| Here: | 5.0 |
| State: | 4.1 |

- Bedrooms in owner-occupied houses and condos in Andover, Illinois
- 0no bedroom
- 01 bedroom
- 412 bedrooms
- 973 bedrooms
- 224 bedrooms
- 05+ bedrooms

- Bedrooms in renter-occupied apartments in Andover, Illinois
- 0no bedroom
- 51 bedroom
- 162 bedrooms
- 03 bedrooms
- 114 bedrooms
- 05+ bedrooms

- Cars and other vehicles available in Andover in owner-occupied houses/condos
- 6no vehicle
- 301 vehicle
- 602 vehicles
- 493 vehicles
- 94 vehicles
- 65+ vehicles

- Cars and other vehicles available in Andover in renter-occupied apartments
- 0no vehicle
- 171 vehicle
- 72 vehicles
- 83 vehicles
- 04 vehicles
- 05+ vehicles

- Rooms in owner-occupied houses in Andover, Illinois
- 01 room
- 02 rooms
- 03 rooms
- 14 rooms
- 515 rooms
- 386 rooms
- 417 rooms
- 148 rooms
- 159+ rooms

- Rooms in renter-occupied apartments in Andover, Illinois
- 01 room
- 02 rooms
- 03 rooms
- 74 rooms
- 145 rooms
- 06 rooms
- 07 rooms
- 118 rooms
- 09+ rooms


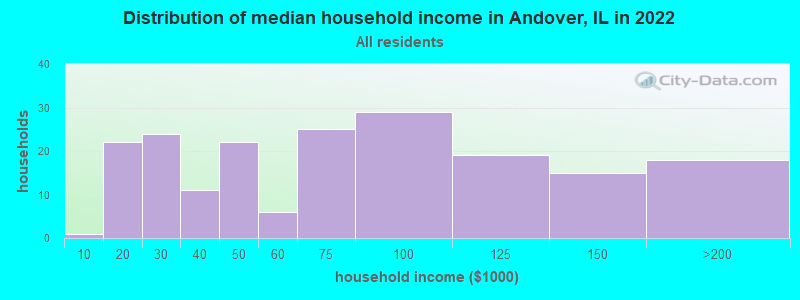
Andover, IL household income distribution

- 1Less than $10,000
- 22$10,000 to $19,999
- 24$20,000 to $29,999
- 11$30,000 to $39,999
- 22$40,000 to $49,999
- 6$50,000 to $59,999
- 25$60,000 to $74,999
- 29$75,000 to $99,999
- 19$100,000 to $124,999
- 15$125,000 to $149,999
- 18$150,000 to $199,999
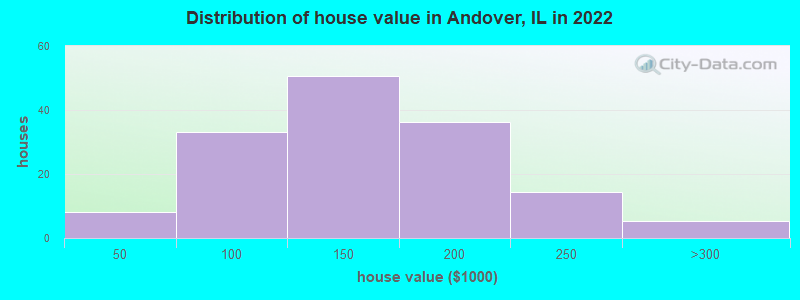
Home value of owner - occupied houses in 2022 in Andover, IL
-
- 8$35,000 to $39,999
- 3$50,000 to $59,999
- 3$70,000 to $79,999
- 14$80,000 to $89,999
- 12$90,000 to $99,999
- 22$100,000 to $124,999
- 28$125,000 to $149,999
- 22$150,000 to $174,999
- 14$175,000 to $199,999
- 14$200,000 to $249,999
- 5$250,000 to $299,999
Rent paid by renters in 2022 in Andover, IL
-
- 5$150 to $199
- 2$500 to $549
- 4$550 to $599
- 9$600 to $649
- 3$800 to $899
- 7$1,000 to $1,249


Percentage of workers working in this county: 27.8%
Number of people working at home: 9 (4.4% of all workers)
Travel time to work (commute)
- Less than 5 minutes: 5
- 5 to 9 minutes: 1
- 10 to 14 minutes: 9
- 15 to 19 minutes: 8
- 20 to 24 minutes: 22
- 25 to 29 minutes: 48
- 30 to 34 minutes: 56
- 35 to 39 minutes: 17
- 40 to 44 minutes: 8
- 45 to 59 minutes: 6
- 60 to 89 minutes: 5
- 90 or more minutes: 0
Means of transportation to work:
- Drove a car alone: 253 (85.5%)
- Carpooled: 27 (9.1%)
- Motorcycle: 2 (0.7%)
- Bicycle: 3 (1.0%)
- Walked: 3 (1.0%)
- Other means: 1 (0.3%)
- Worked at home: 7 (2.4%)

- Unemployment by race in 2022
- Unemployment rate for White non-Hispanic residents
- 4.8%Males

- Year of entry for the foreign-born population in Andover, Illinois
- 02010 or later
- 52000 to 2009
- 01990 to 1999
- 01980 to 1989
- 31970 to 1979
- 0Before 1970

First ancestries reported:
- Welsh: 28 (24.1%)
- Swedish: 18 (15.5%)
- German: 16 (13.8%)
- Irish: 14 (12.1%)
- English: 9 (7.8%)
- French: 3 (2.6%)
- Polish: 3 (2.6%)
- Belgian: 2 (1.7%)
- American: 1 (0.9%)
- Dutch: 1 (0.9%)
Most common places of birth for foreign-born residents (%):
| Andover: | 80.0% (4) |
| Illinois: | 34.7% (626,958) |
Place of birth for U.S.-born residents:
- This state: 339
- Other state: 82
- Northeast: 7
- Midwest: 29
- South: 30
- West: 15
96.3% of Andover residents lived in the same house 1 years ago.
Out of people who lived in different houses, 27.3% lived in this county.
Out of people who lived in different counties, 60.0% lived in Illinois.
| Andover: | 96.3% |
| State average: | 88.3% |
Education attainment for males 25 years and older:
- No schooling: 0
- Nursery to 4th grade: 0
- 5th and 6th grade: 0
- 7th and 8th grade: 7
- 9th grade: 6
- 10th grade: 0
- 11th grade: 0
- 12th grade, no diploma: 0
- High school graduate (or equivalency): 71
- Less than 1 year of college: 10
- Some college more than 1 year, no degree: 24
- Associate degree: 14
- Bachelor's degree: 22
- Master's degree: 0
- Professional school degree: 0
- Doctorate degree: 0

Education attainment for females 25 years and older:
- No schooling: 0
- Nursery to 4th grade: 0
- 5th and 6th grade: 0
- 7th and 8th grade: 0
- 9th grade: 2
- 10th grade: 0
- 11th grade: 0
- 12th grade, no diploma: 0
- High school graduate (or equivalency): 66
- Less than 1 year of college: 0
- Some college more than 1 year, no degree: 22
- Associate degree: 27
- Bachelor's degree: 26
- Master's degree: 12
- Professional school degree: 0
- Doctorate degree: 0


Housing units in structures:
- One, detached: 187
- Two: 2
House/condo owner moved in on average 19 years ago
Renter moved in on average 3 years ago

Private vs. public school enrollment:
| Here: | 10.3% |
| Illinois: | 13.3% |
| Here: | 0.0% |
| Illinois: | 9.9% |
| Here: | 0.0% |
| Illinois: | 27.4% |


