Ann Arbor, MI (Michigan) Houses and Residents
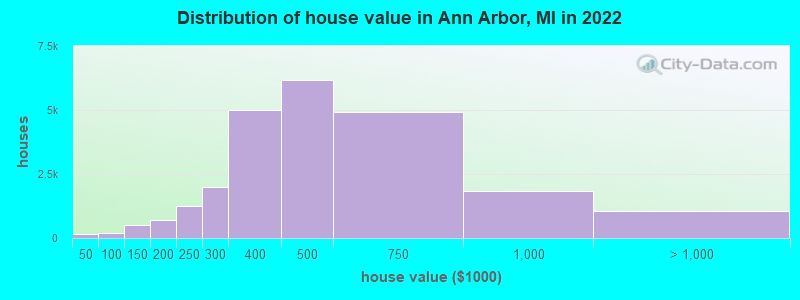
Estimated median house or condo value in 2022: $435,000 (it was $178,500 in 2000 )
Ann Arbor:
$435,000Michigan:
$224,400
Lower value quartile - upper value quartile: $322,000 - $580,300Mean price in 2022: Detached houses: $552,724 Here:
$552,724State:
$280,038
Townhouses or other attached units: $344,372 Here:
$344,372State:
$239,520
In 2-unit structures: $364,735 Here:
$364,735State:
$219,481
In 3-to-4-unit structures: $346,994 Here:
$346,994State:
$207,067
In 5-or-more-unit structures: $397,890 Here:
$397,890State:
$192,733
Mobile homes: $25,444 Here:
$25,444State:
$72,868
Total population: 117,770 (Urban population: 114,110, Rural population: 0)
Houses: 53,113 (49,337 occupied: 21,132 owner occupied, 28,205 renter occupied )
% of renters here:
57%State:
27%
Housing density: 1,966 houses/condos per square mile
Median price asked for vacant for-sale houses and condos in 2022: $199,785.
Median contract rent in 2022: $1,381 (lower quartile is $1,055, upper quartile is $1,811)
Median rent asked for vacant for-rent units in 2022: $2,654
Median gross rent in Ann Arbor, MI in 2022: $1,476
Housing units in Ann Arbor with a mortgage: 13,239 (1,377 second mortgage, 0 home equity loan, 1,296 both second mortgage and home equity loan )Houses without a mortgage: 625
Median household income for houses/condos with a mortgage: $132,418
Median household income for apartments without a mortgage: $107,625
Median monthly housing costs: $1,537
Data:
Median house or condo value ($)
Median house or condo value ($ change since 2000)
Median house or condo value ($) - White
Median house or condo value ($) - Black or African American
Median house or condo value ($) - Asian
Median house or condo value ($) - Hispanic or Latino
Median house or condo value ($) - American Indian and Alaska Native
Median house or condo value ($) - Multirace
Median house or condo value ($) - Other Race
Median price asked for mobile homes ($)
Household density (households per square mile)
Mean house or condo value by units in structure - 1, detached ($)
Mean house or condo value by units in structure - 1, attached ($)
Mean house or condo value by units in structure - 2 ($)
Mean house or condo value by units in structure by units in structure - 3 or 4 ($)
Mean house or condo value by units in structure - 5 or more ($)
Mean house or condo value by units in structure - Boat, RV, van, etc. ($)
Mean house or condo value by units in structure - Mobile home ($)
Median contract rent ($)
Median contract rent - Lower quartile ($)
Median contract rent - Upper quartile ($)
Median gross rent ($)
Urban houses (%)
Rural houses (%)
Houses occupied (%)
Houses occupied (% change since 2000)
Houses owner occupied (%)
Houses owner occupied (% change since 2000)
Houses renter occupied (%)
Houses renter occupied (% change since 2000)
Vacant housing units - For rent (%)
Vacant housing units - For rent (% change since 2000)
Vacant housing units - For sale only (%)
Vacant housing units - For sale only (% change since 2000)
Vacant housing units - Rented or sold, not occupied (%)
Vacant housing units - Rented or sold, not occupied (% change since 2000)
Vacant housing units - For seasonal, recreational, or occasional use (%)
Vacant housing units - For seasonal, recreational, or occasional use (% change since 2000)
Vacant housing units - For migrant workers (%)
Vacant housing units - For migrant workers (% change since 2000)
Vacant housing units - Other vacant (%)
Vacant housing units - Other vacant (% change since 2000)
Median monthly housing costs ($)
Median household income for houses/condos with a mortgage ($)
Median household income for houses/condos without a mortgage ($)
Median household income ($)
Median household income ($) - White
Median household income ($) - Black or African American
Median household income ($) - Asian
Median household income ($) - Hispanic or Latino
Median household income ($) - American Indian and Alaska Native
Median household income ($) - Multirace
Median household income ($) - Other Race
Mortgage status - with mortgage (%)
Mortgage status - with second mortgage (%)
Mortgage status - with home equity loan (%)
Mortgage status - with both second mortgage and home equity loan (%)
Mortgage status - without a mortgage (%)
Median year house/condo built
Median year apartment built
Household type by relationship - Male householder living alone (%)
Household type by relationship - Male householder not living alone (%)
Household type by relationship - Female householder living alone (%)
Household type by relationship - Female householder not living alone (%)
Household type by relationship - Opposite-Sex spouse (%)
Household type by relationship - Same-Sex spouse (%)
Household type by relationship - Opposite-Sex unmarried partner (%)
Household type by relationship - Same-Sex unmarried partner (%)
Household type by relationship - In group quarters (%)
Size of family households - 2-person household (%)
Size of family households - 3-person household (%)
Size of family households - 4-person household (%)
Size of family households - 5-person household (%)
Size of family households - 6-person household (%)
Size of family households - 7-or-more-person household (%)
Size of nonfamily households - 1-person household (%)
Size of nonfamily households - 2-person household (%)
Size of nonfamily households - 3-person household (%)
Size of nonfamily households - 4-person household (%)
Size of nonfamily households - 5-person household (%)
Size of nonfamily households - 6-person household (%)
Size of nonfamily households - 7-or-moreperson household (%)
Year house built - Built 2010 or later (%)
Year house built - Built 2000 to 2009 (%)
Year house built - Built 1990 to 1999 (%)
Year house built - Built 1980 to 1989 (%)
Year house built - Built 1970 to 1979 (%)
Year house built - Built 1960 to 1969 (%)
Year house built - Built 1950 to 1959 (%)
Year house built - Built 1940 to 1949 (%)
Year house built - Built 1939 or earlier (%)
Median number of rooms in houses and condos
Median number of rooms in apartments
Median number of bedrooms in owner occupied houses
Mean number of bedrooms in owner occupied houses
Median number of bedrooms in renter occupied houses
Mean number of bedrooms in renter occupied houses
Median number of vehichles in owner occupied houses
Mean number of vehichles in owner occupied houses
Median number of vehichles in renter occupied houses
Mean number of vehichles in renter occupied houses
Rooms in owner-occupied houses - 1 room (%)
Rooms in owner-occupied houses - 2 rooms (%)
Rooms in owner-occupied houses - 3 rooms (%)
Rooms in owner-occupied houses - 4 rooms (%)
Rooms in owner-occupied houses - 5 rooms (%)
Rooms in owner-occupied houses - 6 rooms (%)
Rooms in owner-occupied houses - 7 rooms (%)
Rooms in owner-occupied houses - 8 rooms (%)
Rooms in owner-occupied houses - 9+ rooms (%)
Rooms in renter-occupied houses - 1 room (%)
Rooms in renter-occupied houses - 2 rooms (%)
Rooms in renter-occupied houses - 3 rooms (%)
Rooms in renter-occupied houses - 4 rooms (%)
Rooms in renter-occupied houses - 5 rooms (%)
Rooms in renter-occupied houses - 6 rooms (%)
Rooms in renter-occupied houses - 7 rooms (%)
Rooms in renter-occupied houses - 8 rooms (%)
Rooms in renter-occupied houses - 9+ rooms (%)
Bedrooms in owner-occupied houses - no bedrooms (%)
Bedrooms in owner-occupied houses - 1 bedroom (%)
Bedrooms in owner-occupied houses - 2 bedrooms (%)
Bedrooms in owner-occupied houses - 3 bedrooms (%)
Bedrooms in owner-occupied houses - 4 bedrooms (%)
Bedrooms in owner-occupied houses - 5+ bedrooms (%)
Bedrooms in renter-occupied houses - no bedrooms (%)
Bedrooms in renter-occupied houses - 1 bedroom (%)
Bedrooms in renter-occupied houses - 2 bedrooms (%)
Bedrooms in renter-occupied houses - 3 bedrooms (%)
Bedrooms in renter-occupied houses - 4 bedrooms (%)
Bedrooms in renter-occupied houses - 5+ bedrooms (%)
Vehicles available in owner-occupied houses - no vehicle available (%)
Vehicles available in owner-occupied houses - 1 vehicle available(%)
Vehicles available in owner-occupied houses - 2 Vehicles available (%)
Vehicles available in owner-occupied houses - 3 Vehicles available (%)
Vehicles available in owner-occupied houses - 4 Vehicles available (%)
Vehicles available in owner-occupied houses - 5+ Vehicles available (%)
Vehicles available in renter-occupied houses - no vehicle available (%)
Vehicles available in renter-occupied houses - 1 vehicle available (%)
Vehicles available in renter-occupied houses - 2 Vehicles available (%)
Vehicles available in renter-occupied houses - 3 Vehicles available (%)
Vehicles available in renter-occupied houses - 4 Vehicles available (%)
Vehicles available in renter-occupied houses - 5+ Vehicles available (%)
Housing units in structures - 1, detached (%)
Housing units in structures - 1, attached (%)
Housing units in structures - 2 (%)
Housing units in structures - 3 or 4 (%)
Housing units in structures - 5 to 9 (%)
Housing units in structures - 10 to 19 (%)
Housing units in structures - 20 to 49 (%)
Housing units in structures - 50 or more (%)
Housing units in structures - Mobile home (%)
Housing units in structures - Boat, RV, van, etc. (%)
Housing units in structures - Owners - 1, detached (%)
Housing units in structures - Owners - 1, attached (%)
Housing units in structures - Owners - 2 (%)
Housing units in structures - Owners - 3 or 4 (%)
Housing units in structures - Owners - 5 to 9 (%)
Housing units in structures - Owners - 10 to 19 (%)
Housing units in structures - Owners - 20 to 49 (%)
Housing units in structures - Owners - 50 or more (%)
Housing units in structures - Owners - Mobile home (%)
Housing units in structures - Owners - Boat, RV, van, etc. (%)
Housing units in structures - Renters - 1, detached (%)
Housing units in structures - Renters - 1, attached (%)
Housing units in structures - Renters - 2 (%)
Housing units in structures - Renters - 3 or 4 (%)
Housing units in structures - Renters - 5 to 9 (%)
Housing units in structures - Renters - 10 to 19 (%)
Housing units in structures - Renters - 20 to 49 (%)
Housing units in structures - Renters - 50 or more (%)
Housing units in structures - Renters - Mobile home (%)
Housing units in structures - Renters - Boat, RV, van, etc. (%)
House/condo owner moved in on average (years ago)
Renter moved in on average (years ago)
Year householder moved into unit - Moved in 1999 to March 2000 (%)
Year householder moved into unit - Moved in 1999 to March 2000 (%) - White
Year householder moved into unit - Moved in 1999 to March 2000 (%) - Black or African American
Year householder moved into unit - Moved in 1999 to March 2000 (%) - Asian
Year householder moved into unit - Moved in 1999 to March 2000 (%) - Hispanic or Latino
Year householder moved into unit - Moved in 1999 to March 2000 (%) - American Indian and Alaska Native
Year householder moved into unit - Moved in 1999 to March 2000 (%) - Multirace
Year householder moved into unit - Moved in 1999 to March 2000 (%) - Other Race
Year householder moved into unit - Moved in 1995 to 1998 (%)
Year householder moved into unit - Moved in 1995 to 1998 (%) - White
Year householder moved into unit - Moved in 1995 to 1998 (%) - Black or African American
Year householder moved into unit - Moved in 1995 to 1998 (%) - Asian
Year householder moved into unit - Moved in 1995 to 1998 (%) - Hispanic or Latino
Year householder moved into unit - Moved in 1995 to 1998 (%) - American Indian and Alaska Native
Year householder moved into unit - Moved in 1995 to 1998 (%) - Multirace
Year householder moved into unit - Moved in 1995 to 1998 (%) - Other Race
Year householder moved into unit - Moved in 1990 to 1994 (%)
Year householder moved into unit - Moved in 1990 to 1994 (%) - White
Year householder moved into unit - Moved in 1990 to 1994 (%) - Black or African American
Year householder moved into unit - Moved in 1990 to 1994 (%) - Asian
Year householder moved into unit - Moved in 1990 to 1994 (%) - Hispanic or Latino
Year householder moved into unit - Moved in 1990 to 1994 (%) - American Indian and Alaska Native
Year householder moved into unit - Moved in 1990 to 1994 (%) - Multirace
Year householder moved into unit - Moved in 1990 to 1994 (%) - Other Race
Year householder moved into unit - Moved in 1980 to 1989 (%)
Year householder moved into unit - Moved in 1980 to 1989 (%) - White
Year householder moved into unit - Moved in 1980 to 1989 (%) - Black or African American
Year householder moved into unit - Moved in 1980 to 1989 (%) - Asian
Year householder moved into unit - Moved in 1980 to 1989 (%) - Hispanic or Latino
Year householder moved into unit - Moved in 1980 to 1989 (%) - American Indian and Alaska Native
Year householder moved into unit - Moved in 1980 to 1989 (%) - Multirace
Year householder moved into unit - Moved in 1980 to 1989 (%) - Other Race
Year householder moved into unit - Moved in 1970 to 1979 (%)
Year householder moved into unit - Moved in 1970 to 1979 (%) - White
Year householder moved into unit - Moved in 1970 to 1979 (%) - Black or African American
Year householder moved into unit - Moved in 1970 to 1979 (%) - Asian
Year householder moved into unit - Moved in 1970 to 1979 (%) - Hispanic or Latino
Year householder moved into unit - Moved in 1970 to 1979 (%) - American Indian and Alaska Native
Year householder moved into unit - Moved in 1970 to 1979 (%) - Multirace
Year householder moved into unit - Moved in 1970 to 1979 (%) - Other Race
Year householder moved into unit - Moved in 1969 or earlier (%)
Year householder moved into unit - Moved in 1969 or earlier (%) - White
Year householder moved into unit - Moved in 1969 or earlier (%) - Black or African American
Year householder moved into unit - Moved in 1969 or earlier (%) - Asian
Year householder moved into unit - Moved in 1969 or earlier (%) - Hispanic or Latino
Year householder moved into unit - Moved in 1969 or earlier (%) - American Indian and Alaska Native
Year householder moved into unit - Moved in 1969 or earlier (%) - Multirace
Year householder moved into unit - Moved in 1969 or earlier (%) - Other Race
Housing units lacking complete plumbing facilities (%)
Housing units lacking complete kitchen facilities (%)
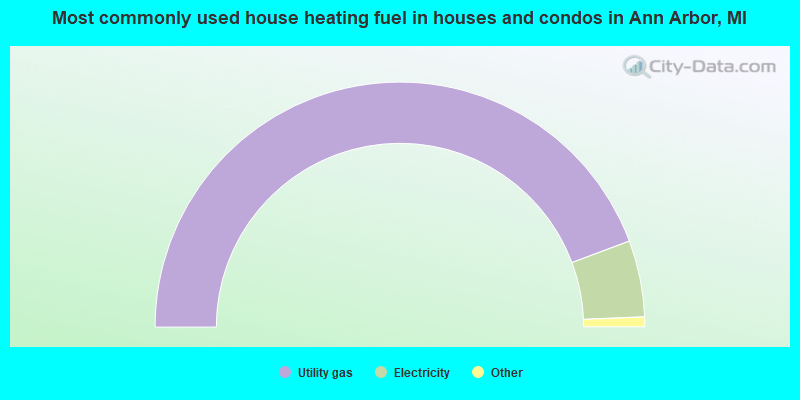
House heating fuel used in houses and condos - Utility gas (%)
House heating fuel used in houses and condos - Bottled, tank, or LP gas (%)
House heating fuel used in houses and condos - Electricity (%)
House heating fuel used in houses and condos - Fuel oil, kerosene, etc. (%)
House heating fuel used in houses and condos - Coal or coke (%)
House heating fuel used in houses and condos - Wood (%)
House heating fuel used in houses and condos - Solar energy (%)
House heating fuel used in houses and condos - Other fuel (%)
House heating fuel used in houses and condos - No fuel used (%)
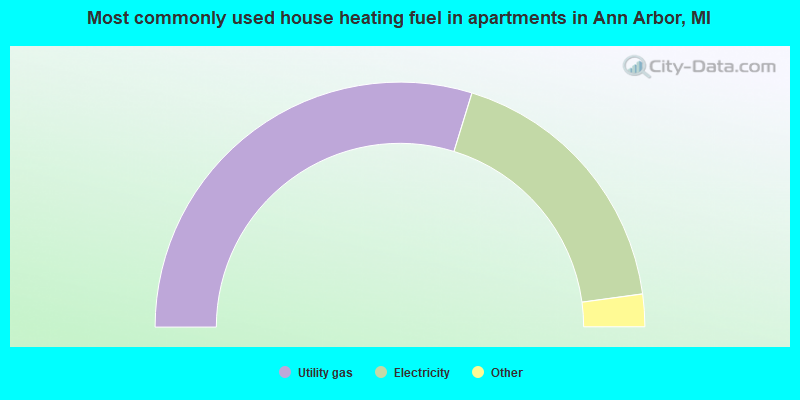
House heating fuel used in apartments - Utility gas (%)
House heating fuel used in apartments - Bottled, tank, or LP gas (%)
House heating fuel used in apartments - Electricity (%)
House heating fuel used in apartments - Fuel oil, kerosene, etc. (%)
House heating fuel used in apartments - Coal or coke (%)
House heating fuel used in apartments - Wood (%)
House heating fuel used in apartments - Solar energy (%)
House heating fuel used in apartments - Other fuel (%)
House heating fuel used in apartments - No fuel used (%)
Median year house/condo built: 1962Median year apartment built: 1974Household type by relationship:
Households: 119,871
Male householders: 25,915 (6,997 living alone ), Female householders: 23,422 (8,752 living alone )16,746 spouses (16,562 opposite-sex spouses ), 4,749 unmarried partners , (4,523 opposite-sex unmarried partners ), 18,058 children (17,157 natural , 448 adopted , 453 stepchildren ), 393 grandchildren , 368 brothers or sisters , 332 parents , 0 foster children , 126 other relatives , 19,303 non-relatives In group quarters: 10,459
Size of family households: 9,856 2-persons , 5,188 3-persons , 3,510 4-persons , 1,632 5-persons , 27 6-persons , 43 7-or-more-persons .
Size of nonfamily households: 15,749 1-person , 8,079 2-persons , 1,395 3-persons , 2,271 4-persons , 426 5-persons , 730 6-persons , 431 7-or-more-persons .
11,139 married couples with children. single-parent households (840 men , 2,194 women ).
77.7% of residents of Ann Arbor speak English at home. of residents speak Spanish at home (77% speak English very well , 19% speak English well , 3% speak English not well , 1% don't speak English at all ).of residents speak other Indo-European language at home (80% speak English very well , 13% speak English well , 7% speak English not well ).of residents speak Asian or Pacific Island language at home (68% speak English very well , 20% speak English well , 6% speak English not well , 5% don't speak English at all ).of residents speak other language at home (68% speak English very well , 29% speak English well , 2% speak English not well , 2% don't speak English at all ).
Foreign born population: 21,158 (17.7%)of them are naturalized citizens )
Median number of rooms in houses and condos:
Median number of rooms in apartments
Owner-occupied Renter-occupied
Bedrooms in owner-occupied houses and condos in Ann Arbor, Michigan
41 no bedroom 389 1 bedroom 4,598 2 bedrooms 9,066 3 bedrooms 5,718 4 bedrooms 1,320 5+ bedrooms
Bedrooms in renter-occupied apartments in Ann Arbor, Michigan
1,384 no bedroom 6,083 1 bedroom 13,174 2 bedrooms 3,744 3 bedrooms 2,453 4 bedrooms 1,367 5+ bedrooms
Owner-occupied Renter-occupied
Rooms in owner-occupied houses in Ann Arbor, Michigan
41 1 room 85 2 rooms 603 3 rooms 2,316 4 rooms 3,179 5 rooms 3,646 6 rooms 2,758 7 rooms 3,565 8 rooms 4,939 9+ rooms
Rooms in renter-occupied apartments in Ann Arbor, Michigan
946 1 room 2,825 2 rooms 6,427 3 rooms 8,142 4 rooms 3,582 5 rooms 2,033 6 rooms 1,480 7 rooms 1,234 8 rooms 1,536 9+ rooms
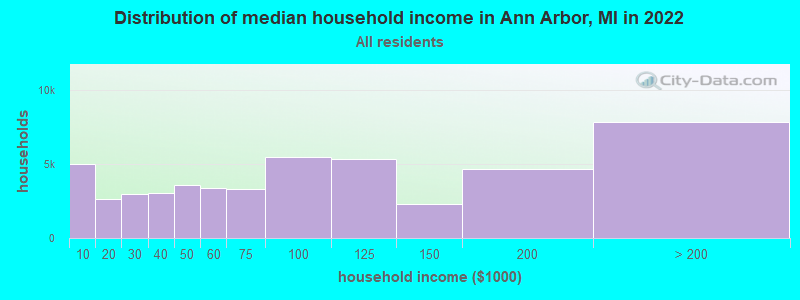
Ann Arbor, MI household income distribution 4,966 Less than $10,0002,634 $10,000 to $19,9992,993 $20,000 to $29,9993,017 $30,000 to $39,9993,579 $40,000 to $49,9993,339 $50,000 to $59,9993,314 $60,000 to $74,9995,467 $75,000 to $99,9995,300 $100,000 to $124,9992,288 $125,000 to $149,9994,622 $150,000 to $199,9997,818 $200,000 or more
Home value of owner - occupied houses in 2022 in Ann Arbor, MI 13 Less than $10,00047 $10,000 to $14,99926 $15,000 to $19,99930 $20,000 to $24,99920 $25,000 to $29,99916 $30,000 to $34,99915 $40,000 to $49,9996 $50,000 to $59,99942 $60,000 to $69,99950 $70,000 to $79,99915 $80,000 to $89,99953 $90,000 to $99,999195 $100,000 to $124,999326 $125,000 to $149,999411 $150,000 to $174,999304 $175,000 to $199,9991,247 $200,000 to $249,9992,001 $250,000 to $299,9994,988 $300,000 to $399,9996,158 $400,000 to $499,9994,904 $500,000 to $749,9991,834 $750,000 to $999,999836 $1,000,000 to $1,499,999150 $1,500,000 to $1,999,99980 $2,000,000 or moreRent paid by renters in 2022 in Ann Arbor, MI 118 $100 to $149382 $150 to $19984 $200 to $249426 $350 to $399170 $400 to $44976 $450 to $499265 $500 to $549588 $550 to $599983 $600 to $649841 $650 to $699289 $700 to $749193 $750 to $799194 $800 to $8991,116 $900 to $9995,517 $1,000 to $1,2495,083 $1,250 to $1,4997,262 $1,500 to $1,9991,909 $2,000 to $2,499940 $2,500 to $2,999984 $3,000 to $3,499377 $3,500 or more408 No cash rent
Percentage of workers working in this county: 89.2%Number of people working at home: 16,282 (26.6% of all workers )
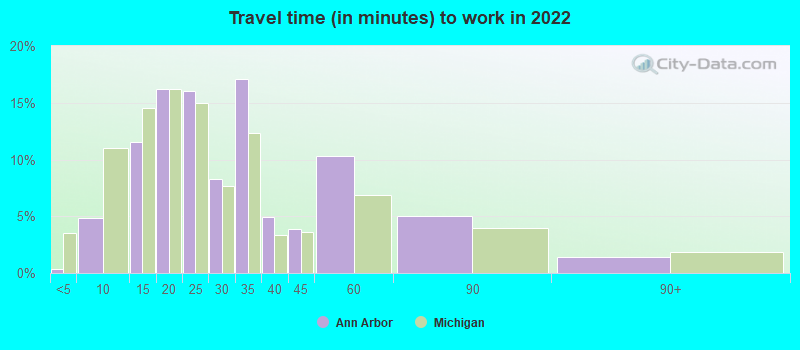
Travel time to work (commute)
Less than 5 minutes: 4195 to 9 minutes: 3,71810 to 14 minutes: 10,24815 to 19 minutes: 10,65920 to 24 minutes: 6,88325 to 29 minutes: 1,39830 to 34 minutes: 5,78635 to 39 minutes: 81640 to 44 minutes: 57345 to 59 minutes: 2,58160 to 89 minutes: 1,31990 or more minutes: 474
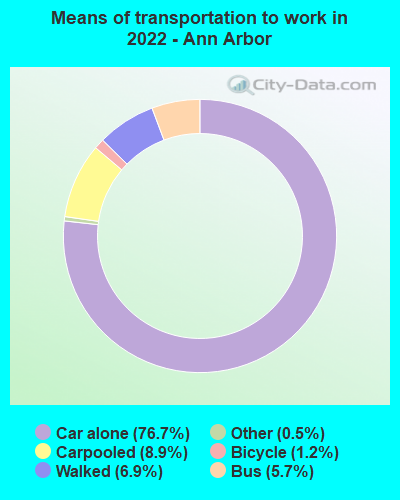
Means of transportation to work:
Drove a car alone: 73,556 (65.6%)Carpooled: 8,568 (7.6%)Bus : 5,491 (4.9%)Taxi: 477 (0.4%)Bicycle: 1,120 (1.0%)Walked: 6,661 (5.9%)Worked at home: 16,282 (14.5%)
Unemployment by race in 2022
Unemployment rate for White non-Hispanic residents 1.6% Males3.9% FemalesUnemployment rate for Black residents 3.7% Males8.8% FemalesUnemployment rate for American Indian and Alaska Native residents 8.9% MalesUnemployment rate for Asian residents 1.6% Males2.4% FemalesUnemployment rate for other race residents 2.5% Males1.5% FemalesUnemployment rate for two or more race residents 8.3% Males6.3% FemalesUnemployment rate for Hispanic or Latino residents 7.4% Males19.8% Females
Year of entry for the foreign-born population in Ann Arbor, Michigan
11,346 2010 or later 3,944 2000 to 2009 2,367 1990 to 1999 3,622 1980 to 1989 1,595 1970 to 1979 1,860 Before 1970
First ancestries reported:
German: 4,333 (8.2%)
English: 2,476 (4.7%)
European: 2,400 (4.6%)
Irish: 2,300 (4.4%)
American: 1,783 (3.4%)
Polish: 1,539 (2.9%)
Italian: 1,531 (2.9%)
Eastern European: 947 (1.8%)
Dutch: 665 (1.3%)
Nigerian: 610 (1.2%)
Iranian: 580 (1.1%)
Russian: 443 (0.8%)
Scottish: 380 (0.7%)
Romanian: 342 (0.6%)
Norwegian: 319 (0.6%)
French Canadian: 313 (0.6%)
Jordanian: 309 (0.6%)
French: 309 (0.6%)
African: 305 (0.6%)
Lithuanian: 298 (0.6%)
Turkish: 269 (0.5%)
Egyptian: 264 (0.5%)
Armenian: 243 (0.5%)
Arab: 227 (0.4%)
Ghanaian: 216 (0.4%)
British: 204 (0.4%)
Syrian: 204 (0.4%)
Scotch-Irish: 187 (0.4%)
Iraqi: 158 (0.3%)
Belgian: 158 (0.3%)
Northern European: 157 (0.3%)
Finnish: 155 (0.3%)
Greek: 155 (0.3%)
Lebanese: 154 (0.3%)
Swedish: 149 (0.3%)
Palestinian: 135 (0.3%)
Slovak: 122 (0.2%)
Canadian: 122 (0.2%)
Scandinavian: 121 (0.2%)
Hungarian: 120 (0.2%)
Croatian: 101 (0.2%)
Senegalese: 100 (0.2%)
Carpatho Rusyn: 95 (0.2%)
Celtic: 94 (0.2%)
Ukrainian: 91 (0.2%)
Albanian: 88 (0.2%)
Austrian: 81 (0.2%)
Somali: 73 (0.1%)
Czech: 68 (0.1%)
Australian: 67 (0.1%)
Ethiopian: 63 (0.1%)
Swiss: 63 (0.1%)
Welsh: 63 (0.1%)
Slavic: 61 (0.1%)
Danish: 56 (0.1%)
Czechoslovakian: 51 (0.10%)
Slovene: 50 (0.09%)
Latvian: 43 (0.08%)
Jamaican: 38 (0.07%)
Portuguese: 34 (0.06%)
Liberian: 33 (0.06%)
Serbian: 32 (0.06%)
Brazilian: 30 (0.06%)
Israeli: 30 (0.06%)
Yugoslavian: 30 (0.06%)
Maltese: 23 (0.04%)
Pennsylvania German: 16 (0.03%)
Afghan: 15 (0.03%)
Cypriot: 9 (0.02%)
Moroccan: 9 (0.02%)
Icelander: 8 (0.02%)
Macedonian: 8 (0.02%)
Most common places of birth for foreign-born residents (%): China, excluding Hong Kong and Taiwan Ann Arbor:
20.4% (4,519)Michigan:
4.9% (34,295)
India Ann Arbor:
10.4% (2,310)Michigan:
11.1% (77,240)
Korea Ann Arbor:
7.2% (1,600)Michigan:
3.0% (20,884)
Canada Ann Arbor:
3.8% (840)Michigan:
5.0% (35,052)
Japan Ann Arbor:
3.3% (733)Michigan:
1.5% (10,225)
Taiwan Ann Arbor:
3.2% (719)Michigan:
0.6% (4,450)
Germany Ann Arbor:
2.7% (601)Michigan:
2.3% (16,126)
Mexico Ann Arbor:
2.7% (593)Michigan:
10.9% (75,965)
United Kingdom, excluding England and Scotland Ann Arbor:
2.0% (447)Michigan:
0.8% (5,492)
Iran Ann Arbor:
2.0% (433)Michigan:
0.6% (4,245)
Iraq Ann Arbor:
1.8% (391)Michigan:
8.1% (55,954)
Pakistan Ann Arbor:
1.7% (378)Michigan:
1.5% (10,596)
Place of birth for U.S.-born residents:
This state: 54,911Other state: 41,857Northeast: 11,148Midwest: 15,822South: 8,679West: 6,208 62.9% of Ann Arbor residents lived in the same house 1 years ago.
Out of people who lived in different houses, 29.4% lived in this county.
Out of people who lived in different counties, 50.4% lived in Michigan.
Ann Arbor:
62.9%State average:
88.4%
Education attainment for males 25 years and older:
No schooling: 379Nursery to 4th grade: 775th and 6th grade: 07th and 8th grade: 2099th grade: 12310th grade: 13211th grade: 3312th grade, no diploma: 89High school graduate (or equivalency): 1,144Less than 1 year of college: 749Some college more than 1 year, no degree: 1,746Associate degree: 1,139Bachelor's degree: 10,217Master's degree: 7,963Professional school degree: 2,565Doctorate degree: 4,741
Education attainment for females 25 years and older:
No schooling: 195Nursery to 4th grade: 05th and 6th grade: 07th and 8th grade: 09th grade: 7610th grade: 11711th grade: 5412th grade, no diploma: 245High school graduate (or equivalency): 2,056Less than 1 year of college: 1,131Some college more than 1 year, no degree: 1,517Associate degree: 1,561Bachelor's degree: 10,514Master's degree: 7,789Professional school degree: 2,136Doctorate degree: 3,620
Housing units in structures:
One, detached: 20,432One, attached: 5,898Two: 2,8773 or 4: 3,6735 to 9: 8,31810 to 19: 3,29120 to 49: 1,84250 or more: 6,408Mobile homes: 374Housing units lacking complete plumbing facilities in 2022: 0.1%Housing units lacking complete kitchen facilities in 2022: 0.9%House/condo owner moved in on average 12 years ago
Renter moved in on average 0 years ago
Private vs. public school enrollment:
Students in private schools in grades 1 to 8 (elementary and middle school): 562 Students in private schools in grades 9 to 12 (high school): 639 Students in private undergraduate colleges: 380