Annville, PA (Pennsylvania) Houses and Residents
| Annville: | $194,599 |
| Pennsylvania: | $245,500 |
Mean price in 2022:
Detached houses: $238,589
Here: $238,589 State: $317,202 Townhouses or other attached units: $172,630
Here: $172,630 State: $254,369 Mobile homes: $70,324
Here: $70,324 State: $92,414
Total population: 4,767 (Urban population: 4,518, Rural population: 0)
Houses: 1,602 (1,498 occupied: 873 owner occupied, 605 renter occupied)
| % of renters here: | 41% |
| State: | 31% |
Housing density: 1,016 houses/condos per square mile
Median price asked for vacant for-sale houses and condos in 2022 in this county: $236,942.
Median contract rent in 2022: $854 (lower quartile is $698, upper quartile is $1,118)
Median rent asked for vacant for-rent units in 2022: $1,194
Median gross rent in Annville, PA in 2022: $946
Housing units in Annville with a mortgage: 671 (49 second mortgage, 0 home equity loan, 34 both second mortgage and home equity loan)
Houses without a mortgage: 35
Median household income for houses/condos with a mortgage: $92,845
Median household income for apartments without a mortgage: $54,181
Median monthly housing costs: $1,076
Compare current foreclosures near Annville, PA:
| Photo | Address | Area | Beds / Baths | Price | Details |
|---|---|---|---|---|---|

|
#1
N Lancaster St
Annville, PA 17003
|
1,257 sq. feet
|
1 baths 4 beds |
show details | |

|
#2
Laurel Grove Rd
Annville, PA 17003
|
1,176 sq. feet
|
1 baths 3 beds |
show details | |

|
#3
Palm City Park
Annville, PA 17003
|
952 sq. feet
|
2 baths - beds |
show details | |

|
#4
Pearl St
Annville, PA 17003
|
1,339 sq. feet
|
1 baths - beds |
show details | |

|
#5
Kauffman Rd
Annville, PA 17003
|
1,500 sq. feet
|
2 baths - beds |
show details | |

|
#6
W Sheridan Ave
Annville, PA 17003
|
1,126 sq. feet
|
1 baths - beds |
show details | |

|
#7
Palm City Park
Annville, PA 17003
|
938 sq. feet
|
1 baths - beds |
show details | |

|
#8
N State Route 934 Apt 3
Annville, PA 17003
|
- sq. feet
|
- baths - beds |
show details | |

|
#9
Oxford Rd
Annville, PA 17003
|
- sq. feet
|
- baths - beds |
show details | |

|
#10
W Main St
Annville, PA 17003
|
- sq. feet
|
- baths - beds |
show details |
| Photo | Address | Area | Beds / Baths | Price | Details |
|---|---|---|---|---|---|

|
#11
Parkside Dr
Annville, PA 17003
|
- sq. feet
|
- baths - beds |
show details | |

|
#12
Mayapple Dr
Annville, PA 17003
|
- sq. feet
|
- baths - beds |
show details | |

|
#13
Church Rd
Hummelstown, PA 17036
|
1,520 sq. feet
|
3 baths 4 beds |
show details | |

|
#14
Tulane Rd
Hummelstown, PA 17036
|
698 sq. feet
|
1 baths 3 beds |
show details | |

|
#15
W Brubaker Valley Rd
Lititz, PA 17543
|
2,820 sq. feet
|
2 baths 3 beds |
show details | |

|
#16
E Main Ave
Myerstown, PA 17067
|
1,336 sq. feet
|
2 baths 3 beds |
show details | |

|
#17
W Washington Ave
Myerstown, PA 17067
|
1,504 sq. feet
|
1 baths 3 beds |
show details | |

|
#18
Stracks Dam Rd
Myerstown, PA 17067
|
1,453 sq. feet
|
2 baths 3 beds |
show details | |

|
#19
Swatara Creek Dr
Jonestown, PA 17038
|
1,276 sq. feet
|
1 baths 3 beds |
show details | |

|
#20
Horizon Dr
Fredericksburg, PA 17026
|
1,276 sq. feet
|
2 baths 3 beds |
show details |
| Photo | Address | Area | Beds / Baths | Price | Details |
|---|---|---|---|---|---|

|
#21
State Route 72
Jonestown, PA 17038
|
1,517 sq. feet
|
2 baths 4 beds |
show details | |

|
#22
Moore Rd
Lebanon, PA 17046
|
1,196 sq. feet
|
1 baths 3 beds |
show details | |

|
#23
E Cumberland St
Lebanon, PA 17042
|
1,580 sq. feet
|
2 baths 3 beds |
show details | |

|
#24
E Elm St
Lebanon, PA 17042
|
1,156 sq. feet
|
1 baths 3 beds |
show details | |

|
#25
S Lancaster St
Lebanon, PA 17046
|
900 sq. feet
|
1 baths 3 beds |
show details | |

|
#26
Parklea Dr
Hummelstown, PA 17036
|
984 sq. feet
|
1 baths 3 beds |
show details | |

|
#27
Grandview Cir
Mount Joy, PA 17552
|
1,060 sq. feet
|
1 baths 2 beds |
show details | |

|
#28
N Market St
Elizabethtown, PA 17022
|
1,656 sq. feet
|
1 baths 3 beds |
show details | |

|
#29
Eddington Ave
Harrisburg, PA 17111
|
1,784 sq. feet
|
2 baths 4 beds |
show details | |

|
#30
Prosperous Dr
Harrisburg, PA 17112
|
3,734 sq. feet
|
3 baths 4 beds |
show details |
| Photo | Address | Area | Beds / Baths | Price | Details |
|---|---|---|---|---|---|

|
#31
Market St
Highspire, PA 17034
|
2,148 sq. feet
|
2 baths 3 beds |
show details | |

|
#32
2nd Street Aka 493 Second Street
Highspire, PA 17034
|
1,864 sq. feet
|
1 baths 3 beds |
show details | |

|
#33
E Main St
Lititz, PA 17543
|
1,908 sq. feet
|
2 baths 3 beds |
show details | |

|
#34
Prince St
Harrisburg, PA 17109
|
1,040 sq. feet
|
1 baths 2 beds |
show details | |

|
#35
Harvest Dr
Harrisburg, PA 17111
|
2,642 sq. feet
|
2 baths 4 beds |
show details | |

|
#36
Leonard Ln
Harrisburg, PA 17111
|
1,248 sq. feet
|
2 baths 2 beds |
show details | |

|
#37
E High St
Elizabethtown, PA 17022
|
1,270 sq. feet
|
1 baths 3 beds |
show details | |

|
#38
Canyon Rd
Harrisburg, PA 17111
|
1,602 sq. feet
|
2 baths 4 beds |
show details | |

|
#39
Manheim St
Mount Joy, PA 17552
|
1,100 sq. feet
|
1 baths 2 beds |
show details | |

|
#40
Sandhill Rd
Lebanon, PA 17046
|
1,335 sq. feet
|
1 baths 3 beds |
show details |
| Photo | Address | Area | Beds / Baths | Price | Details |
|---|---|---|---|---|---|

|
#41
S Park St
Richland, PA 17087
|
1,380 sq. feet
|
1 baths 3 beds |
show details | |

|
#42
Millardsville Rd
Richland, PA 17087
|
1,584 sq. feet
|
1 baths 3 beds |
show details | |

|
#43
Knoll Dr
Mount Joy, PA 17552
|
1,240 sq. feet
|
1 baths 3 beds |
show details | |

|
#44
Lawn Rd
Palmyra, PA 17078
|
1,830 sq. feet
|
2 baths 2 beds |
show details | |

|
#45
Crosswinds Dr
Lititz, PA 17543
|
1,296 sq. feet
|
1 baths 3 beds |
show details | |

|
#46
Moritz Dr
Lebanon, PA 17046
|
3,160 sq. feet
|
2 baths 3 beds |
show details | |

|
#47
S 9th St
Lebanon, PA 17042
|
3,291 sq. feet
|
2 baths 6 beds |
show details | |

|
#48
Queen St
Palmyra, PA 17078
|
1,120 sq. feet
|
1 baths 2 beds |
show details | |

|
#49
Church St
Lebanon, PA 17046
|
1,510 sq. feet
|
1 baths 4 beds |
show details | |

|
Check over 1 million property listings on Foreclosure.com!
|
browse all offers | |||

Latest news about housing in Annville, PA collected exclusively by city-data.com from local newspapers, TV, and radio stations

 | Looking for a NICE rental house in Palmyra or Hershey! (0 replies) |
| Where to live near Annville? (2 replies) |
| PA Property taxes -Looking to maybe move back, but what in the world!?! (28 replies) |
| A strange question from England about the Annville area (3 replies) |
| Good quality low cost furniture store? (4 replies) |
| Short term rental in Annville (0 replies) |

Median year apartment built: 1964
Household type by relationship:
Households: 4,854- Male householders: 715 (209 living alone), Female householders: 770 (393 living alone)
689 spouses (689 opposite-sex spouses), 45 unmarried partners, (45 opposite-sex unmarried partners), 787 children (771 natural, 0 adopted, 16 stepchildren), 30 grandchildren, 69 brothers or sisters, 22 parents, 0 foster children, 76 other relatives, 77 non-relatives
- In group quarters: 1,571
Size of family households: 397 2-persons, 162 3-persons, 155 4-persons, 84 5-persons, 19 6-persons.
Size of nonfamily households: 594 1-person, 49 2-persons.
518 married couples with children.
90 single-parent households (16 men, 74 women).
87.1% of residents of Annville speak English at home.
8.1% of residents speak Spanish at home (75% speak English very well, 21% speak English well, 5% speak English not well).
1.3% of residents speak other Indo-European language at home (100% speak English very well).
0.2% of residents speak Asian or Pacific Island language at home (100% speak English not well).
2.9% of residents speak other language at home (53% speak English very well, 47% speak English well).
Foreign born population: 389 (8.0%)
(39.3% of them are naturalized citizens)
| Here: | 6.1 |
| State: | 6.8 |
| Here: | 3.3 |
| State: | 4.3 |

- Bedrooms in owner-occupied houses and condos in Annville, Pennsylvania
- 0no bedroom
- 371 bedroom
- 1732 bedrooms
- 4073 bedrooms
- 1824 bedrooms
- 745+ bedrooms

- Bedrooms in renter-occupied apartments in Annville, Pennsylvania
- 56no bedroom
- 3041 bedroom
- 1282 bedrooms
- 873 bedrooms
- 304 bedrooms
- 05+ bedrooms

- Cars and other vehicles available in Annville in owner-occupied houses/condos
- 29no vehicle
- 3391 vehicle
- 3492 vehicles
- 1363 vehicles
- 204 vehicles
- 05+ vehicles

- Cars and other vehicles available in Annville in renter-occupied apartments
- 46no vehicle
- 2901 vehicle
- 2422 vehicles
- 223 vehicles
- 54 vehicles
- 05+ vehicles

- Rooms in owner-occupied houses in Annville, Pennsylvania
- 01 room
- 02 rooms
- 153 rooms
- 734 rooms
- 1065 rooms
- 3246 rooms
- 747 rooms
- 938 rooms
- 1889+ rooms

- Rooms in renter-occupied apartments in Annville, Pennsylvania
- 511 room
- 712 rooms
- 2543 rooms
- 794 rooms
- 295 rooms
- 276 rooms
- 357 rooms
- 288 rooms
- 319+ rooms


Annville, PA household income distribution

- 76Less than $10,000
- 62$10,000 to $19,999
- 111$20,000 to $29,999
- 161$30,000 to $39,999
- 118$40,000 to $49,999
- 130$50,000 to $59,999
- 164$60,000 to $74,999
- 265$75,000 to $99,999
- 161$100,000 to $124,999
- 90$125,000 to $149,999
- 27$150,000 to $199,999
- 78$200,000 or more
Home value of owner - occupied houses in 2022 in Annville, PA
-
- 28Less than $10,000
- 6$15,000 to $19,999
- 7$90,000 to $99,999
- 52$100,000 to $124,999
- 102$125,000 to $149,999
- 141$150,000 to $174,999
- 216$175,000 to $199,999
- 138$200,000 to $249,999
- 40$250,000 to $299,999
- 55$300,000 to $399,999
- 22$400,000 to $499,999
Rent paid by renters in 2022 in Annville, PA
-
- 9$400 to $449
- 5$450 to $499
- 68$600 to $649
- 30$650 to $699
- 54$700 to $749
- 70$750 to $799
- 48$800 to $899
- 31$900 to $999
- 43$1,000 to $1,249
- 19$1,250 to $1,499
- 35$1,500 to $1,999
- 68$2,500 to $2,999
- 45No cash rent


Percentage of workers working in this county: 65.9%
Number of people working at home: 213 (8.3% of all workers)
Travel time to work (commute)
- Less than 5 minutes: 88
- 5 to 9 minutes: 347
- 10 to 14 minutes: 356
- 15 to 19 minutes: 347
- 20 to 24 minutes: 360
- 25 to 29 minutes: 89
- 30 to 34 minutes: 203
- 35 to 39 minutes: 32
- 40 to 44 minutes: 254
- 45 to 59 minutes: 166
- 60 to 89 minutes: 29
- 90 or more minutes: 7
Means of transportation to work:
- Drove a car alone: 1,924 (74.2%)
- Carpooled: 252 (9.7%)
- Bicycle: 31 (1.2%)
- Walked: 188 (7.3%)
- Worked at home: 214 (8.3%)

- Unemployment by race in 2022
- Unemployment rate for White non-Hispanic residents
- 2.7%Males
- 4.1%Females
- Unemployment rate for Hispanic or Latino residents
- 13.9%Males
- 9.6%Females

- Year of entry for the foreign-born population in Annville, Pennsylvania
- 2792010 or later
- 252000 to 2009
- 501990 to 1999
- 71980 to 1989
- 101970 to 1979
- 17Before 1970

First ancestries reported:
- German: 592 (31.2%)
- American: 234 (12.3%)
- Italian: 100 (5.3%)
- Scottish: 64 (3.4%)
- English: 42 (2.2%)
- Irish: 42 (2.2%)
- Polish: 31 (1.6%)
- Croatian: 27 (1.4%)
- Norwegian: 24 (1.3%)
- European: 18 (0.9%)
- French: 16 (0.8%)
- Australian: 12 (0.6%)
- Nigerian: 11 (0.6%)
- African: 11 (0.6%)
- Pennsylvania German: 10 (0.5%)
- Scotch-Irish: 7 (0.4%)
- Kenyan: 6 (0.3%)
- Swedish: 6 (0.3%)
- West Indian: 6 (0.3%)
- Russian: 3 (0.2%)
Most common places of birth for foreign-born residents (%):
| Annville: | 23.0% (76) |
| Pennsylvania: | 0.5% (4,946) |
| Annville: | 18.1% (60) |
| Pennsylvania: | 9.2% (86,544) |
| Annville: | 12.1% (40) |
| Pennsylvania: | 0.2% (1,956) |
| Annville: | 10.9% (36) |
| Pennsylvania: | 0.2% (1,902) |
| Annville: | 7.9% (26) |
| Pennsylvania: | 0.5% (4,424) |
| Annville: | 7.3% (24) |
| Pennsylvania: | 0.6% (6,036) |
| Annville: | 3.9% (13) |
| Pennsylvania: | 0.2% (1,557) |
| Annville: | 3.9% (13) |
| Pennsylvania: | 0.3% (3,132) |
| Annville: | 3.0% (10) |
| Pennsylvania: | 1.1% (10,709) |
| Annville: | 2.7% (9) |
| Pennsylvania: | 0.5% (4,593) |
| Annville: | 2.1% (7) |
| Pennsylvania: | 0.3% (2,506) |
| Annville: | 2.1% (7) |
| Pennsylvania: | 1.1% (10,035) |
Place of birth for U.S.-born residents:
- This state: 3,660
- Other state: 669
- Northeast: 265
- Midwest: 48
- South: 342
- West: 11
82.5% of Annville residents lived in the same house 1 years ago.
Out of people who lived in different houses, 25.5% lived in this county.
Out of people who lived in different counties, 71.2% lived in Pennsylvania.
| Annville: | 82.5% |
| State average: | 89.3% |
Education attainment for males 25 years and older:
- No schooling: 0
- Nursery to 4th grade: 0
- 5th and 6th grade: 0
- 7th and 8th grade: 18
- 9th grade: 0
- 10th grade: 0
- 11th grade: 52
- 12th grade, no diploma: 0
- High school graduate (or equivalency): 385
- Less than 1 year of college: 119
- Some college more than 1 year, no degree: 54
- Associate degree: 97
- Bachelor's degree: 161
- Master's degree: 150
- Professional school degree: 12
- Doctorate degree: 3

Education attainment for females 25 years and older:
- No schooling: 12
- Nursery to 4th grade: 0
- 5th and 6th grade: 0
- 7th and 8th grade: 10
- 9th grade: 0
- 10th grade: 44
- 11th grade: 0
- 12th grade, no diploma: 0
- High school graduate (or equivalency): 428
- Less than 1 year of college: 102
- Some college more than 1 year, no degree: 77
- Associate degree: 29
- Bachelor's degree: 441
- Master's degree: 182
- Professional school degree: 0
- Doctorate degree: 0


Housing units in structures:
- One, detached: 535
- One, attached: 494
- Two: 111
- 3 or 4: 90
- 5 to 9: 124
- 20 to 49: 79
- 50 or more: 125
- Mobile homes: 41
Housing units lacking complete kitchen facilities in 2022: 1.0%
House/condo owner moved in on average 8 years ago
Renter moved in on average 1 years ago

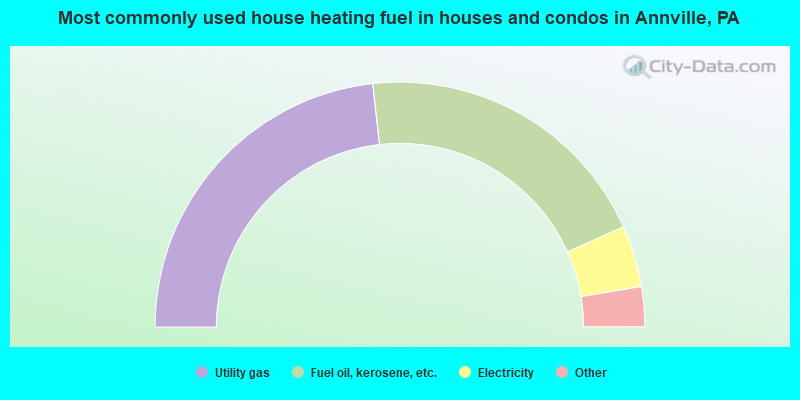
- 46.5%Utility gas
- 40.2%Fuel oil, kerosene, etc.
- 8.1%Electricity
- 3.3%Wood
- 1.0%Other fuel
- 0.8%Bottled, tank, or LP gas
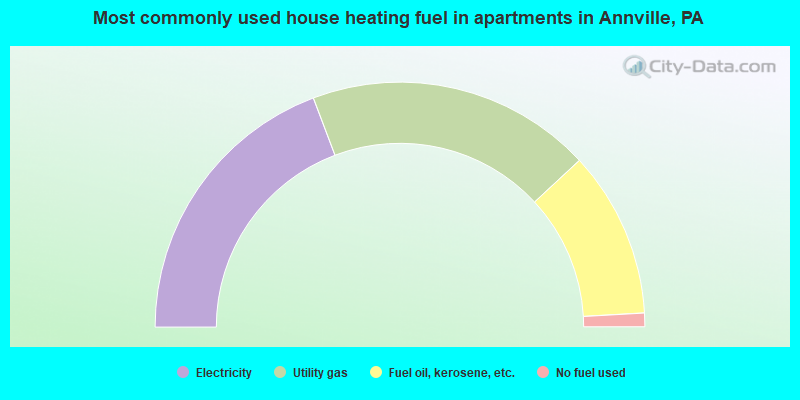
- 38.5%Electricity
- 37.7%Utility gas
- 22.0%Fuel oil, kerosene, etc.
- 1.8%No fuel used
Private vs. public school enrollment:
| Here: | 0.0% |
| Pennsylvania: | 15.7% |
| Here: | 9.1% |
| Pennsylvania: | 13.4% |
| Here: | 96.8% |
| Pennsylvania: | 39.8% |


