Apple Springs, TX (Texas) Houses and Residents
| Apple Springs: | $121,939 |
| Texas: | $275,400 |
Total population: 2,654 (Urban population: 0, Rural population: 2,616 (79 farm, 2,537 nonfarm))
Houses: 1,318 (1,027 occupied: 898 owner occupied, 129 renter occupied)
| % of renters here: | 13% |
| State: | 38% |
Housing density: 4 houses/condos per square mile
Median price asked for vacant for-sale houses and condos in 2022 in this county: $150,824.
Median contract rent in 2022: $602 (lower quartile is $502, upper quartile is $646)
Median rent asked for vacant for-rent units in 2022: $532
Median gross rent in Apple Springs, TX in 2022: $851
Housing units in Apple Springs with a mortgage: 135 (0 second mortgage, 3 home equity loan, 0 both second mortgage and home equity loan)
Houses without a mortgage: 219
Compare current foreclosures near Apple Springs, TX:
| Photo | Address | Area | Beds / Baths | Price | Details |
|---|---|---|---|---|---|

|
#1
Carlton Rd
Groveton, TX 75845
|
780 sq. feet
|
- baths - beds |
show details | |

|
#2
W Fm 358 # 5
Pennington, TX 75856
|
- sq. feet
|
- baths - beds |
show details | |

|
#3
Oak Cir
Corrigan, TX 75939
|
1,748 sq. feet
|
- baths - beds |
show details | |

|
#4
Shady Grove Loop
Lufkin, TX 75904
|
1,254 sq. feet
|
- baths - beds |
show details | |

|
#5
Cathy Lou Ln
Corrigan, TX 75939
|
- sq. feet
|
- baths - beds |
show details | |

|
#6
N Princess Dr
Corrigan, TX 75939
|
- sq. feet
|
- baths - beds |
show details | |

|
#7
Fm 2108
Diboll, TX 75941
|
- sq. feet
|
- baths - beds |
show details | |

|
#8
Corrigan Heights
Corrigan, TX 75939
|
- sq. feet
|
- baths - beds |
show details | |

|
#9
N Fm 1194
Lufkin, TX 75904
|
1,680 sq. feet
|
- baths - beds |
show details | |

|
#10
S Home St
Corrigan, TX 75939
|
- sq. feet
|
- baths - beds |
show details |
| Photo | Address | Area | Beds / Baths | Price | Details |
|---|---|---|---|---|---|

|
#11
W 4th St
Groveton, TX 75845
|
- sq. feet
|
- baths - beds |
show details | |

|
#12
County Road 4570
Kennard, TX 75847
|
- sq. feet
|
- baths - beds |
show details | |

|
#13
Rutland St
Diboll, TX 75941
|
- sq. feet
|
- baths - beds |
show details | |

|
#14
Fm 2497
Diboll, TX 75941
|
- sq. feet
|
- baths - beds |
show details | |

|
#15
Holubec St
Diboll, TX 75941
|
- sq. feet
|
- baths - beds |
show details | |

|
#16
N Hines St
Diboll, TX 75941
|
1,961 sq. feet
|
- baths - beds |
show details | |

|
#17
S Temple Dr
Diboll, TX 75941
|
1,434 sq. feet
|
- baths - beds |
show details | |

|
#18
W Us Highway 287
Groveton, TX 75845
|
- sq. feet
|
- baths - beds |
show details | |

|
#19
W 1st St
Groveton, TX 75845
|
- sq. feet
|
- baths - beds |
show details | |

|
#20
Dogwood Cir
Corrigan, TX 75939
|
- sq. feet
|
- baths - beds |
show details |
| Photo | Address | Area | Beds / Baths | Price | Details |
|---|---|---|---|---|---|

|
Check over 1 million property listings on Foreclosure.com!
|
browse all offers | |||
| Photo | Address | Area | Beds / Baths | Price | Details |
|---|

Household type by relationship:
Households: 14,537- In family households: 12,052 (2,834 male householders, 1,227 female householders)
3,024 spouses, 3,448 children (3,031 natural, 110 adopted, 307 stepchildren), 578 grandchildren, 140 brothers or sisters, 169 parents, foster children, 197 other relatives, 331 non-relatives
- In nonfamily households: 2,485 (1,032 male householders (839 living alone)), 1,049 female householders (922 living alone)), 404 nonrelatives
- In group quarters: 48 (40 institutionalized population)
1,859 married couples with children.
836 single-parent households (175 men, 661 women).
97.3% of residents of Apple Springs speak English at home.
2.2% of residents speak Spanish at home (49% speak English very well, 26% speak English well, 25% speak English not well).
0.5% of residents speak other Indo-European language at home (50% speak English very well, 50% speak English well).
0.1% of residents speak Asian or Pacific Island language at home (100% speak English well).
Foreign born population: 63 (1.8%)
(61.9% of them are naturalized citizens)
| Here: | 6.0 |
| State: | 6.3 |
| Here: | 4.8 |
| State: | 4.0 |

- Bedrooms in owner-occupied houses and condos in Apple Springs, Texas
- 1no bedroom
- 461 bedroom
- 2762 bedrooms
- 4833 bedrooms
- 784 bedrooms
- 145+ bedrooms

- Bedrooms in renter-occupied apartments in Apple Springs, Texas
- 0no bedroom
- 171 bedroom
- 452 bedrooms
- 583 bedrooms
- 94 bedrooms
- 05+ bedrooms

- Cars and other vehicles available in Apple Springs in owner-occupied houses/condos
- 47no vehicle
- 2411 vehicle
- 4562 vehicles
- 1143 vehicles
- 374 vehicles
- 35+ vehicles

- Cars and other vehicles available in Apple Springs in renter-occupied apartments
- 14no vehicle
- 511 vehicle
- 582 vehicles
- 63 vehicles
- 04 vehicles
- 05+ vehicles

- Rooms in owner-occupied houses in Apple Springs, Texas
- 11 room
- 122 rooms
- 503 rooms
- 1704 rooms
- 3265 rooms
- 1936 rooms
- 637 rooms
- 538 rooms
- 309+ rooms

- Rooms in renter-occupied apartments in Apple Springs, Texas
- 01 room
- 62 rooms
- 103 rooms
- 404 rooms
- 335 rooms
- 316 rooms
- 97 rooms
- 08 rooms
- 09+ rooms


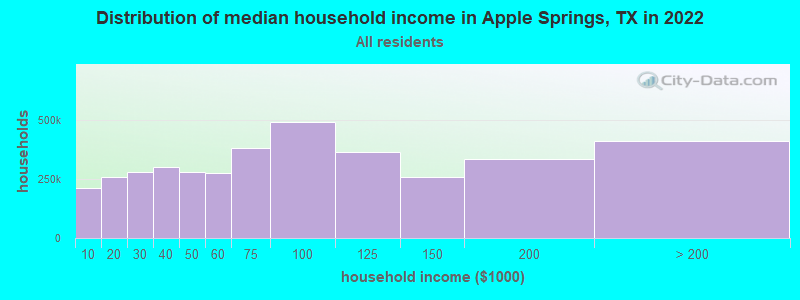
Apple Springs, TX household income distribution

- 62,264Less than $10,000
- 84,649$10,000 to $19,999
- 92,088$20,000 to $29,999
- 96,993$30,000 to $39,999
- 91,509$40,000 to $49,999
- 87,824$50,000 to $59,999
- 121,575$60,000 to $74,999
- 166,464$75,000 to $99,999
- 126,189$100,000 to $124,999
- 93,032$125,000 to $149,999
- 108,186$150,000 to $199,999
- 121,605$200,000 or more
Percentage of workers working in this county: 36.9%
Number of people working at home: 150 (11.1% of all workers)
Travel time to work (commute)
- Less than 5 minutes: 47
- 5 to 9 minutes: 72
- 10 to 14 minutes: 81
- 15 to 19 minutes: 54
- 20 to 24 minutes: 76
- 25 to 29 minutes: 59
- 30 to 34 minutes: 253
- 35 to 39 minutes: 28
- 40 to 44 minutes: 64
- 45 to 59 minutes: 111
- 60 to 89 minutes: 61
- 90 or more minutes: 47
Means of transportation to work:
- Drove a car alone: 768 (77.5%)
- Carpooled: 173 (17.5%)
- Bus or trolley bus: 2 (0.2%)
- Walked: 10 (1.0%)
- Worked at home: 38 (3.8%)


- Year of entry for the foreign-born population in Apple Springs, Texas
- 21995 to March 2000
- 01990 to 1994
- 01985 to 1989
- 01980 to 1984
- 51975 to 1979
- 41970 to 1974
- 01965 to 1969
- 17Before 1965
Most common places of birth for foreign-born residents (%):
| Apple Springs: | 32.1% (9) |
| Texas: | 1.4% (39,249) |
| Apple Springs: | 21.4% (6) |
| Texas: | 1.2% (36,176) |
| Apple Springs: | 21.4% (6) |
| Texas: | 64.8% (1,879,369) |
| Apple Springs: | 10.7% (3) |
| Texas: | 0.6% (16,011) |
| Apple Springs: | 7.1% (2) |
| Texas: | 1.2% (35,986) |
| Apple Springs: | 7.1% (2) |
| Texas: | 0.3% (9,470) |
Place of birth for U.S.-born residents:
- This state: 2,273
- Other state: 306
- Northeast: 20
- Midwest: 66
- South: 165
- West: 55
64% of Apple Springs residents lived in the same house 5 years ago.
Out of people who lived in different houses, 39% lived in this county.
Out of people who lived in different counties, 85% lived in Texas.
Education attainment for males 25 years and older:
- No schooling: 5
- Nursery to 4th grade: 4
- 5th and 6th grade: 19
- 7th and 8th grade: 56
- 9th grade: 26
- 10th grade: 40
- 11th grade: 54
- 12th grade, no diploma: 46
- High school graduate (or equivalency): 318
- Less than 1 year of college: 72
- Some college more than 1 year, no degree: 97
- Associate degree: 40
- Bachelor's degree: 53
- Master's degree: 27
- Professional school degree: 0
- Doctorate degree: 0

Education attainment for females 25 years and older:
- No schooling: 6
- Nursery to 4th grade: 9
- 5th and 6th grade: 18
- 7th and 8th grade: 29
- 9th grade: 40
- 10th grade: 58
- 11th grade: 44
- 12th grade, no diploma: 25
- High school graduate (or equivalency): 393
- Less than 1 year of college: 85
- Some college more than 1 year, no degree: 102
- Associate degree: 21
- Bachelor's degree: 29
- Master's degree: 16
- Professional school degree: 6
- Doctorate degree: 0


Housing units in structures:
- One, detached: 846
- One, attached: 12
- Two: 6
- 3 or 4: 2
- Mobile homes: 436
- Boats, RVs, vans, etc.: 16
Median worth of mobile homes: $72,524
Housing units lacking complete kitchen facilities: 5.0%

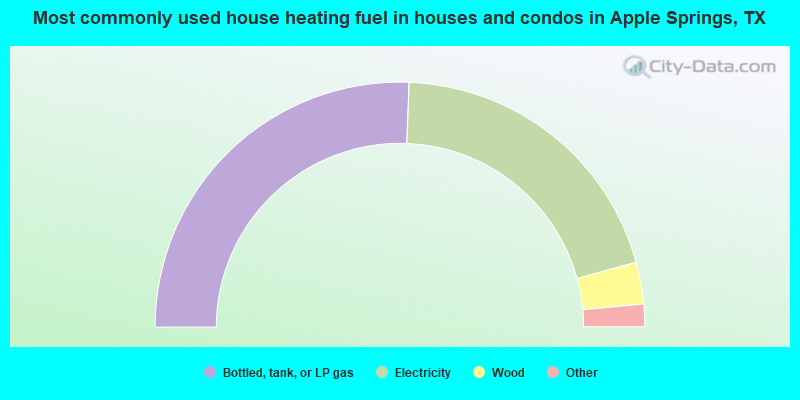
- 51.2%Bottled, tank, or LP gas
- 40.3%Electricity
- 5.5%Wood
- 2.4%Utility gas
- 0.6%Other fuel
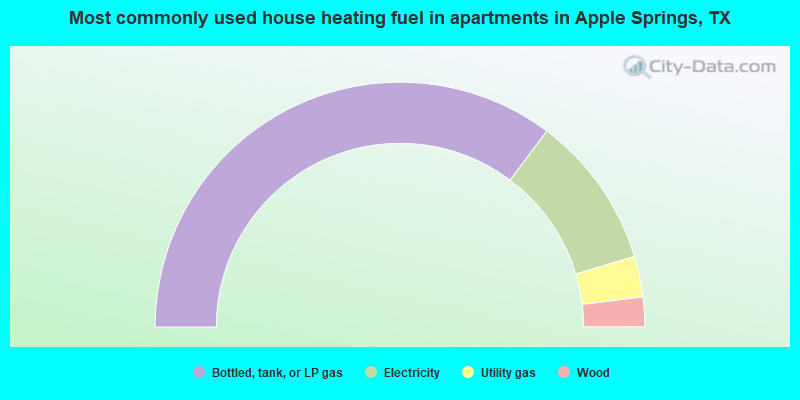
- 70.5%Bottled, tank, or LP gas
- 20.2%Electricity
- 5.4%Utility gas
- 3.9%Wood
Private vs. public school enrollment:
| Here: | 2.6% |
| Texas: | 6.8% |
| Here: | 0.0% |
| Texas: | 6.2% |
| Here: | 5.1% |
| Texas: | 15.4% |


