Housing density: 365 houses/condos per square mile
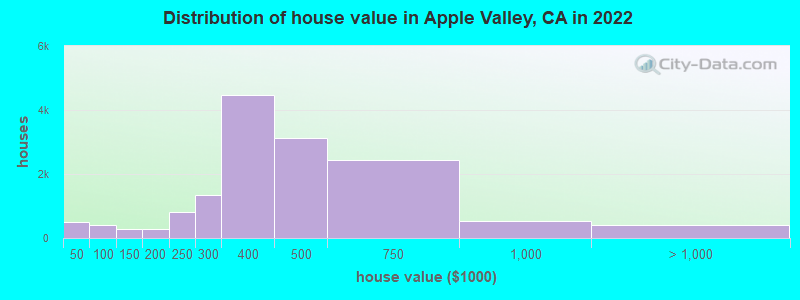
Median price asked for vacant for-sale houses and condos in 2022: $335,162.
Median contract rent in 2022: $1,192 (lower quartile is $974, upper quartile is $1,399)
Median rent asked for vacant for-rent units in 2022: $866
Median gross rent in Apple Valley, CA in 2022: $1,451
Housing units in Apple Valley with a mortgage: 12,044 (539 second mortgage, 5 home equity loan, 445 both second mortgage and home equity loan) Houses without a mortgage: 174
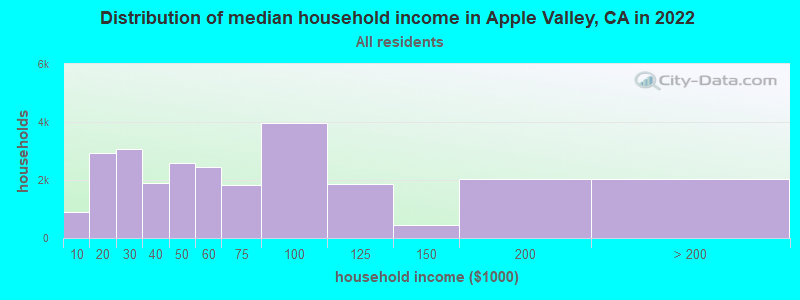
Median household income for houses/condos with a mortgage: $80,679
Median household income for apartments without a mortgage: $43,326
11,046 married couples with children.
5,870 single-parent households (192 men, 5,678 women).
73.4% of residents of Apple Valley speak English at home.
20.4% of residents speak Spanish at home (68% speak English very well, 19% speak English well, 11% speak English not well, 3% don't speak English at all).
1.1% of residents speak other Indo-European language at home (68% speak English very well, 23% speak English well, 7% speak English not well, 2% don't speak English at all).
2.3% of residents speak Asian or Pacific Island language at home (70% speak English very well, 13% speak English well, 13% speak English not well, 5% don't speak English at all).
1.1% of residents speak other language at home (74% speak English very well, 22% speak English well, 5% speak English not well).
Foreign born population: 9,027 (11.9%)
(48.7% of them are naturalized citizens)
Percentage of workers working in this county: 86.0% Number of people working at home: 2,511 (9.2% of all workers)
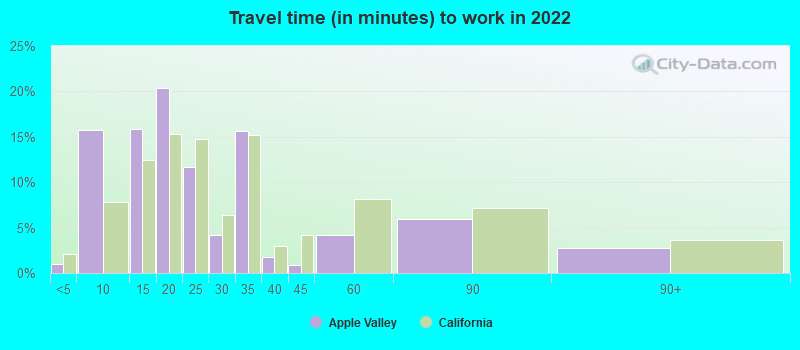
Travel time to work (commute)
Less than 5 minutes: 776
5 to 9 minutes: 4,558
10 to 14 minutes: 4,342
15 to 19 minutes: 3,898
20 to 24 minutes: 2,503
25 to 29 minutes: 138
30 to 34 minutes: 2,261
35 to 39 minutes: 0
40 to 44 minutes: 361
45 to 59 minutes: 868
60 to 89 minutes: 3,444
90 or more minutes: 3,506
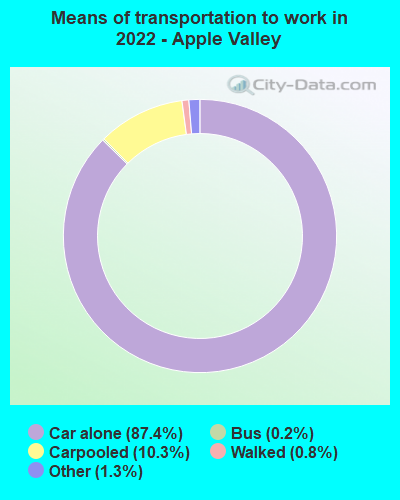
Means of transportation to work:
Drove a car alone: 15,393 (75.8%)
Carpooled: 1,944 (9.6%)
Bus: 44 (0.2%)
Taxi: 251 (1.2%)
Walked: 157 (0.8%)
Worked at home: 2,511 (12.4%)
Unemployment by race in 2022
Unemployment rate for White non-Hispanic residents
4.6%Males
Unemployment rate for Black residents
9.6%Males
18.8%Females
Unemployment rate for American Indian and Alaska Native residents
24.0%Females
Unemployment rate for Asian residents
2.7%Males
7.5%Females
Unemployment rate for other race residents
2.3%Males
5.7%Females
Unemployment rate for two or more race residents
14.6%Males
5.2%Females
Unemployment rate for Hispanic or Latino residents
10.1%Males
5.7%Females
Year of entry for the foreign-born population in Apple Valley, California
7372010 or later
1,6042000 to 2009
2,2191990 to 1999
1,1681980 to 1989
7931970 to 1979
1,404Before 1970
First ancestries reported:
American: 2,849 (6.6%)
German: 2,275 (5.2%)
English: 1,978 (4.6%)
Irish: 1,859 (4.3%)
European: 1,187 (2.7%)
Italian: 1,165 (2.7%)
Polish: 442 (1.0%)
Syrian: 326 (0.8%)
African: 324 (0.7%)
Scotch-Irish: 321 (0.7%)
Kenyan: 254 (0.6%)
Scottish: 225 (0.5%)
Canadian: 221 (0.5%)
Norwegian: 207 (0.5%)
Dutch: 205 (0.5%)
Swedish: 158 (0.4%)
French: 129 (0.3%)
Danish: 91 (0.2%)
Belizean: 89 (0.2%)
Afghan: 84 (0.2%)
Welsh: 71 (0.2%)
Romanian: 67 (0.2%)
Hungarian: 59 (0.1%)
Portuguese: 51 (0.1%)
Swiss: 51 (0.1%)
Ukrainian: 41 (0.09%)
French Canadian: 40 (0.09%)
Russian: 40 (0.09%)
British: 40 (0.09%)
Czech: 35 (0.08%)
Scandinavian: 24 (0.06%)
Lebanese: 21 (0.05%)
Austrian: 18 (0.04%)
Lithuanian: 17 (0.04%)
Armenian: 17 (0.04%)
Trinidadian and Tobagonian: 16 (0.04%)
Northern European: 14 (0.03%)
Nigerian: 14 (0.03%)
Iranian: 12 (0.03%)
Finnish: 11 (0.03%)
Egyptian: 6 (0.01%)
Czechoslovakian: 3 (0.01%)
Most common places of birth for foreign-born residents (%):
Mexico
Apple Valley:
47.9% (4,048)
California:
37.2% (3,881,193)
El Salvador
Apple Valley:
6.6% (554)
California:
4.2% (440,287)
Guatemala
Apple Valley:
6.3% (528)
California:
2.8% (290,436)
Philippines
Apple Valley:
5.3% (451)
California:
7.8% (818,297)
Kenya
Apple Valley:
3.8% (321)
California:
0.1% (12,503)
India
Apple Valley:
3.3% (277)
California:
5.2% (539,184)
Canada
Apple Valley:
2.9% (245)
California:
1.2% (127,477)
Germany
Apple Valley:
2.5% (207)
California:
0.7% (73,304)
Taiwan
Apple Valley:
2.1% (179)
California:
1.7% (176,274)
Syria
Apple Valley:
2.0% (173)
California:
0.3% (30,949)
Place of birth for U.S.-born residents:
This state: 54,094
Other state: 12,579
Northeast: 2,248
Midwest: 4,161
South: 2,917
West: 3,253
90.5% of Apple Valley residents lived in the same house 1 years ago. Out of people who lived in different houses, 42.3% lived in this county. Out of people who lived in different counties, 74.2% lived in California.
Apple Valley:
90.5%
State average:
88.9%
Education attainment for males 25 years and older:
No schooling: 199
Nursery to 4th grade: 186
5th and 6th grade: 600
7th and 8th grade: 23
9th grade: 675
10th grade: 78
11th grade: 1,069
12th grade, no diploma: 1,029
High school graduate (or equivalency): 8,219
Less than 1 year of college: 1,512
Some college more than 1 year, no degree: 5,124
Associate degree: 1,841
Bachelor's degree: 1,995
Master's degree: 1,466
Professional school degree: 328
Doctorate degree: 89
Education attainment for females 25 years and older:
No schooling: 848
Nursery to 4th grade: 63
5th and 6th grade: 135
7th and 8th grade: 759
9th grade: 463
10th grade: 91
11th grade: 157
12th grade, no diploma: 787
High school graduate (or equivalency): 6,980
Less than 1 year of college: 2,714
Some college more than 1 year, no degree: 4,528
Associate degree: 2,101
Bachelor's degree: 2,563
Master's degree: 1,432
Professional school degree: 371
Doctorate degree: 62
Housing units in structures:
One, detached: 20,500
One, attached: 746
Two: 1,258
3 or 4: 2,213
5 to 9: 687
10 to 19: 306
50 or more: 243
Mobile homes: 806
Median worth of mobile homes: $64,095
Housing units lacking complete plumbing facilities in 2022: 0.9%
Housing units lacking complete kitchen facilities in 2022: 1.3%