Applewood, CO (Colorado) Houses and Residents
| Applewood: | $775,826 |
| Colorado: | $531,100 |
Total population: 7,160 (All urban)
Houses: 3,479 (3,364 occupied: 2,627 owner occupied, 710 renter occupied)
| % of renters here: | 21% |
| State: | 34% |
Housing density: 720 houses/condos per square mile
Median price asked for vacant for-sale houses and condos in 2022 in this county: $710,413.
Median contract rent in 2022: $1,947 (lower quartile is $1,566, upper quartile is over $2,000)
Median rent asked for vacant for-rent units in 2022: $3,078
Median gross rent in Applewood, CO in 2022: over $2,000
Housing units in Applewood with a mortgage: 1,858 (412 second mortgage, 0 home equity loan, 378 both second mortgage and home equity loan)
Houses without a mortgage: 21
Median household income for houses/condos with a mortgage: $159,959
Median household income for apartments without a mortgage: $88,150
Median monthly housing costs: $1,986
Compare current foreclosures near Applewood, CO:
| Photo | Address | Area | Beds / Baths | Price | Details |
|---|---|---|---|---|---|

|
#1
S Columbine Dr
Morrison, CO 80465
|
2,280 sq. feet
|
2 baths 3 beds |
$529,900
|
show details |

|
#2
Curtis St
Denver, CO 80205
|
822 sq. feet
|
3 baths 4 beds |
$499,900
|
show details |

|
#3
S Fillmore Cir
Littleton, CO 80122
|
1,036 sq. feet
|
3 baths 3 beds |
show details | |

|
#4
E Exposition Ave Apartme
Aurora, CO 80012
|
444 sq. feet
|
1 baths 1 beds |
show details | |

|
#5
W Alaska Pl
Denver, CO 80219
|
1,646 sq. feet
|
2 baths 2 beds |
show details | |

|
#6
W 74th Ave
Arvada, CO 80007
|
1,926 sq. feet
|
2 baths 4 beds |
show details | |

|
#7
E Mississippi Ave
Denver, CO 80247
|
1,194 sq. feet
|
2 baths 2 beds |
show details | |

|
#8
S Estes Way
Denver, CO 80227
|
1,672 sq. feet
|
3 baths 4 beds |
show details | |

|
#9
Niagara St
Commerce City, CO 80022
|
1,092 sq. feet
|
1 baths 4 beds |
show details | |

|
#10
Lafayette St
Denver, CO 80229
|
1,384 sq. feet
|
2 baths 3 beds |
show details |
| Photo | Address | Area | Beds / Baths | Price | Details |
|---|---|---|---|---|---|

|
#11
E Mansfield Ave
Denver, CO 80237
|
1,584 sq. feet
|
2 baths 3 beds |
show details | |

|
#12
W Hinsdale Dr
Littleton, CO 80127
|
1,923 sq. feet
|
2 baths 2 beds |
show details | |

|
#13
E 75th Pl
Commerce City, CO 80022
|
1,624 sq. feet
|
1 baths 3 beds |
show details | |

|
#14
W 75th Way
Arvada, CO 80005
|
1,452 sq. feet
|
1 baths 3 beds |
show details | |

|
#15
Hobbit Ln
Westminster, CO 80031
|
2,017 sq. feet
|
3 baths 4 beds |
show details | |

|
#16
W Woodard Cir
Denver, CO 80227
|
3,221 sq. feet
|
3 baths 3 beds |
show details | |

|
#17
Meade St
Denver, CO 80221
|
1,855 sq. feet
|
2 baths 2 beds |
show details | |

|
#18
Jackson Pl
Denver, CO 80241
|
918 sq. feet
|
1 baths 3 beds |
show details | |

|
#19
Vaquero Dr
Boulder, CO 80303
|
8,121 sq. feet
|
3 baths 4 beds |
show details | |

|
#20
S Robb St
Littleton, CO 80127
|
1,914 sq. feet
|
2 baths 4 beds |
show details |
| Photo | Address | Area | Beds / Baths | Price | Details |
|---|---|---|---|---|---|

|
#21
Nome St
Aurora, CO 80010
|
736 sq. feet
|
1 baths 2 beds |
show details | |

|
#22
W Vail Pass
Littleton, CO 80127
|
1,562 sq. feet
|
1 baths 3 beds |
show details | |

|
#23
S Chase Ct
Denver, CO 80232
|
1,118 sq. feet
|
2 baths 4 beds |
show details | |

|
#24
S Galapago St
Englewood, CO 80110
|
1,040 sq. feet
|
2 baths 3 beds |
show details | |

|
#25
S Stuart St
Denver, CO 80219
|
639 sq. feet
|
1 baths 2 beds |
show details | |

|
#26
N Valentia St
Denver, CO 80238
|
1,574 sq. feet
|
3 baths 2 beds |
show details | |

|
#27
W Dartmouth Ave
Denver, CO 80227
|
1,351 sq. feet
|
3 baths 3 beds |
show details | |

|
#28
E 77th Pl
Commerce City, CO 80022
|
672 sq. feet
|
1 baths 2 beds |
show details | |

|
#29
E Ohio Pl
Aurora, CO 80012
|
1,390 sq. feet
|
2 baths 3 beds |
show details | |

|
#30
Everett St
Arvada, CO 80005
|
1,484 sq. feet
|
2 baths 3 beds |
show details |
| Photo | Address | Area | Beds / Baths | Price | Details |
|---|---|---|---|---|---|

|
#31
Fenton St
Arvada, CO 80003
|
1,306 sq. feet
|
2 baths 3 beds |
show details | |

|
#32
S Depew St
Denver, CO 80226
|
1,097 sq. feet
|
1 baths 4 beds |
show details | |

|
#33
S Chase Dr
Denver, CO 80226
|
1,581 sq. feet
|
2 baths 6 beds |
show details | |

|
#34
Mulberry Cir
Broomfield, CO 80020
|
1,216 sq. feet
|
1 baths 3 beds |
show details | |

|
#35
Emerson St
Denver, CO 80229
|
890 sq. feet
|
1 baths 2 beds |
show details | |

|
#36
Ash Ct
Denver, CO 80229
|
1,484 sq. feet
|
2 baths 4 beds |
show details | |

|
#37
Gaylord St
Denver, CO 80229
|
1,280 sq. feet
|
1 baths 3 beds |
show details | |

|
#38
Lewis St
Arvada, CO 80004
|
1,402 sq. feet
|
1 baths 3 beds |
show details | |

|
#39
King Ct
Westminster, CO 80031
|
1,542 sq. feet
|
4 baths 3 beds |
show details | |

|
#40
Newland St
Denver, CO 80214
|
1,178 sq. feet
|
2 baths 3 beds |
show details |
| Photo | Address | Area | Beds / Baths | Price | Details |
|---|---|---|---|---|---|

|
#41
W 14th Ave Apt 1
Denver, CO 80214
|
869 sq. feet
|
1 baths 2 beds |
show details | |

|
#42
S Van Gordon St
Denver, CO 80228
|
1,630 sq. feet
|
2 baths 3 beds |
show details | |

|
#43
S Merriam Dr
Evergreen, CO 80439
|
1,949 sq. feet
|
1 baths 3 beds |
show details | |

|
#44
W 61st Ave
Arvada, CO 80004
|
1,183 sq. feet
|
1 baths 5 beds |
show details | |

|
#45
White Oak St
Littleton, CO 80129
|
2,130 sq. feet
|
3 baths 4 beds |
show details | |

|
#46
W 67th Pl
Arvada, CO 80004
|
2,032 sq. feet
|
2 baths 3 beds |
show details | |

|
#47
Harris St
Denver, CO 80229
|
1,386 sq. feet
|
2 baths 3 beds |
show details | |

|
#48
Ingalls St
Denver, CO 80226
|
1,083 sq. feet
|
1 baths 3 beds |
show details | |

|
#49
Clayton St
Denver, CO 80216
|
1,107 sq. feet
|
2 baths 3 beds |
show details | |

|
Check over 1 million property listings on Foreclosure.com!
|
browse all offers | |||

Latest news about housing in Applewood, CO collected exclusively by city-data.com from local newspapers, TV, and radio stations

 | Are there any Denver burbs with older homes and tree lined streets? (53 replies) |
| Mid Century Modern Houses or similar in Close-in Suburbs? (31 replies) |
| One story ranch homes (22 replies) |
| Denver Real Estate Discussion / Opinion Thread (NO Data Charts) (1076 replies) |
| Denver Real Estate News (Data and Charts only) (425 replies) |
| Cute small-town feel near Denver (7 replies) |

Median year apartment built: 1983
Household type by relationship:
Households: 7,924- Male householders: 1,777 (520 living alone), Female householders: 1,493 (458 living alone)
1,760 spouses (1,760 opposite-sex spouses), 204 unmarried partners, (198 opposite-sex unmarried partners), 1,911 children (1,815 natural, 8 adopted, 87 stepchildren), 180 grandchildren, 19 brothers or sisters, 40 parents, 0 foster children, 175 other relatives, 322 non-relatives
- In group quarters: 37
Size of family households: 1,084 2-persons, 346 3-persons, 374 4-persons, 131 5-persons, 36 6-persons, 42 7-or-more-persons.
Size of nonfamily households: 1,028 1-person, 240 2-persons, 28 3-persons, 12 4-persons, 7 5-persons.
1,154 married couples with children.
82 single-parent households (32 men, 50 women).
89.9% of residents of Applewood speak English at home.
7.8% of residents speak Spanish at home (78% speak English very well, 6% speak English well, 16% speak English not well).
1.1% of residents speak other Indo-European language at home (69% speak English very well, 31% speak English well).
0.3% of residents speak Asian or Pacific Island language at home (68% speak English well, 32% speak English not well).
0.5% of residents speak other language at home (100% speak English very well).
Foreign born population: 455 (5.7%)
(71.6% of them are naturalized citizens)
| Here: | 8.4 |
| State: | 6.8 |
| Here: | 3.4 |
| State: | 4.0 |

- Bedrooms in owner-occupied houses and condos in Applewood, Colorado
- 0no bedroom
- 01 bedroom
- 1512 bedrooms
- 8253 bedrooms
- 8484 bedrooms
- 8035+ bedrooms

- Bedrooms in renter-occupied apartments in Applewood, Colorado
- 35no bedroom
- 3241 bedroom
- 1342 bedrooms
- 743 bedrooms
- 1104 bedrooms
- 335+ bedrooms

- Cars and other vehicles available in Applewood in owner-occupied houses/condos
- 56no vehicle
- 6021 vehicle
- 1,0712 vehicles
- 5803 vehicles
- 2234 vehicles
- 965+ vehicles

- Cars and other vehicles available in Applewood in renter-occupied apartments
- 52no vehicle
- 2491 vehicle
- 3052 vehicles
- 503 vehicles
- 134 vehicles
- 435+ vehicles

- Rooms in owner-occupied houses in Applewood, Colorado
- 01 room
- 02 rooms
- 03 rooms
- 584 rooms
- 1585 rooms
- 1796 rooms
- 4087 rooms
- 5478 rooms
- 1,2779+ rooms

- Rooms in renter-occupied apartments in Applewood, Colorado
- 351 room
- 1272 rooms
- 2283 rooms
- 294 rooms
- 235 rooms
- 1316 rooms
- 287 rooms
- 538 rooms
- 579+ rooms


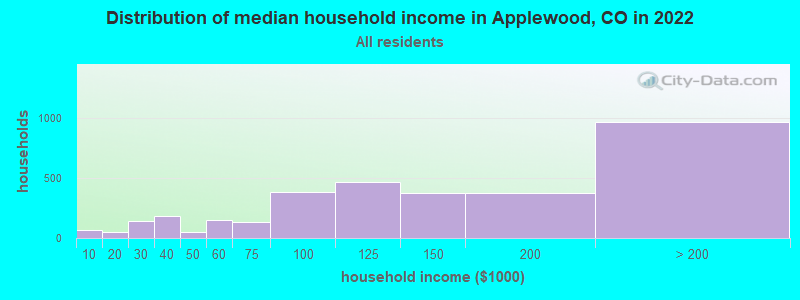
Applewood, CO household income distribution

- 69Less than $10,000
- 53$10,000 to $19,999
- 140$20,000 to $29,999
- 181$30,000 to $39,999
- 51$40,000 to $49,999
- 153$50,000 to $59,999
- 133$60,000 to $74,999
- 388$75,000 to $99,999
- 470$100,000 to $124,999
- 372$125,000 to $149,999
- 374$150,000 to $199,999
- 968$200,000 or more
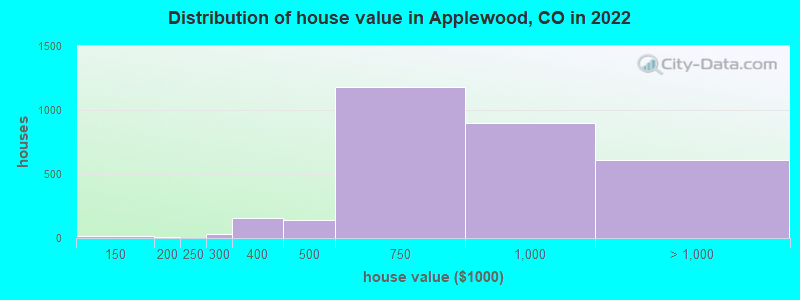
Home value of owner - occupied houses in 2022 in Applewood, CO
-
- 12$125,000 to $149,999
- 9$175,000 to $199,999
- 30$250,000 to $299,999
- 152$300,000 to $399,999
- 140$400,000 to $499,999
- 1,176$500,000 to $749,999
- 898$750,000 to $999,999
- 545$1,000,000 to $1,499,999
- 53$1,500,000 to $1,999,999
- 8$2,000,000 or more
Rent paid by renters in 2022 in Applewood, CO
-
- 68$800 to $899
- 63$900 to $999
- 10$1,000 to $1,249
- 233$1,500 to $1,999
- 252$2,000 to $2,499
- 56$2,500 to $2,999
- 7$3,000 to $3,499
- 9$3,500 or more
- 21No cash rent

Percentage of workers working in this county: 66.8%
Number of people working at home: 1,076 (24.2% of all workers)
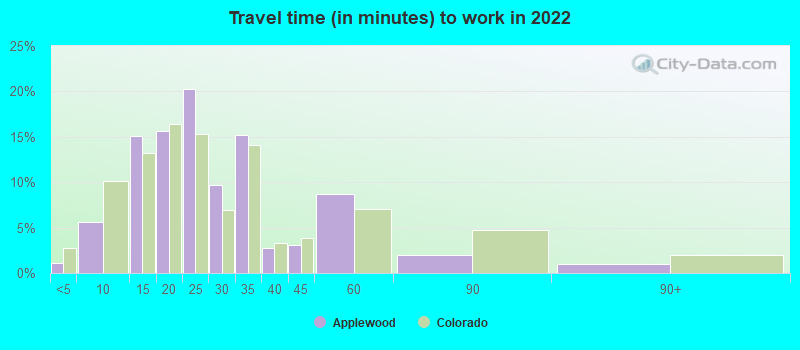
Travel time to work (commute)
- Less than 5 minutes: 41
- 5 to 9 minutes: 465
- 10 to 14 minutes: 436
- 15 to 19 minutes: 435
- 20 to 24 minutes: 510
- 25 to 29 minutes: 156
- 30 to 34 minutes: 573
- 35 to 39 minutes: 168
- 40 to 44 minutes: 163
- 45 to 59 minutes: 137
- 60 to 89 minutes: 256
- 90 or more minutes: 41
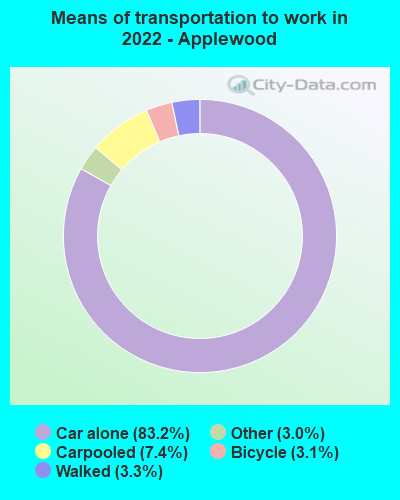
Means of transportation to work:
- Drove a car alone: 2,018 (58.2%)
- Carpooled: 176 (5.1%)
- Taxi: 81 (2.3%)
- Bicycle: 47 (1.4%)
- Walked: 79 (2.3%)
- Worked at home: 1,076 (31.0%)
- Unemployment by race in 2022
- Unemployment rate for White non-Hispanic residents
- 6.2%Males
- 4.4%Females
- Unemployment rate for American Indian and Alaska Native residents
- 19.4%Males
- Unemployment rate for Asian residents
- 21.4%Females

- Year of entry for the foreign-born population in Applewood, Colorado
- 322010 or later
- 1522000 to 2009
- 1221990 to 1999
- 511980 to 1989
- 381970 to 1979
- 83Before 1970
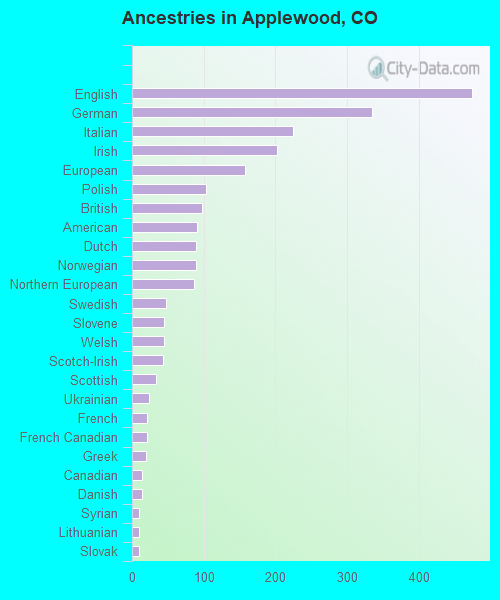
First ancestries reported:
- English: 474 (16.4%)
- German: 335 (11.6%)
- Italian: 224 (7.7%)
- Irish: 202 (7.0%)
- European: 157 (5.4%)
- Polish: 103 (3.6%)
- British: 98 (3.4%)
- American: 90 (3.1%)
- Dutch: 89 (3.1%)
- Norwegian: 89 (3.1%)
- Northern European: 87 (3.0%)
- Swedish: 48 (1.7%)
- Slovene: 45 (1.6%)
- Welsh: 44 (1.5%)
- Scotch-Irish: 43 (1.5%)
- Scottish: 34 (1.2%)
- Ukrainian: 24 (0.8%)
- French: 21 (0.7%)
- French Canadian: 21 (0.7%)
- Greek: 20 (0.7%)
- Canadian: 14 (0.5%)
- Danish: 14 (0.5%)
- Syrian: 10 (0.3%)
- Lithuanian: 10 (0.3%)
- Slovak: 10 (0.3%)
- Finnish: 7 (0.2%)
- Russian: 7 (0.2%)
- Alsatian: 7 (0.2%)
- Australian: 7 (0.2%)
- Iranian: 6 (0.2%)
- Scandinavian: 4 (0.1%)
- Belgian: 3 (0.1%)
- Hungarian: 1 (0.03%)
Most common places of birth for foreign-born residents (%):
| Applewood: | 39.1% (197) |
| Colorado: | 38.3% (209,491) |
| Applewood: | 7.5% (38) |
| Colorado: | 0.1% (368) |
| Applewood: | 7.1% (36) |
| Colorado: | 2.7% (15,026) |
| Applewood: | 6.2% (31) |
| Colorado: | 0.5% (2,472) |
| Applewood: | 5.4% (27) |
| Colorado: | 1.0% (5,214) |
| Applewood: | 5.2% (26) |
| Colorado: | 1.1% (5,799) |
| Applewood: | 3.0% (15) |
| Colorado: | 2.5% (13,706) |
| Applewood: | 3.0% (15) |
| Colorado: | 0.9% (4,810) |
| Applewood: | 2.6% (13) |
| Colorado: | 3.0% (16,616) |
| Applewood: | 2.4% (12) |
| Colorado: | 2.9% (15,981) |
| Applewood: | 2.2% (11) |
| Colorado: | 1.2% (6,672) |
| Applewood: | 2.2% (11) |
| Colorado: | 0.1% (302) |
| Applewood: | 2.0% (10) |
| Colorado: | 3.3% (17,998) |
| Applewood: | 2.0% (10) |
| Colorado: | 0.6% (3,144) |
| Applewood: | 1.8% (9) |
| Colorado: | 0.4% (1,938) |
Place of birth for U.S.-born residents:
- This state: 3,344
- Other state: 3,960
- Northeast: 528
- Midwest: 1,761
- South: 804
- West: 860
84.6% of Applewood residents lived in the same house 1 years ago.
Out of people who lived in different houses, 19.6% lived in this county.
Out of people who lived in different counties, 80.2% lived in Colorado.
| Applewood: | 84.6% |
| State average: | 83.6% |
Education attainment for males 25 years and older:
- No schooling: 0
- Nursery to 4th grade: 0
- 5th and 6th grade: 0
- 7th and 8th grade: 0
- 9th grade: 0
- 10th grade: 4
- 11th grade: 7
- 12th grade, no diploma: 42
- High school graduate (or equivalency): 373
- Less than 1 year of college: 105
- Some college more than 1 year, no degree: 341
- Associate degree: 127
- Bachelor's degree: 1,400
- Master's degree: 496
- Professional school degree: 168
- Doctorate degree: 90

Education attainment for females 25 years and older:
- No schooling: 89
- Nursery to 4th grade: 0
- 5th and 6th grade: 0
- 7th and 8th grade: 0
- 9th grade: 9
- 10th grade: 18
- 11th grade: 5
- 12th grade, no diploma: 5
- High school graduate (or equivalency): 296
- Less than 1 year of college: 156
- Some college more than 1 year, no degree: 362
- Associate degree: 237
- Bachelor's degree: 1,060
- Master's degree: 705
- Professional school degree: 115
- Doctorate degree: 53


Housing units in structures:
- One, detached: 2,543
- One, attached: 349
- 3 or 4: 21
- 5 to 9: 76
- 10 to 19: 195
- 20 to 49: 41
- 50 or more: 190
- Mobile homes: 60
Housing units lacking complete kitchen facilities in 2022: 1.5%
House/condo owner moved in on average 12 years ago
Renter moved in on average 4 years ago

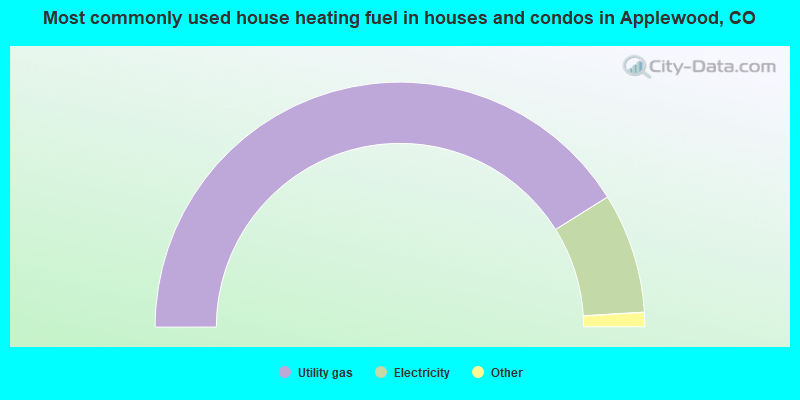
- 82.2%Utility gas
- 15.9%Electricity
- 0.9%Wood
- 0.7%Bottled, tank, or LP gas
- 0.3%Solar energy
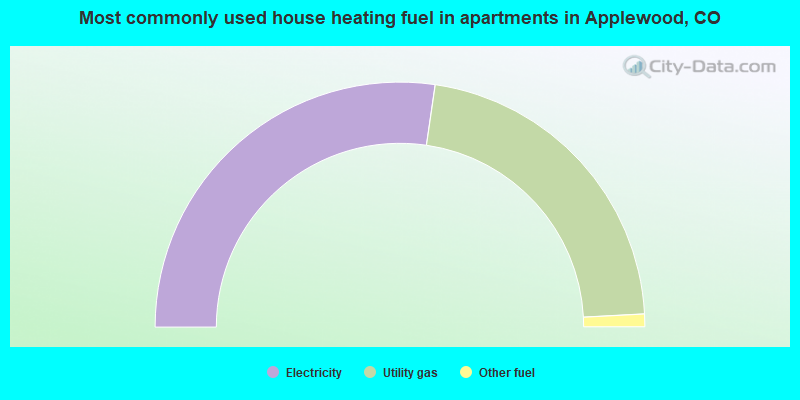
- 54.6%Electricity
- 43.7%Utility gas
- 1.7%Other fuel
Private vs. public school enrollment:
| Here: | 11.9% |
| Colorado: | 11.4% |
| Here: | 17.4% |
| Colorado: | 8.5% |
| Here: | 8.5% |
| Colorado: | 14.0% |


