Housing density: 1,949 houses/condos per square mile
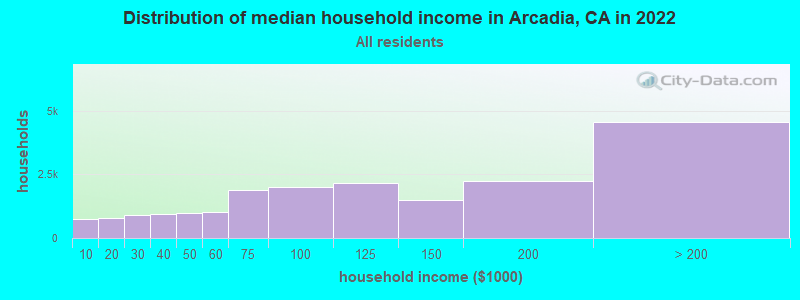
Median price asked for vacant for-sale houses and condos in 2022: $2,093,008.
Median contract rent in 2022: $1,888 (lower quartile is $1,495, upper quartile is over $2,000)
Median rent asked for vacant for-rent units in 2022: $2,223
Median gross rent in Arcadia, CA in 2022: $1,997
Housing units in Arcadia with a mortgage: 6,134 (564 second mortgage, 14 home equity loan, 542 both second mortgage and home equity loan) Houses without a mortgage: 59
Median household income for houses/condos with a mortgage: $169,532
Median household income for apartments without a mortgage: $120,001
7,665 married couples with children.
2,707 single-parent households (404 men, 2,303 women).
43.3% of residents of Arcadia speak English at home.
7.7% of residents speak Spanish at home (79% speak English very well, 11% speak English well, 8% speak English not well, 2% don't speak English at all).
4.0% of residents speak other Indo-European language at home (80% speak English very well, 18% speak English well, 2% speak English not well).
44.8% of residents speak Asian or Pacific Island language at home (47% speak English very well, 28% speak English well, 18% speak English not well, 6% don't speak English at all).
0.2% of residents speak other language at home (67% speak English very well, 17% speak English well, 17% don't speak English at all).
Foreign born population: 23,811 (43.3%)
(68.3% of them are naturalized citizens)
Percentage of workers working in this county: 94.3% Number of people working at home: 5,885 (23.8% of all workers)
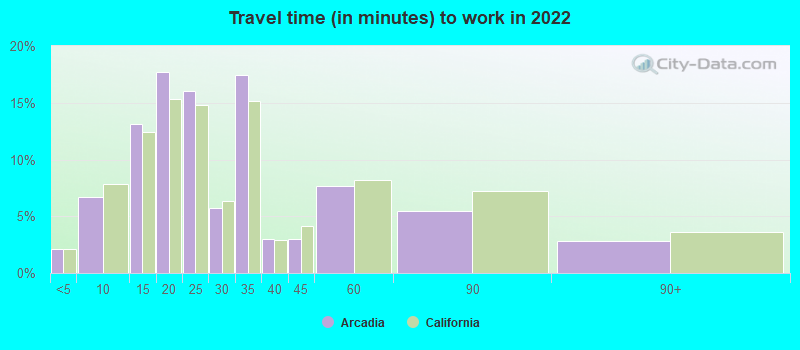
Travel time to work (commute)
Less than 5 minutes: 246
5 to 9 minutes: 1,175
10 to 14 minutes: 2,470
15 to 19 minutes: 2,128
20 to 24 minutes: 3,112
25 to 29 minutes: 987
30 to 34 minutes: 3,141
35 to 39 minutes: 550
40 to 44 minutes: 1,154
45 to 59 minutes: 2,250
60 to 89 minutes: 1,735
90 or more minutes: 373
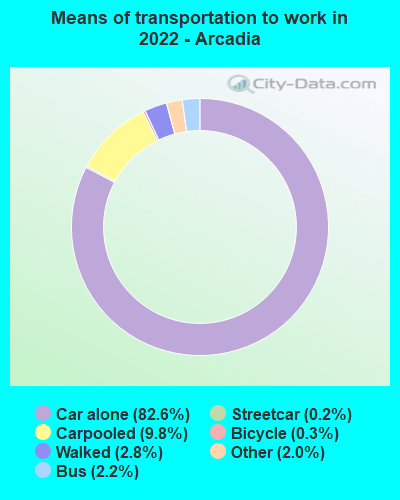
Means of transportation to work:
Drove a car alone: 19,115 (66.0%)
Carpooled: 2,511 (8.7%)
Bus: 461 (1.6%)
Subway or elevated rail: 41 (0.1%)
Long-distance train or commuter rail: 7 (0.0%)
Light rail, streetcar or trolley: 9 (0.0%)
Taxi: 496 (1.7%)
Bicycle: 68 (0.2%)
Walked: 690 (2.4%)
Worked at home: 5,885 (20.3%)
Unemployment by race in 2022
Unemployment rate for White non-Hispanic residents
2.3%Males
4.1%Females
Unemployment rate for Black residents
2.8%Males
Unemployment rate for Asian residents
4.4%Males
3.2%Females
Unemployment rate for other race residents
2.3%Females
Unemployment rate for two or more race residents
9.1%Males
1.6%Females
Unemployment rate for Hispanic or Latino residents
6.0%Males
8.2%Females
Year of entry for the foreign-born population in Arcadia, California
6,4452010 or later
4,1952000 to 2009
4,3581990 to 1999
7,9321980 to 1989
3,3411970 to 1979
2,116Before 1970
First ancestries reported:
Irish: 699 (1.8%)
Armenian: 501 (1.3%)
English: 471 (1.2%)
Italian: 461 (1.2%)
German: 433 (1.1%)
European: 331 (0.9%)
American: 328 (0.9%)
Iranian: 169 (0.4%)
Syrian: 145 (0.4%)
Greek: 122 (0.3%)
Russian: 115 (0.3%)
Scottish: 108 (0.3%)
Swedish: 103 (0.3%)
French: 98 (0.3%)
Bulgarian: 96 (0.3%)
Brazilian: 93 (0.2%)
Scandinavian: 79 (0.2%)
West Indian: 69 (0.2%)
French Canadian: 67 (0.2%)
Egyptian: 66 (0.2%)
Dutch: 61 (0.2%)
Lebanese: 58 (0.2%)
Norwegian: 55 (0.1%)
Scotch-Irish: 37 (0.10%)
Polish: 32 (0.08%)
British: 32 (0.08%)
Portuguese: 31 (0.08%)
Czech: 28 (0.07%)
Danish: 24 (0.06%)
Canadian: 24 (0.06%)
Eastern European: 22 (0.06%)
Austrian: 22 (0.06%)
African: 20 (0.05%)
Ukrainian: 20 (0.05%)
Arab: 17 (0.04%)
Ugandan: 17 (0.04%)
Hungarian: 16 (0.04%)
Croatian: 12 (0.03%)
Finnish: 11 (0.03%)
Palestinian: 10 (0.03%)
Northern European: 10 (0.03%)
Jamaican: 9 (0.02%)
Romanian: 8 (0.02%)
Most common places of birth for foreign-born residents (%):
China, excluding Hong Kong and Taiwan
Arcadia:
33.5% (7,972)
California:
6.6% (684,672)
Taiwan
Arcadia:
18.6% (4,425)
California:
1.7% (176,274)
Hong Kong
Arcadia:
7.3% (1,730)
California:
1.0% (105,215)
Vietnam
Arcadia:
6.2% (1,467)
California:
4.9% (512,335)
Philippines
Arcadia:
5.7% (1,361)
California:
7.8% (818,297)
India
Arcadia:
3.8% (899)
California:
5.2% (539,184)
Korea
Arcadia:
3.3% (787)
California:
3.0% (315,248)
Mexico
Arcadia:
2.9% (695)
California:
37.2% (3,881,193)
Burma (Myanmar)
Arcadia:
1.8% (420)
California:
0.3% (28,176)
Place of birth for U.S.-born residents:
This state: 25,597
Other state: 4,890
Northeast: 1,655
Midwest: 1,180
South: 1,180
West: 868
90.4% of Arcadia residents lived in the same house 1 years ago. Out of people who lived in different houses, 43.7% lived in this county. Out of people who lived in different counties, 59.5% lived in California.
Arcadia:
90.4%
State average:
88.9%
Education attainment for males 25 years and older:
No schooling: 424
Nursery to 4th grade: 0
5th and 6th grade: 84
7th and 8th grade: 219
9th grade: 114
10th grade: 80
11th grade: 52
12th grade, no diploma: 459
High school graduate (or equivalency): 3,230
Less than 1 year of college: 418
Some college more than 1 year, no degree: 1,844
Associate degree: 1,200
Bachelor's degree: 6,710
Master's degree: 2,748
Professional school degree: 1,365
Doctorate degree: 675
Education attainment for females 25 years and older:
No schooling: 610
Nursery to 4th grade: 64
5th and 6th grade: 118
7th and 8th grade: 140
9th grade: 93
10th grade: 27
11th grade: 134
12th grade, no diploma: 332
High school graduate (or equivalency): 3,667
Less than 1 year of college: 638
Some college more than 1 year, no degree: 1,923
Associate degree: 1,948
Bachelor's degree: 7,089
Master's degree: 3,001
Professional school degree: 777
Doctorate degree: 296
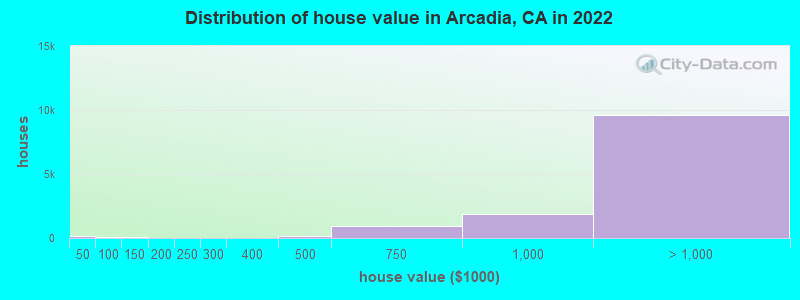
Housing units in structures:
One, detached: 12,469
One, attached: 1,919
Two: 331
3 or 4: 1,075
5 to 9: 1,617
10 to 19: 1,402
20 to 49: 2,003
50 or more: 528
Mobile homes: 63
Median worth of mobile homes: $221,954
Housing units lacking complete plumbing facilities in 2022: 1.7%
Housing units lacking complete kitchen facilities in 2022: 5.8%
House/condo owner moved in on average 17 years ago