Arcata, CA (California) Houses and Residents
| Arcata: | $458,541 |
| California: | $715,900 |
Total population: 17,730 (Urban population: 16,535 (all inside urban clusters), Rural population: 179 (all nonfarm))
Houses: 8,375 (7,556 occupied: 2,593 owner occupied, 5,217 renter occupied)
| % of renters here: | 67% |
| State: | 44% |
Housing density: 911 houses/condos per square mile
Median price asked for vacant for-sale houses and condos in 2022 in this county: $398,519.
Median contract rent in 2022: $1,102 (lower quartile is $898, upper quartile is $1,432)
Median rent asked for vacant for-rent units in 2022: $942
Median gross rent in Arcata, CA in 2022: $1,225
Housing units in Arcata with a mortgage: 1,315 (290 second mortgage, 14 home equity loan, 336 both second mortgage and home equity loan)
Houses without a mortgage: 81
Median household income for houses/condos with a mortgage: $104,153
Median household income for apartments without a mortgage: $47,332
Median monthly housing costs: $1,165
Compare current foreclosures near Arcata, CA:
| Photo | Address | Area | Beds / Baths | Price | Details |
|---|---|---|---|---|---|

|
#1
18th St # D
Arcata, CA 95521
|
- sq. feet
|
- baths - beds |
show details | |

|
#2
Spear Ave
Arcata, CA 95521
|
- sq. feet
|
- baths - beds |
show details | |

|
#3
Escarda Ct
Arcata, CA 95521
|
- sq. feet
|
- baths - beds |
show details | |

|
#4
Myrtle Ave
Eureka, CA 95501
|
2,817 sq. feet
|
3 baths 4 beds |
show details | |

|
#5
Lincoln St
Eureka, CA 95501
|
875 sq. feet
|
1 baths 3 beds |
show details | |

|
#6
Prairie Ave
Eureka, CA 95501
|
1,488 sq. feet
|
2 baths 3 beds |
show details | |

|
#7
Union St
Eureka, CA 95503
|
- sq. feet
|
2 baths 3 beds |
show details | |

|
#8
Little Fairfield St
Eureka, CA 95503
|
- sq. feet
|
2 baths 3 beds |
show details | |

|
#9
Golden West Ct Apt C
Eureka, CA 95503
|
- sq. feet
|
- baths - beds |
show details | |

|
#10
Beechwood Dr
Eureka, CA 95503
|
- sq. feet
|
- baths - beds |
show details |
| Photo | Address | Area | Beds / Baths | Price | Details |
|---|---|---|---|---|---|

|
#11
Alpha St
Eureka, CA 95503
|
- sq. feet
|
- baths - beds |
show details | |

|
#12
California St
Eureka, CA 95501
|
- sq. feet
|
- baths - beds |
show details | |

|
#13
8th St # 128
Eureka, CA 95501
|
- sq. feet
|
- baths - beds |
show details | |

|
#14
Stagecoach Rd
Trinidad, CA 95570
|
- sq. feet
|
- baths - beds |
show details | |

|
#15
Dean St Apt 11
Eureka, CA 95501
|
- sq. feet
|
- baths - beds |
show details | |

|
#16
Golf Course Rd
Bayside, CA 95524
|
- sq. feet
|
- baths - beds |
show details | |

|
#17
Larissa Cir
Mckinleyville, CA 95519
|
- sq. feet
|
- baths - beds |
show details | |

|
#18
Windy Rd
Mckinleyville, CA 95519
|
- sq. feet
|
- baths - beds |
show details | |

|
#19
Mckinleyville Ave
Mckinleyville, CA 95519
|
- sq. feet
|
- baths - beds |
show details | |

|
#20
Wrigley Rd
Eureka, CA 95503
|
- sq. feet
|
- baths - beds |
show details |
| Photo | Address | Area | Beds / Baths | Price | Details |
|---|---|---|---|---|---|

|
#21
Kipling Dr
Eureka, CA 95503
|
- sq. feet
|
- baths - beds |
show details | |

|
#22
Paradise Ln
Eureka, CA 95503
|
- sq. feet
|
- baths - beds |
show details | |

|
#23
Myrtle Ave
Eureka, CA 95503
|
- sq. feet
|
- baths - beds |
show details | |

|
#24
Northridge Rd
Eureka, CA 95503
|
- sq. feet
|
- baths - beds |
show details | |

|
#25
Myrtle Ave Spc 22
Eureka, CA 95503
|
- sq. feet
|
- baths - beds |
show details | |

|
#26
Catherine Ct
Mckinleyville, CA 95519
|
- sq. feet
|
- baths - beds |
show details | |

|
#27
Cedar St
Eureka, CA 95503
|
- sq. feet
|
- baths - beds |
show details | |

|
#28
Highland Ave
Eureka, CA 95503
|
- sq. feet
|
- baths - beds |
show details | |

|
#29
Fieldbrook Rd
Mckinleyville, CA 95519
|
- sq. feet
|
- baths - beds |
show details | |

|
#30
D St
Eureka, CA 95503
|
- sq. feet
|
- baths - beds |
show details |
| Photo | Address | Area | Beds / Baths | Price | Details |
|---|---|---|---|---|---|

|
#31
Hodgson St
Eureka, CA 95503
|
- sq. feet
|
- baths - beds |
show details | |

|
#32
H St
Eureka, CA 95501
|
- sq. feet
|
- baths - beds |
show details | |

|
#33
C St
Eureka, CA 95501
|
- sq. feet
|
- baths - beds |
show details | |

|
#34
Lincoln St
Eureka, CA 95501
|
- sq. feet
|
- baths - beds |
show details | |

|
#35
Mcfarlan St
Eureka, CA 95501
|
- sq. feet
|
- baths - beds |
show details | |

|
#36
16th St
Eureka, CA 95501
|
- sq. feet
|
- baths - beds |
show details | |

|
#37
J St
Eureka, CA 95501
|
- sq. feet
|
- baths - beds |
show details | |

|
Check over 1 million property listings on Foreclosure.com!
|
browse all offers | |||

Latest news about housing in Arcata, CA collected exclusively by city-data.com from local newspapers, TV, and radio stations

 | Apartments in Eureka/Arcata (2 replies) |
| CA Cities, Counties and Metro Areas by Number of Affluent Households, 2005-2009 (22 replies) |
| Please help w/current Eureka/Arcata info re:schools, neighborhood, etc. (29 replies) |
| Afforable Housing market gems? (32 replies) |
| Whoa, what's with all the pit bulls in Arcata? (41 replies) |
| Gay Couple Looking for Small Liberal Forest Town in CA (35 replies) |

Median year apartment built: 1978
Household type by relationship:
Households: 18,383- Male householders: 3,489 (1,137 living alone), Female householders: 3,945 (1,453 living alone)
1,498 spouses (1,477 opposite-sex spouses), 1,164 unmarried partners, (1,123 opposite-sex unmarried partners), 3,698 children (3,528 natural, 76 adopted, 93 stepchildren), 23 grandchildren, 103 brothers or sisters, 24 parents, 26 foster children, 76 other relatives, 2,754 non-relatives
- In group quarters: 1,578
Size of family households: 1,540 2-persons, 651 3-persons, 544 4-persons, 76 5-persons, 29 6-persons, 26 7-or-more-persons.
Size of nonfamily households: 2,693 1-person, 1,840 2-persons, 207 3-persons, 142 4-persons, 87 5-persons.
890 married couples with children.
1,260 single-parent households (191 men, 1,069 women).
84.0% of residents of Arcata speak English at home.
8.6% of residents speak Spanish at home (94% speak English very well, 3% speak English well, 3% speak English not well, 1% don't speak English at all).
3.0% of residents speak other Indo-European language at home (55% speak English very well, 31% speak English well, 14% speak English not well).
3.3% of residents speak Asian or Pacific Island language at home (71% speak English very well, 23% speak English well, 3% speak English not well, 4% don't speak English at all).
0.1% of residents speak other language at home (100% speak English very well).
Foreign born population: 1,379 (7.5%)
(58.3% of them are naturalized citizens)
| Here: | 5.7 |
| State: | 6.0 |
| Here: | 3.7 |
| State: | 3.9 |

- Bedrooms in owner-occupied houses and condos in Arcata, California
- 58no bedroom
- 641 bedroom
- 7412 bedrooms
- 1,2253 bedrooms
- 4284 bedrooms
- 775+ bedrooms

- Bedrooms in renter-occupied apartments in Arcata, California
- 611no bedroom
- 1,3571 bedroom
- 1,9982 bedrooms
- 1,0283 bedrooms
- 1374 bedrooms
- 885+ bedrooms

- Cars and other vehicles available in Arcata in owner-occupied houses/condos
- 88no vehicle
- 9681 vehicle
- 1,1592 vehicles
- 2803 vehicles
- 264 vehicles
- 735+ vehicles

- Cars and other vehicles available in Arcata in renter-occupied apartments
- 481no vehicle
- 2,9001 vehicle
- 1,2442 vehicles
- 5023 vehicles
- 654 vehicles
- 255+ vehicles

- Rooms in owner-occupied houses in Arcata, California
- 581 room
- 222 rooms
- 1263 rooms
- 3834 rooms
- 5525 rooms
- 7156 rooms
- 3627 rooms
- 1088 rooms
- 2679+ rooms

- Rooms in renter-occupied apartments in Arcata, California
- 5561 room
- 8012 rooms
- 9983 rooms
- 1,3854 rooms
- 6585 rooms
- 4796 rooms
- 2407 rooms
- 578 rooms
- 439+ rooms


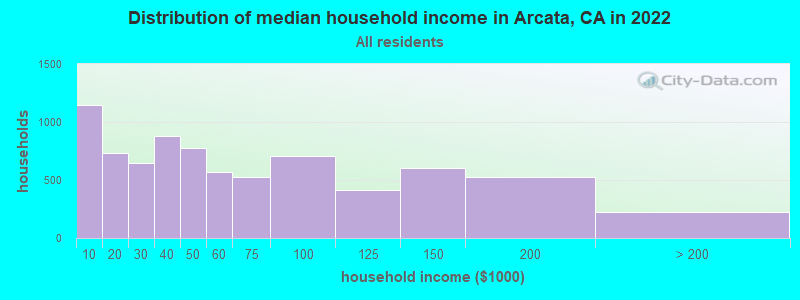
Arcata, CA household income distribution

- 1,146Less than $10,000
- 730$10,000 to $19,999
- 644$20,000 to $29,999
- 879$30,000 to $39,999
- 778$40,000 to $49,999
- 569$50,000 to $59,999
- 527$60,000 to $74,999
- 705$75,000 to $99,999
- 416$100,000 to $124,999
- 604$125,000 to $149,999
- 525$150,000 to $199,999
- 220$200,000 or more
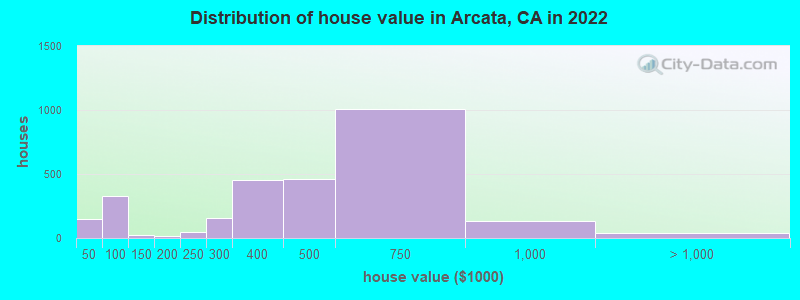
Home value of owner - occupied houses in 2022 in Arcata, CA
-
- 9Less than $10,000
- 33$10,000 to $14,999
- 9$15,000 to $19,999
- 37$25,000 to $29,999
- 58$40,000 to $49,999
- 91$50,000 to $59,999
- 96$70,000 to $79,999
- 71$80,000 to $89,999
- 12$90,000 to $99,999
- 19$100,000 to $124,999
- 18$150,000 to $174,999
- 45$200,000 to $249,999
- 157$250,000 to $299,999
- 455$300,000 to $399,999
- 461$400,000 to $499,999
- 1,010$500,000 to $749,999
- 134$750,000 to $999,999
- 40$1,000,000 to $1,499,999
Rent paid by renters in 2022 in Arcata, CA
-
- 50Less than $100
- 7$150 to $199
- 18$200 to $249
- 9$250 to $299
- 16$300 to $349
- 83$500 to $549
- 118$550 to $599
- 28$600 to $649
- 41$650 to $699
- 185$700 to $749
- 277$750 to $799
- 452$800 to $899
- 562$900 to $999
- 1,846$1,000 to $1,249
- 329$1,250 to $1,499
- 941$1,500 to $1,999
- 154$2,000 to $2,499
- 85$2,500 to $2,999
- 9$3,000 to $3,499
- 41$3,500 or more
- 50No cash rent


Percentage of workers working in this county: 97.3%
Number of people working at home: 1,561 (17.0% of all workers)
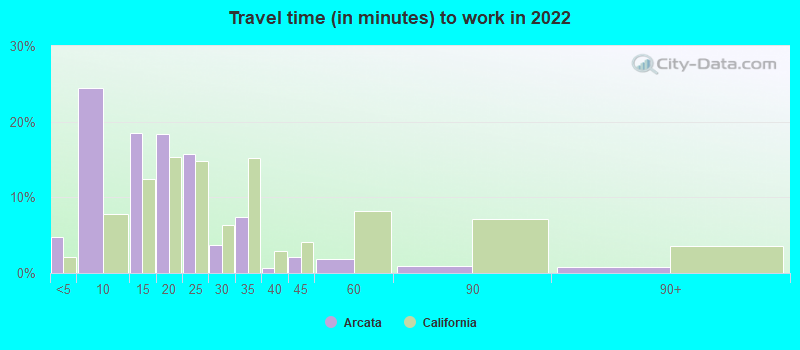
Travel time to work (commute)
- Less than 5 minutes: 438
- 5 to 9 minutes: 2,065
- 10 to 14 minutes: 1,517
- 15 to 19 minutes: 2,072
- 20 to 24 minutes: 1,016
- 25 to 29 minutes: 249
- 30 to 34 minutes: 434
- 35 to 39 minutes: 52
- 40 to 44 minutes: 180
- 45 to 59 minutes: 181
- 60 to 89 minutes: 90
- 90 or more minutes: 108
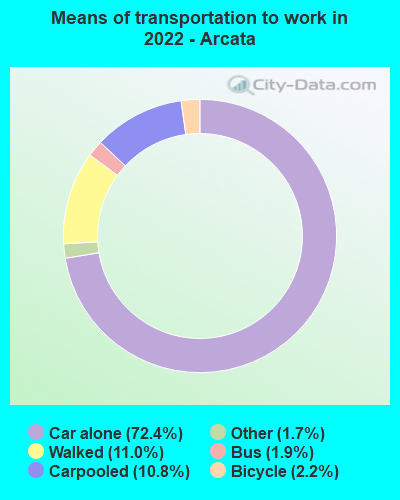
Means of transportation to work:
- Drove a car alone: 6,611 (61.3%)
- Carpooled: 1,064 (9.9%)
- Bus: 145 (1.3%)
- Taxi: 164 (1.5%)
- Bicycle: 209 (1.9%)
- Walked: 1,064 (9.9%)
- Worked at home: 1,561 (14.5%)

- Unemployment by race in 2022
- Unemployment rate for White non-Hispanic residents
- 12.9%Males
- 17.1%Females
- Unemployment rate for Black residents
- 3.7%Females
- Unemployment rate for American Indian and Alaska Native residents
- 30.9%Females
- Unemployment rate for Asian residents
- 3.0%Males
- 5.4%Females
- Unemployment rate for other race residents
- 20.5%Males
- 28.1%Females
- Unemployment rate for two or more race residents
- 13.1%Males
- 6.4%Females
- Unemployment rate for Hispanic or Latino residents
- 5.7%Males
- 24.5%Females

- Year of entry for the foreign-born population in Arcata, California
- 4852010 or later
- 3312000 to 2009
- 2711990 to 1999
- 1711980 to 1989
- 1811970 to 1979
- 361Before 1970

First ancestries reported:
- Italian: 878 (11.6%)
- Irish: 390 (5.2%)
- German: 342 (4.5%)
- English: 322 (4.3%)
- European: 299 (3.9%)
- American: 293 (3.9%)
- Portuguese: 205 (2.7%)
- Eastern European: 186 (2.5%)
- Scottish: 185 (2.4%)
- Norwegian: 146 (1.9%)
- French: 109 (1.4%)
- Scandinavian: 69 (0.9%)
- British: 67 (0.9%)
- Brazilian: 63 (0.8%)
- Polish: 62 (0.8%)
- Scotch-Irish: 55 (0.7%)
- Northern European: 52 (0.7%)
- Russian: 37 (0.5%)
- Danish: 36 (0.5%)
- Dutch: 36 (0.5%)
- Basque: 27 (0.4%)
- Palestinian: 19 (0.3%)
- Iranian: 16 (0.2%)
- New Zealander: 16 (0.2%)
- Swiss: 16 (0.2%)
- Hungarian: 14 (0.2%)
- Ukrainian: 12 (0.2%)
- Slavic: 11 (0.1%)
- Nigerian: 7 (0.09%)
- Swedish: 6 (0.08%)
- Finnish: 2 (0.03%)
Most common places of birth for foreign-born residents (%):
| Arcata: | 19.3% (252) |
| California: | 0.6% (65,335) |
| Arcata: | 18.8% (246) |
| California: | 37.2% (3,881,193) |
| Arcata: | 8.6% (113) |
| California: | 0.2% (25,462) |
| Arcata: | 5.9% (77) |
| California: | 0.5% (53,222) |
| Arcata: | 5.1% (67) |
| California: | 6.6% (684,672) |
| Arcata: | 5.0% (66) |
| California: | 0.6% (58,161) |
| Arcata: | 3.5% (46) |
| California: | 0.7% (71,932) |
| Arcata: | 3.4% (45) |
| California: | 0.6% (60,582) |
| Arcata: | 3.1% (40) |
| California: | 0.1% (8,545) |
| Arcata: | 2.5% (33) |
| California: | 0.1% (11,287) |
| Arcata: | 2.2% (29) |
| California: | 2.8% (290,436) |
| Arcata: | 2.1% (27) |
| California: | 0.2% (17,937) |
| Arcata: | 2.0% (26) |
| California: | 0.0% (4,342) |
| Arcata: | 2.0% (26) |
| California: | 3.0% (315,248) |
| Arcata: | 1.9% (25) |
| California: | 0.6% (57,953) |
Place of birth for U.S.-born residents:
- This state: 11,950
- Other state: 5,010
- Northeast: 1,123
- Midwest: 1,005
- South: 1,818
- West: 1,118
70.8% of Arcata residents lived in the same house 1 years ago.
Out of people who lived in different houses, 33.7% lived in this county.
Out of people who lived in different counties, 85.9% lived in California.
| Arcata: | 70.8% |
| State average: | 88.9% |
Education attainment for males 25 years and older:
- No schooling: 72
- Nursery to 4th grade: 0
- 5th and 6th grade: 13
- 7th and 8th grade: 16
- 9th grade: 57
- 10th grade: 3
- 11th grade: 0
- 12th grade, no diploma: 288
- High school graduate (or equivalency): 814
- Less than 1 year of college: 287
- Some college more than 1 year, no degree: 1,108
- Associate degree: 531
- Bachelor's degree: 1,485
- Master's degree: 450
- Professional school degree: 405
- Doctorate degree: 119

Education attainment for females 25 years and older:
- No schooling: 49
- Nursery to 4th grade: 0
- 5th and 6th grade: 0
- 7th and 8th grade: 0
- 9th grade: 21
- 10th grade: 22
- 11th grade: 168
- 12th grade, no diploma: 57
- High school graduate (or equivalency): 530
- Less than 1 year of college: 337
- Some college more than 1 year, no degree: 763
- Associate degree: 467
- Bachelor's degree: 1,248
- Master's degree: 970
- Professional school degree: 175
- Doctorate degree: 219


Housing units in structures:
- One, detached: 3,899
- One, attached: 502
- Two: 430
- 3 or 4: 1,054
- 5 to 9: 748
- 10 to 19: 600
- 20 to 49: 412
- 50 or more: 241
- Mobile homes: 485
Median worth of mobile homes: $86,678
Housing units lacking complete kitchen facilities in 2022: 2.3%
House/condo owner moved in on average 14 years ago
Renter moved in on average 1 years ago

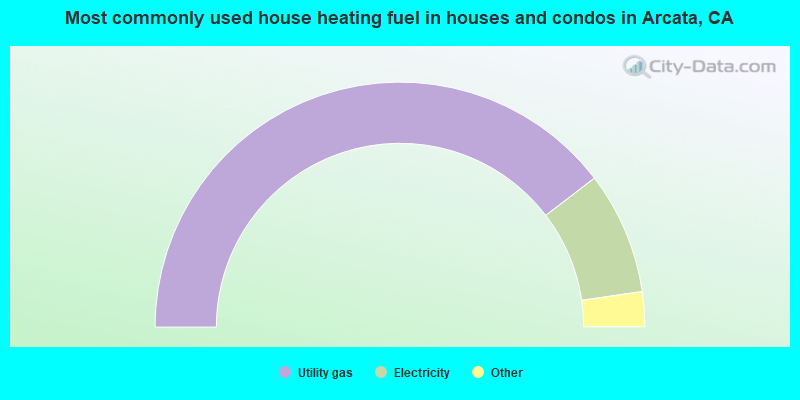
- 79.2%Utility gas
- 16.2%Electricity
- 3.0%Wood
- 1.4%Other fuel
- 0.2%Bottled, tank, or LP gas
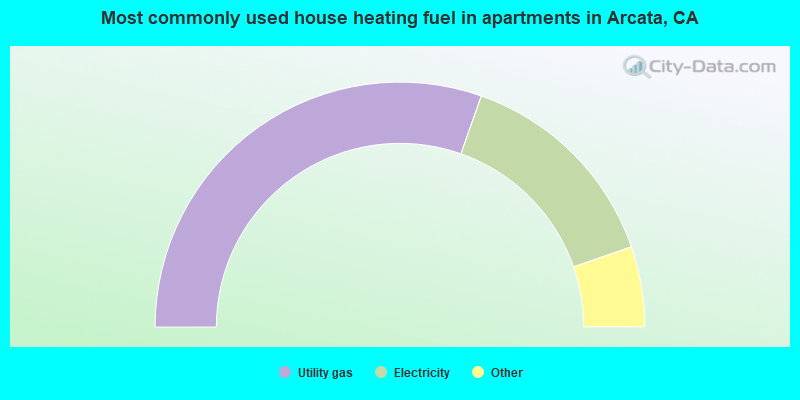
- 60.8%Utility gas
- 28.6%Electricity
- 3.6%Solar energy
- 2.8%No fuel used
- 1.6%Bottled, tank, or LP gas
- 1.5%Wood
- 0.9%Other fuel
- 0.3%Fuel oil, kerosene, etc.
Private vs. public school enrollment:
| Here: | 7.6% |
| California: | 10.5% |
| Here: | 0.0% |
| California: | 8.5% |
| Here: | 0.8% |
| California: | 15.9% |


