Jump to a detailed profile or search site with Google Custom Search

Arden-Arcade, CA (California) Houses and Residents

Estimated median house or condo value in 2022: $540,900 (it was $166,700 in 2000)
Arden-Arcade:

$540,900
California:

$715,900
Lower value quartile - upper value quartile: $405,300 - $737,800

Mean price in 2022:

Detached houses: $755,252
Here:

$755,252
State:

$988,808

Townhouses or other attached units: $458,979
Here:

$458,979
State:

$838,546

In 2-unit structures: $179,942
Here:

$179,942
State:

$1,138,100

In 3-to-4-unit structures: $464,538
Here:

$464,538
State:

$824,253

In 5-or-more-unit structures: $256,697
Here:

$256,697
State:

$730,996

Mobile homes: $123,623
Here:

$123,623
State:

$184,506

Occupied boats, RVs, vans, etc.: $676,364
Here:

$676,364
State:

$204,957

Total population: 92,186 (All urban)

Houses: 40,633 (38,981 occupied: 17,314 owner occupied, 21,667 renter occupied)

% of renters here:

56%
State:

44%

Housing density: 2,152 houses/condos per square mile

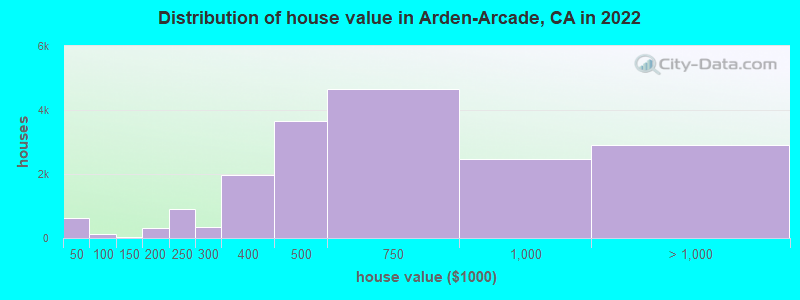
Median price asked for vacant for-sale houses and condos in 2022: $325,815.

Median contract rent in 2022: $1,362 (lower quartile is $1,040, upper quartile is $1,757)


Median rent asked for vacant for-rent units in 2022: $1,653


Median gross rent in Arden-Arcade, CA in 2022: $1,492

Housing units in Arden-Arcade with a mortgage: 11,218 (1,527 second mortgage, 42 home equity loan, 1,343 both second mortgage and home equity loan)
Houses without a mortgage: 94

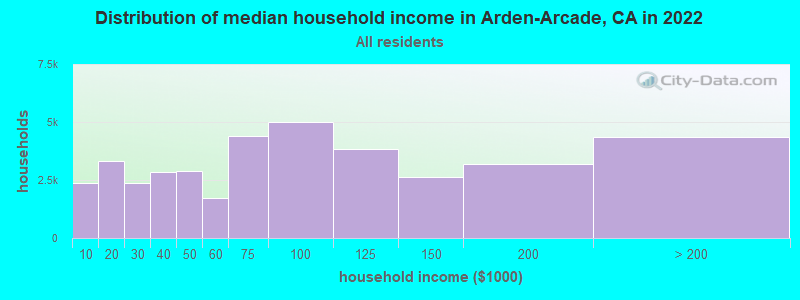
Median household income for houses/condos with a mortgage: $134,502

Median household income for apartments without a mortgage: $84,350

Median monthly housing costs: $1,616

Compare current foreclosures near Arden-Arcade, CA:

Check out more offers near Arden-Arcade, CA.
Powered by Foreclosure.com

Settings
X
Data:
Loading data...
Based on 2000-2022 data
Loading data...

123
Hide US histogram

Latest news about housing in Arden-Arcade, CA collected exclusively by city-data.com from local newspapers, TV, and radio stations

Arden-Arcade, California Age and Sex of Residents
Median year house/condo built: 1958

Median year apartment built: 1974

Household type by relationship:

Households: 95,936
  • Male householders: 17,458 (5,849 living alone), Female householders: 21,523 (6,762 living alone)
  • 14,665 spouses (14,395 opposite-sex spouses), 3,191 unmarried partners, (2,803 opposite-sex unmarried partners), 28,950 children (27,350 natural, 904 adopted, 696 stepchildren), 767 grandchildren, 879 brothers or sisters, 1,025 parents, 849 foster children, 1,176 other relatives, 3,982 non-relatives
  • In group quarters: 1,471

Size of family households: 9,728 2-persons, 5,780 3-persons, 3,496 4-persons, 2,672 5-persons, 677 6-persons, 611 7-or-more-persons.

Size of nonfamily households: 12,611 1-person, 2,990 2-persons, 416 3-persons.

14,657 married couples with children.
7,298 single-parent households (1,195 men, 6,103 women).

70.0% of residents of Arden-Arcade speak English at home.
12.8% of residents speak Spanish at home (67% speak English very well, 10% speak English well, 18% speak English not well, 5% don't speak English at all).
11.7% of residents speak other Indo-European language at home (40% speak English very well, 30% speak English well, 24% speak English not well, 6% don't speak English at all).
4.3% of residents speak Asian or Pacific Island language at home (78% speak English very well, 16% speak English well, 5% speak English not well, 1% don't speak English at all).
1.8% of residents speak other language at home (74% speak English very well, 18% speak English well, 6% speak English not well, 2% don't speak English at all).

Foreign born population: 17,009 (17.7%)
(29.8% of them are naturalized citizens)

Median number of rooms in houses and condos:
Here:

6.1
State:

6.0

Median number of rooms in apartments
Here:

3.7
State:

3.9

Owner-occupied Renter-occupied
Bedrooms in owner-occupied houses and condos in Arden-Arcade, California
  • Bedrooms in owner-occupied houses and condos in Arden-Arcade, California
  • 0no bedroom
  • 6841 bedroom
  • 3,3512 bedrooms
  • 8,1473 bedrooms
  • 4,1544 bedrooms
  • 9785+ bedrooms
Bedrooms in renter-occupied apartments in Arden-Arcade, California
  • Bedrooms in renter-occupied apartments in Arden-Arcade, California
  • 1,688no bedroom
  • 7,2541 bedroom
  • 9,5702 bedrooms
  • 2,4903 bedrooms
  • 6654 bedrooms
  • 05+ bedrooms
Owner-occupied Renter-occupied
Cars and other vehicles available in Arden-Arcade in owner-occupied houses/condos
  • Cars and other vehicles available in Arden-Arcade in owner-occupied houses/condos
  • 416no vehicle
  • 4,8241 vehicle
  • 7,2702 vehicles
  • 3,9703 vehicles
  • 6184 vehicles
  • 2165+ vehicles
Cars and other vehicles available in Arden-Arcade in renter-occupied apartments
  • Cars and other vehicles available in Arden-Arcade in renter-occupied apartments
  • 2,501no vehicle
  • 11,1581 vehicle
  • 6,4492 vehicles
  • 1,0573 vehicles
  • 5024 vehicles
  • 05+ vehicles
Owner-occupied Renter-occupied
Rooms in owner-occupied houses in Arden-Arcade, California
  • Rooms in owner-occupied houses in Arden-Arcade, California
  • 01 room
  • 1932 rooms
  • 5023 rooms
  • 2,2034 rooms
  • 3,3655 rooms
  • 4,0876 rooms
  • 3,0167 rooms
  • 1,2708 rooms
  • 2,6789+ rooms
Rooms in renter-occupied apartments in Arden-Arcade, California
  • Rooms in renter-occupied apartments in Arden-Arcade, California
  • 1,5461 room
  • 3,0102 rooms
  • 5,2813 rooms
  • 6,5934 rooms
  • 3,1225 rooms
  • 1,7756 rooms
  • 1577 rooms
  • 468 rooms
  • 1379+ rooms
Year house built
Median 2022 house/condo value by year built
Median house/condo value by year householder moved into unit
Breakdown of mean house values by ages of householders
Owners and renters by unit type in Arden-Arcade, CA
  • Arden-Arcade, CA household income distribution

  • Distribution of median household income in Arden-Arcade, CA in 2022
  • 2,367Less than $10,000
  • 3,339$10,000 to $19,999
  • 2,366$20,000 to $29,999
  • 2,866$30,000 to $39,999
  • 2,892$40,000 to $49,999
  • 1,733$50,000 to $59,999
  • 4,398$60,000 to $74,999
  • 5,010$75,000 to $99,999
  • 3,823$100,000 to $124,999
  • 2,640$125,000 to $149,999
  • 3,205$150,000 to $199,999
  • 4,342$200,000 or more
  • Home value of owner - occupied houses in 2022 in Arden-Arcade, CA

  • Distribution of house value in Arden-Arcade, CA in 2022
  • 237Less than $10,000
  • 164$10,000 to $14,999
  • 55$15,000 to $19,999
  • 64$20,000 to $24,999
  • 11$25,000 to $29,999
  • 56$30,000 to $34,999
  • 25$40,000 to $49,999
  • 9$50,000 to $59,999
  • 74$60,000 to $69,999
  • 6$80,000 to $89,999
  • 8$90,000 to $99,999
  • 16$100,000 to $124,999
  • 28$125,000 to $149,999
  • 191$150,000 to $174,999
  • 125$175,000 to $199,999
  • 900$200,000 to $249,999
  • 340$250,000 to $299,999
  • 1,969$300,000 to $399,999
  • 3,649$400,000 to $499,999
  • 4,653$500,000 to $749,999
  • 2,481$750,000 to $999,999
  • 2,120$1,000,000 to $1,499,999
  • 516$1,500,000 to $1,999,999
  • 262$2,000,000 or more
  • Rent paid by renters in 2022 in Arden-Arcade, CA

  • Distribution of rent paid by renters in Arden-Arcade, CA in 2022
  • 0Less than $100
  • 81$100 to $149
  • 71$150 to $199
  • 277$200 to $249
  • 31$250 to $299
  • 5$300 to $349
  • 102$350 to $399
  • 36$400 to $449
  • 129$450 to $499
  • 139$500 to $549
  • 113$550 to $599
  • 149$600 to $649
  • 210$650 to $699
  • 97$700 to $749
  • 258$750 to $799
  • 662$800 to $899
  • 1,655$900 to $999
  • 4,992$1,000 to $1,249
  • 4,789$1,250 to $1,499
  • 4,775$1,500 to $1,999
  • 903$2,000 to $2,499
  • 378$2,500 to $2,999
  • 43$3,000 to $3,499
  • 181$3,500 or more
  • 406No cash rent
Time Leaving Home To Go To Work in 2022

Percentage of workers working in this county: 84.9%
Number of people working at home: 7,913 (18.2% of all workers)

Travel time (in minutes) to work in 2022

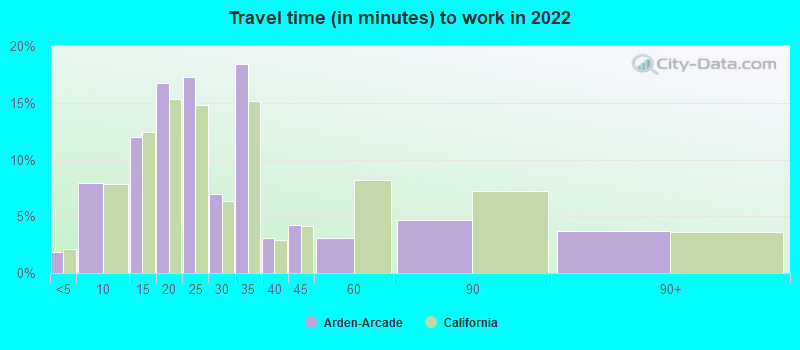
Travel time to work (commute)

  • Less than 5 minutes: 949
  • 5 to 9 minutes: 3,465
  • 10 to 14 minutes: 5,595
  • 15 to 19 minutes: 5,061
  • 20 to 24 minutes: 7,682
  • 25 to 29 minutes: 3,148
  • 30 to 34 minutes: 6,167
  • 35 to 39 minutes: 645
  • 40 to 44 minutes: 346
  • 45 to 59 minutes: 1,111
  • 60 to 89 minutes: 1,498
  • 90 or more minutes: 877
Means of transportation to work in 2022 - Arden-Arcade

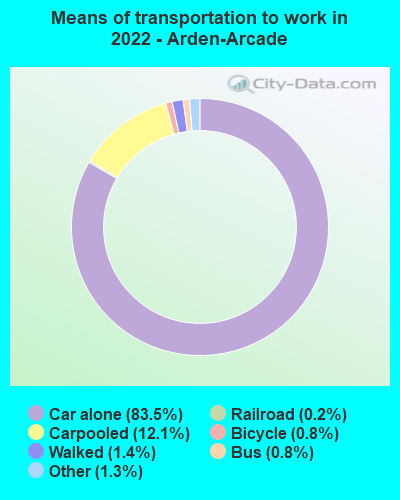
Means of transportation to work:

  • Drove a car alone: 28,197 (67.6%)
  • Carpooled: 4,205 (10.1%)
  • Bus: 149 (0.4%)
  • Light rail, streetcar or trolley: 35 (0.1%)
  • Taxi: 526 (1.3%)
  • Bicycle: 191 (0.5%)
  • Walked: 529 (1.3%)
  • Worked at home: 7,913 (19.0%)
Class of Workers in 2022
  • Unemployment by race in 2022
  • Unemployment rate for White non-Hispanic residents
  • 15.7%Males
  • 4.0%Females
  • Unemployment rate for Black residents
  • 14.7%Males
  • 8.0%Females
  • Unemployment rate for Asian residents
  • 11.3%Males
  • 8.3%Females
  • Unemployment rate for other race residents
  • 2.9%Males
  • 3.7%Females
  • Unemployment rate for two or more race residents
  • 10.4%Males
  • 5.1%Females
  • Unemployment rate for Hispanic or Latino residents
  • 2.5%Males
  • 3.7%Females
Year of entry for the foreign-born population in Arden-Arcade, California
  • Year of entry for the foreign-born population in Arden-Arcade, California
  • 10,2192010 or later
  • 3,9572000 to 2009
  • 3,2041990 to 1999
  • 2,6641980 to 1989
  • 1,2871970 to 1979
  • 2,224Before 1970
Ancestries in Arden-Arcade, CA

First ancestries reported:

  • Afghan: 3,603 (7.2%)
  • American: 2,722 (5.4%)
  • Irish: 1,988 (4.0%)
  • German: 1,961 (3.9%)
  • English: 1,833 (3.7%)
  • European: 1,352 (2.7%)
  • Ukrainian: 1,189 (2.4%)
  • Italian: 1,106 (2.2%)
  • Russian: 888 (1.8%)
  • Iranian: 651 (1.3%)
  • French: 601 (1.2%)
  • Norwegian: 539 (1.1%)
  • African: 493 (1.0%)
  • Dutch: 415 (0.8%)
  • Swedish: 368 (0.7%)
  • Welsh: 320 (0.6%)
  • Eastern European: 298 (0.6%)
  • Ethiopian: 277 (0.6%)
  • Scottish: 273 (0.5%)
  • Lebanese: 262 (0.5%)
  • Canadian: 262 (0.5%)
  • Portuguese: 230 (0.5%)
  • Scotch-Irish: 209 (0.4%)
  • Romanian: 156 (0.3%)
  • Greek: 139 (0.3%)
  • British: 112 (0.2%)
  • Czechoslovakian: 97 (0.2%)
  • Northern European: 93 (0.2%)
  • Belizean: 84 (0.2%)
  • Polish: 81 (0.2%)
  • Swiss: 80 (0.2%)
  • Croatian: 78 (0.2%)
  • Jamaican: 71 (0.1%)
  • Ugandan: 66 (0.1%)
  • Armenian: 65 (0.1%)
  • Brazilian: 61 (0.1%)
  • Danish: 60 (0.1%)
  • Hungarian: 57 (0.1%)
  • Czech: 56 (0.1%)
  • Austrian: 55 (0.1%)
  • French Canadian: 52 (0.1%)
  • Nigerian: 51 (0.1%)
  • British West Indian: 50 (0.1%)
  • Slavic: 49 (0.10%)
  • Finnish: 46 (0.09%)
  • Australian: 40 (0.08%)
  • Scandinavian: 36 (0.07%)
  • Yugoslavian: 35 (0.07%)
  • Egyptian: 34 (0.07%)
  • Kenyan: 30 (0.06%)
  • Albanian: 24 (0.05%)
  • Moroccan: 21 (0.04%)
  • Haitian: 19 (0.04%)
  • Assyrian: 18 (0.04%)
  • German Russian: 17 (0.03%)
  • Sierra Leonean: 17 (0.03%)
  • Lithuanian: 16 (0.03%)
  • Belgian: 15 (0.03%)
  • Barbadian: 14 (0.03%)
  • Basque: 10 (0.02%)
  • Bulgarian: 9 (0.02%)
  • Celtic: 8 (0.02%)
  • Pennsylvania German: 8 (0.02%)
  • Serbian: 6 (0.01%)
  • Latvian: 5 (0.01%)

Most common places of birth for foreign-born residents (%):

Afghanistan
Arden-Arcade:

30.6% (6,002)
California:

0.5% (53,260)

Mexico
Arden-Arcade:

19.6% (3,840)
California:

37.2% (3,881,193)

Philippines
Arden-Arcade:

6.7% (1,315)
California:

7.8% (818,297)

Ukraine
Arden-Arcade:

6.1% (1,192)
California:

0.6% (60,761)

India
Arden-Arcade:

4.0% (789)
California:

5.2% (539,184)

Russia
Arden-Arcade:

3.8% (749)
California:

0.7% (71,932)

Iran
Arden-Arcade:

2.9% (564)
California:

2.0% (206,004)

Fiji
Arden-Arcade:

2.8% (548)
California:

0.3% (33,937)

Thailand
Arden-Arcade:

1.9% (366)
California:

0.6% (65,335)

El Salvador
Arden-Arcade:

1.7% (327)
California:

4.2% (440,287)

Place of birth for U.S.-born residents:

  • This state: 62,378
  • Other state: 15,604
  • Northeast: 3,151
  • Midwest: 4,062
  • South: 4,385
  • West: 4,006

84.7% of Arden-Arcade residents lived in the same house 1 years ago.
   Out of people who lived in different houses, 40.3% lived in this county.
   Out of people who lived in different counties, 80.5% lived in California.


Arden-Arcade:

84.7%
State average:

88.9%

Education attainment for males 25 years and older:

  • No schooling: 1,228
  • Nursery to 4th grade: 14
  • 5th and 6th grade: 44
  • 7th and 8th grade: 44
  • 9th grade: 0
  • 10th grade: 939
  • 11th grade: 45
  • 12th grade, no diploma: 1,596
  • High school graduate (or equivalency): 6,504
  • Less than 1 year of college: 3,113
  • Some college more than 1 year, no degree: 4,368
  • Associate degree: 1,359
  • Bachelor's degree: 6,527
  • Master's degree: 2,627
  • Professional school degree: 1,869
  • Doctorate degree: 396
Educational Attainment for Males

Education attainment for females 25 years and older:

  • No schooling: 1,671
  • Nursery to 4th grade: 0
  • 5th and 6th grade: 513
  • 7th and 8th grade: 248
  • 9th grade: 30
  • 10th grade: 440
  • 11th grade: 0
  • 12th grade, no diploma: 1,390
  • High school graduate (or equivalency): 7,458
  • Less than 1 year of college: 2,380
  • Some college more than 1 year, no degree: 5,168
  • Associate degree: 3,863
  • Bachelor's degree: 6,910
  • Master's degree: 2,548
  • Professional school degree: 1,544
  • Doctorate degree: 438
Educational Attainment for Females
Arden-Arcade marital status for males
Arden-Arcade marital status for females

Housing units in structures:

  • One, detached: 18,844
  • One, attached: 1,638
  • Two: 1,214
  • 3 or 4: 4,517
  • 5 to 9: 3,696
  • 10 to 19: 2,744
  • 20 to 49: 3,056
  • 50 or more: 4,144
  • Mobile homes: 780

Median worth of mobile homes: $13,700

Housing units lacking complete plumbing facilities in 2022: 0.3%

Housing units lacking complete kitchen facilities in 2022: 1.1%

House/condo owner moved in on average 12 years ago

Renter moved in on average 3 years ago

Year householders moved into residence in Arden-Arcade
Houses and condos Apartments
Most commonly used house heating fuel in houses and condos in Arden-Arcade, CA
  • 72.7%Utility gas
  • 26.1%Electricity
  • 0.5%Bottled, tank, or LP gas
  • 0.3%Other fuel
  • 0.3%Solar energy
Most commonly used house heating fuel in apartments in Arden-Arcade, CA
  • 54.0%Electricity
  • 42.0%Utility gas
  • 2.2%No fuel used
  • 1.7%Bottled, tank, or LP gas
  • 0.1%Other fuel

Private vs. public school enrollment:

Students in private schools in grades 1 to 8 (elementary and middle school): 1,406
Here:

10.6%
California:

10.5%

Students in private schools in grades 9 to 12 (high school): 783
Here:

23.4%
California:

8.5%

Students in private undergraduate colleges: 551
Here:

12.3%
California:

15.9%
School Enrollment by Level of School for Male Students
School Enrollment by Level of School for Female Students
Age and Sex of Sensory-Disabled Noninstitutionalized Residents
Age and Sex of Physically-Disabled Noninstitutionalized Residents
Age and Sex of Mentally-Disabled Noninstitutionalized Residents
Age and Sex of Self-Care Disabled Noninstitutionalized Residents
Age and Sex of Go-Outside-Home Disabled Noninstitutionalized Residents
Age and Sex of Noninstitutionalized Residents with Employment Disability