Arkansas City, KS (Kansas) Houses and Residents
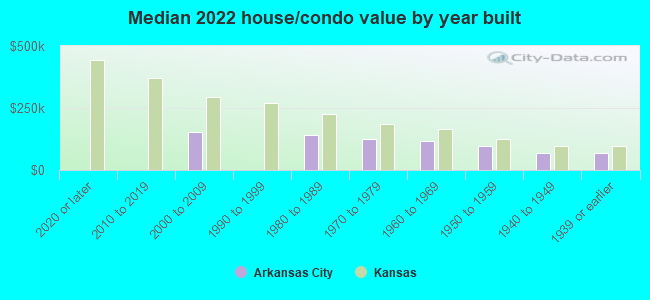
| Arkansas City: | $85,674 |
| Kansas: | $206,600 |
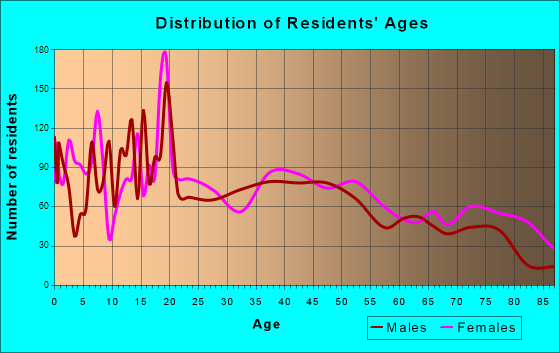
Total population: 12,205 (Urban population: 11,507 (all inside urban clusters), Rural population: 530 (all nonfarm))
Houses: 5,656 (4,736 occupied: 3,009 owner occupied, 1,784 renter occupied)
| % of renters here: | 37% |
| State: | 32% |
Housing density: 753 houses/condos per square mile
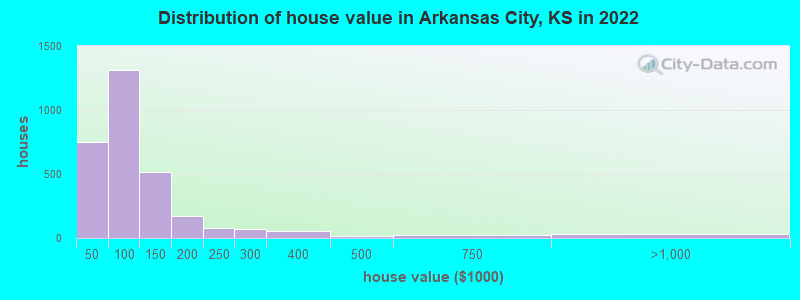
Median price asked for vacant for-sale houses and condos in 2022: $597,854.
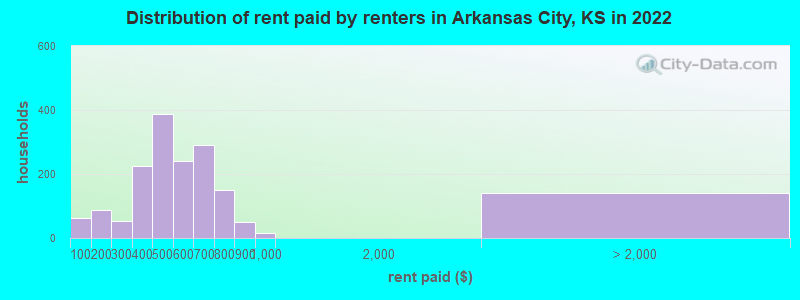
Median contract rent in 2022: $496 (lower quartile is $390, upper quartile is $638)
Median rent asked for vacant for-rent units in 2022: $595
Median gross rent in Arkansas City, KS in 2022: $746
Housing units in Arkansas City with a mortgage: 1,537 (94 second mortgage, 0 home equity loan, 51 both second mortgage and home equity loan)
Houses without a mortgage: 4
Median household income for houses/condos with a mortgage: $84,935
Median household income for apartments without a mortgage: $50,143
Median monthly housing costs: $720
Compare current foreclosures near Arkansas City, KS:
| Photo | Address | Area | Beds / Baths | Price | Details |
|---|---|---|---|---|---|

|
#1
N 10th St
Arkansas City, KS 67005
|
1,368 sq. feet
|
2 baths 3 beds |
show details | |

|
#2
Edgemont Dr
Arkansas City, KS 67005
|
1,560 sq. feet
|
1 baths 3 beds |
show details | |

|
#3
N 7th St
Arkansas City, KS 67005
|
1,836 sq. feet
|
1 baths 3 beds |
show details | |

|
#4
S 2nd St
Arkansas City, KS 67005
|
1,671 sq. feet
|
2 baths 5 beds |
show details | |

|
#5
S A St
Arkansas City, KS 67005
|
1,104 sq. feet
|
1 baths 2 beds |
show details | |

|
#6
N B St
Arkansas City, KS 67005
|
1,560 sq. feet
|
1 baths 2 beds |
show details | |

|
#7
N 2nd St
Arkansas City, KS 67005
|
1,584 sq. feet
|
2 baths 2 beds |
show details | |

|
#8
E Chestnut Ave
Arkansas City, KS 67005
|
2,260 sq. feet
|
2 baths 3 beds |
show details | |

|
#9
Sherwood Ln
Arkansas City, KS 67005
|
952 sq. feet
|
1 baths 2 beds |
show details | |

|
#10
N 7th St
Arkansas City, KS 67005
|
- sq. feet
|
- baths - beds |
show details |
| Photo | Address | Area | Beds / Baths | Price | Details |
|---|---|---|---|---|---|

|
#11
S 1st St # C
Arkansas City, KS 67005
|
- sq. feet
|
- baths - beds |
show details | |

|
#12
N 1st St # 8
Arkansas City, KS 67005
|
- sq. feet
|
- baths - beds |
show details | |

|
#13
N 3rd St
Arkansas City, KS 67005
|
- sq. feet
|
- baths - beds |
show details | |

|
#14
W Quincy Ave
Arkansas City, KS 67005
|
- sq. feet
|
- baths - beds |
show details | |

|
#15
N 13th St
Arkansas City, KS 67005
|
- sq. feet
|
- baths - beds |
show details | |

|
#16
N 9th St
Arkansas City, KS 67005
|
- sq. feet
|
- baths - beds |
show details | |

|
#17
S 6th St
Arkansas City, KS 67005
|
- sq. feet
|
- baths - beds |
show details | |

|
#18
S 2nd St
Arkansas City, KS 67005
|
- sq. feet
|
- baths - beds |
show details | |

|
#19
322nd Rd
Arkansas City, KS 67005
|
- sq. feet
|
- baths - beds |
show details | |

|
#20
E 12th Ave
Winfield, KS 67156
|
- sq. feet
|
2 baths 3 beds |
$54,900
|
show details |
| Photo | Address | Area | Beds / Baths | Price | Details |
|---|---|---|---|---|---|

|
#21
E 7th Ave
Winfield, KS 67156
|
2,038 sq. feet
|
1 baths 3 beds |
show details | |

|
#22
E Olive St
Oxford, KS 67119
|
1,796 sq. feet
|
2 baths 4 beds |
show details | |

|
#23
Ann St
Winfield, KS 67156
|
1,015 sq. feet
|
1 baths 2 beds |
show details | |

|
#24
N Chestnut Ave
Newkirk, OK 74647
|
2,107 sq. feet
|
2 baths 4 beds |
show details | |

|
#25
5th St
Newkirk, OK 74647
|
1,309 sq. feet
|
1 baths 2 beds |
show details | |

|
#26
N Osage St
Oxford, KS 67119
|
2,384 sq. feet
|
3 baths 6 beds |
show details | |

|
#27
161st Rd
Winfield, KS 67156
|
1,624 sq. feet
|
1 baths 5 beds |
show details | |

|
#28
E River Rd
Newkirk, OK 74647
|
1,605 sq. feet
|
2 baths 5 beds |
show details | |

|
#29
Central Ave
Winfield, KS 67156
|
1,400 sq. feet
|
1 baths 3 beds |
show details | |

|
#30
E 10th Ave
Winfield, KS 67156
|
1,633 sq. feet
|
1 baths 2 beds |
show details |
| Photo | Address | Area | Beds / Baths | Price | Details |
|---|---|---|---|---|---|

|
#31
E 6th Ave
Winfield, KS 67156
|
1,064 sq. feet
|
1 baths 3 beds |
show details | |

|
#32
N Magnolia Ave
Newkirk, OK 74647
|
1,855 sq. feet
|
1 baths 3 beds |
show details | |

|
#33
Cherry St
Winfield, KS 67156
|
1,642 sq. feet
|
2 baths 3 beds |
show details | |

|
#34
E 12th Ave
Winfield, KS 67156
|
1,534 sq. feet
|
1 baths 3 beds |
show details | |

|
#35
E 14th Ave
Winfield, KS 67156
|
1,041 sq. feet
|
1 baths 3 beds |
show details | |

|
#36
W 14th Ave
Winfield, KS 67156
|
1,433 sq. feet
|
1 baths 3 beds |
show details | |

|
#37
W Judo Rd
Newkirk, OK 74647
|
1,200 sq. feet
|
1 baths 2 beds |
show details | |

|
#38
N Pine Ave
Newkirk, OK 74647
|
- sq. feet
|
- baths - beds |
show details | |

|
#39
Manning St
Winfield, KS 67156
|
- sq. feet
|
- baths - beds |
show details | |

|
#40
Stewart St
Winfield, KS 67156
|
- sq. feet
|
- baths - beds |
show details |
| Photo | Address | Area | Beds / Baths | Price | Details |
|---|---|---|---|---|---|

|
#41
E 12th Ave Apt 407
Winfield, KS 67156
|
- sq. feet
|
- baths - beds |
show details | |

|
#42
Johnmark Ct
Winfield, KS 67156
|
- sq. feet
|
- baths - beds |
show details | |

|
#43
N Liberty Ave
Newkirk, OK 74647
|
- sq. feet
|
- baths - beds |
show details | |

|
#44
W Clark St
Oxford, KS 67119
|
- sq. feet
|
- baths - beds |
show details | |

|
#45
W Elm St
Oxford, KS 67119
|
- sq. feet
|
- baths - beds |
show details | |

|
#46
E 3rd St
Newkirk, OK 74647
|
- sq. feet
|
- baths - beds |
show details | |

|
#47
Center Ave
Winfield, KS 67156
|
- sq. feet
|
- baths - beds |
show details | |

|
#48
172nd Rd
Winfield, KS 67156
|
- sq. feet
|
- baths - beds |
show details | |

|
Check over 1 million property listings on Foreclosure.com!
|
browse all offers | |||


 | house rental (1 reply) |
| Positives about Arkansas City (10 replies) |
| Landlord + landlord association blackballing tenants (10 replies) |
| Best Major City in Kansas (58 replies) |
| Emporia, Kansas Named Best Small Town In America To Escape From (19 replies) |
| Possible relocation to Kansas~scoping out housing (1 reply) |
Median year apartment built: 1965
Household type by relationship:
Households: 12,002- Male householders: 2,311 (919 living alone), Female householders: 2,374 (931 living alone)
1,693 spouses (1,693 opposite-sex spouses), 325 unmarried partners, (293 opposite-sex unmarried partners), 3,575 children (3,259 natural, 21 adopted, 295 stepchildren), 215 grandchildren, 175 brothers or sisters, 45 parents, 0 foster children, 232 other relatives, 339 non-relatives
- In group quarters: 714
Size of family households: 1,114 2-persons, 665 3-persons, 444 4-persons, 244 5-persons, 152 6-persons, 29 7-or-more-persons.
Size of nonfamily households: 1,930 1-person, 178 2-persons, 42 3-persons, 5 4-persons.
1,308 married couples with children.
1,006 single-parent households (283 men, 723 women).
92.0% of residents of Arkansas City speak English at home.
8.0% of residents speak Spanish at home (63% speak English very well, 15% speak English well, 15% speak English not well, 8% don't speak English at all).
Foreign born population: 766 (6.4%)
(32.6% of them are naturalized citizens)
| Here: | 6.2 |
| State: | 6.9 |
| Here: | 4.5 |
| State: | 4.4 |
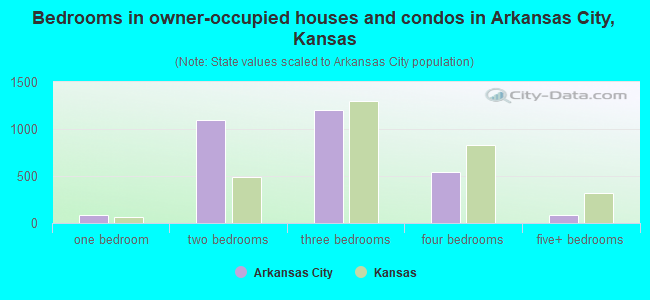
- Bedrooms in owner-occupied houses and condos in Arkansas City, Kansas
- 7no bedroom
- 891 bedroom
- 1,0912 bedrooms
- 1,1973 bedrooms
- 5424 bedrooms
- 835+ bedrooms
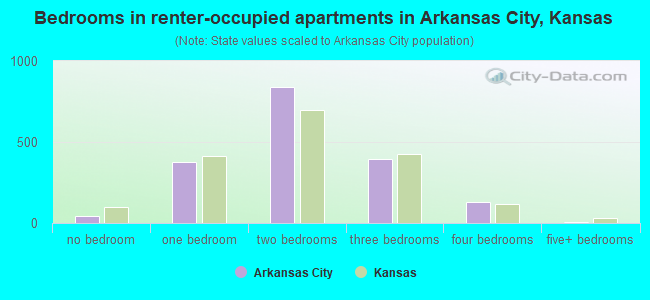
- Bedrooms in renter-occupied apartments in Arkansas City, Kansas
- 42no bedroom
- 3771 bedroom
- 8382 bedrooms
- 3923 bedrooms
- 1314 bedrooms
- 55+ bedrooms
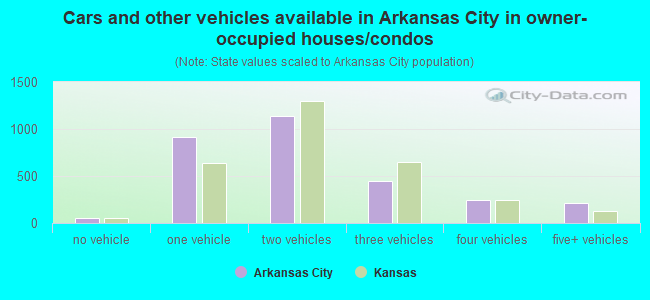
- Cars and other vehicles available in Arkansas City in owner-occupied houses/condos
- 54no vehicle
- 9171 vehicle
- 1,1382 vehicles
- 4423 vehicles
- 2434 vehicles
- 2165+ vehicles
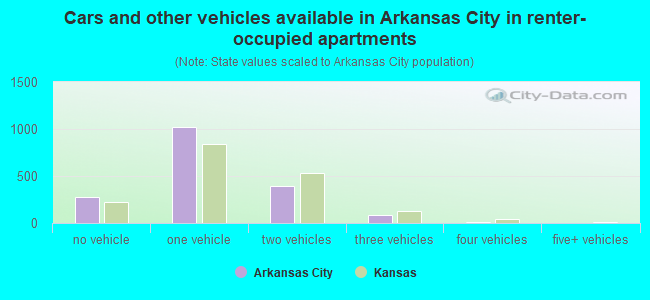
- Cars and other vehicles available in Arkansas City in renter-occupied apartments
- 275no vehicle
- 1,0221 vehicle
- 3912 vehicles
- 893 vehicles
- 74 vehicles
- 05+ vehicles
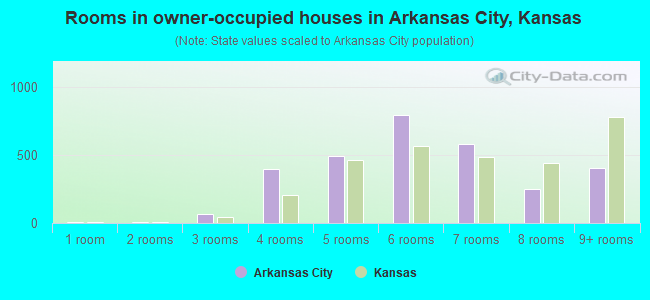
- Rooms in owner-occupied houses in Arkansas City, Kansas
- 71 room
- 72 rooms
- 643 rooms
- 4004 rooms
- 4915 rooms
- 7966 rooms
- 5837 rooms
- 2528 rooms
- 4089+ rooms
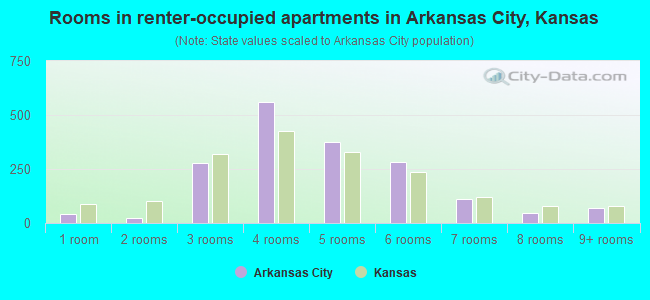
- Rooms in renter-occupied apartments in Arkansas City, Kansas
- 421 room
- 232 rooms
- 2763 rooms
- 5624 rooms
- 3775 rooms
- 2826 rooms
- 1097 rooms
- 458 rooms
- 699+ rooms
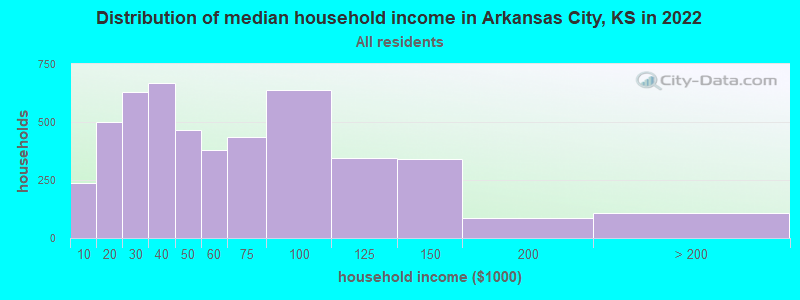
Arkansas City, KS household income distribution

- 235Less than $10,000
- 498$10,000 to $19,999
- 630$20,000 to $29,999
- 670$30,000 to $39,999
- 465$40,000 to $49,999
- 379$50,000 to $59,999
- 435$60,000 to $74,999
- 638$75,000 to $99,999
- 343$100,000 to $124,999
- 340$125,000 to $149,999
- 86$150,000 to $199,999
- 109$200,000 or more
Home value of owner - occupied houses in 2022 in Arkansas City, KS
-
- 157Less than $10,000
- 39$10,000 to $14,999
- 61$15,000 to $19,999
- 73$20,000 to $24,999
- 60$25,000 to $29,999
- 95$30,000 to $34,999
- 108$35,000 to $39,999
- 150$40,000 to $49,999
- 204$50,000 to $59,999
- 212$60,000 to $69,999
- 389$70,000 to $79,999
- 180$80,000 to $89,999
- 173$90,000 to $99,999
- 308$100,000 to $124,999
- 207$125,000 to $149,999
- 91$150,000 to $174,999
- 82$175,000 to $199,999
- 82$200,000 to $249,999
- 73$250,000 to $299,999
- 52$300,000 to $399,999
- 12$400,000 to $499,999
- 27$500,000 to $749,999
- 11$750,000 to $999,999
- 10$1,000,000 to $1,499,999
- 10$2,000,000 or more
Rent paid by renters in 2022 in Arkansas City, KS
-
- 61Less than $100
- 64$100 to $149
- 22$150 to $199
- 53$250 to $299
- 39$300 to $349
- 184$350 to $399
- 248$400 to $449
- 140$450 to $499
- 86$500 to $549
- 155$550 to $599
- 152$600 to $649
- 139$650 to $699
- 109$700 to $749
- 40$750 to $799
- 50$800 to $899
- 16$900 to $999
- 141No cash rent
Percentage of workers working in this county: 86.7%
Number of people working at home: 118 (2.4% of all workers)
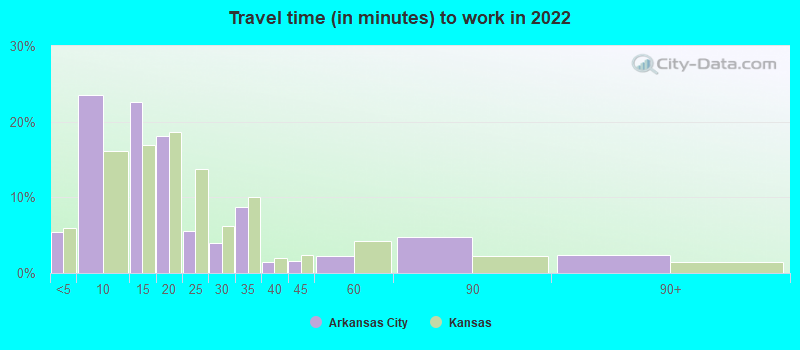
Travel time to work (commute)
- Less than 5 minutes: 240
- 5 to 9 minutes: 1,232
- 10 to 14 minutes: 845
- 15 to 19 minutes: 1,144
- 20 to 24 minutes: 451
- 25 to 29 minutes: 92
- 30 to 34 minutes: 271
- 35 to 39 minutes: 15
- 40 to 44 minutes: 44
- 45 to 59 minutes: 90
- 60 to 89 minutes: 109
- 90 or more minutes: 191
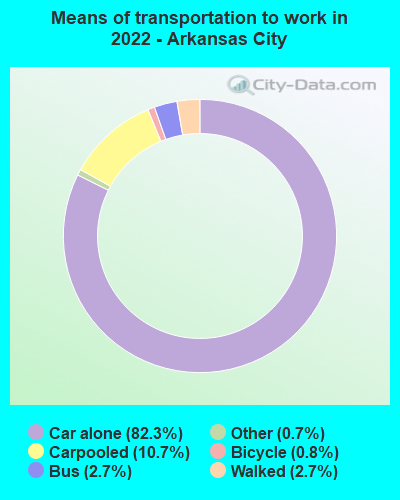
Means of transportation to work:
- Drove a car alone: 3,688 (78.1%)
- Carpooled: 486 (10.3%)
- Bus: 133 (2.8%)
- Taxi: 39 (0.8%)
- Bicycle: 37 (0.8%)
- Walked: 124 (2.6%)
- Worked at home: 118 (2.5%)
- Unemployment by race in 2022
- Unemployment rate for White non-Hispanic residents
- 2.9%Males
- 4.9%Females
- Unemployment rate for Black residents
- 7.6%Males
- 26.4%Females
- Unemployment rate for two or more race residents
- 8.3%Males
- 23.7%Females
- Unemployment rate for Hispanic or Latino residents
- 9.4%Males
- 6.9%Females
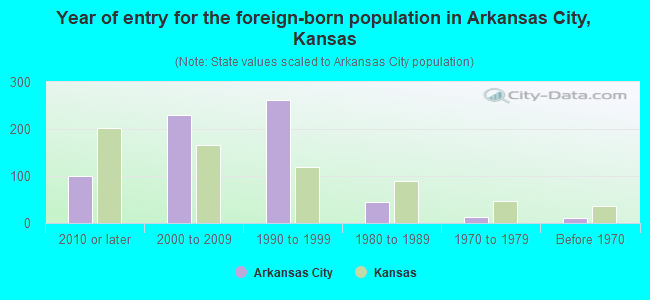
- Year of entry for the foreign-born population in Arkansas City, Kansas
- 1012010 or later
- 2302000 to 2009
- 2611990 to 1999
- 451980 to 1989
- 121970 to 1979
- 10Before 1970
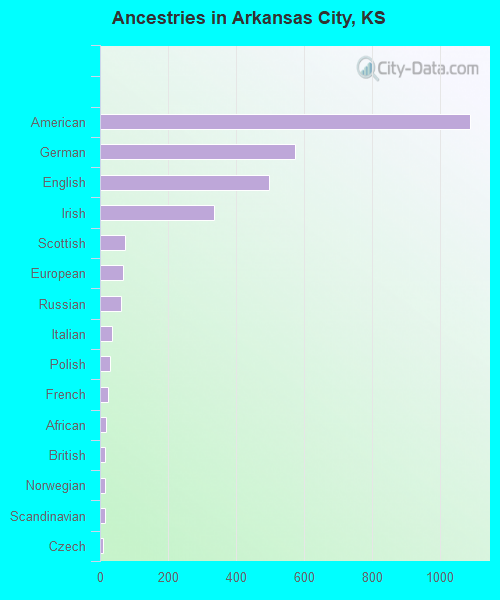
First ancestries reported:
- American: 1,091 (21.6%)
- German: 575 (11.4%)
- English: 498 (9.8%)
- Irish: 335 (6.6%)
- Scottish: 74 (1.5%)
- European: 68 (1.3%)
- Russian: 62 (1.2%)
- Italian: 36 (0.7%)
- Polish: 29 (0.6%)
- French: 23 (0.5%)
- African: 17 (0.3%)
- British: 15 (0.3%)
- Norwegian: 15 (0.3%)
- Scandinavian: 15 (0.3%)
- Czech: 10 (0.2%)
- Canadian: 9 (0.2%)
- Pennsylvania German: 8 (0.2%)
- Czechoslovakian: 7 (0.1%)
- Danish: 7 (0.1%)
- Welsh: 3 (0.06%)
- Brazilian: 2 (0.04%)
- Dutch: 2 (0.04%)
- French Canadian: 1 (0.02%)
Most common places of birth for foreign-born residents (%):
| Arkansas City: | 59.9% (467) |
| Kansas: | 39.2% (81,282) |
| Arkansas City: | 8.7% (68) |
| Kansas: | 2.2% (4,488) |
| Arkansas City: | 6.7% (52) |
| Kansas: | 0.6% (1,310) |
| Arkansas City: | 6.5% (51) |
| Kansas: | 3.5% (7,355) |
| Arkansas City: | 5.5% (43) |
| Kansas: | 0.0% (62) |
| Arkansas City: | 2.8% (22) |
| Kansas: | 0.1% (214) |
| Arkansas City: | 1.9% (15) |
| Kansas: | 0.5% (1,031) |
| Arkansas City: | 1.7% (13) |
| Kansas: | 2.6% (5,492) |
Place of birth for U.S.-born residents:
- This state: 8,195
- Other state: 2,956
- Northeast: 229
- Midwest: 683
- South: 1,426
- West: 634
88.5% of Arkansas City residents lived in the same house 1 years ago.
Out of people who lived in different houses, 28.9% lived in this county.
Out of people who lived in different counties, 46.6% lived in Kansas.
| Arkansas City: | 88.5% |
| State average: | 85.3% |
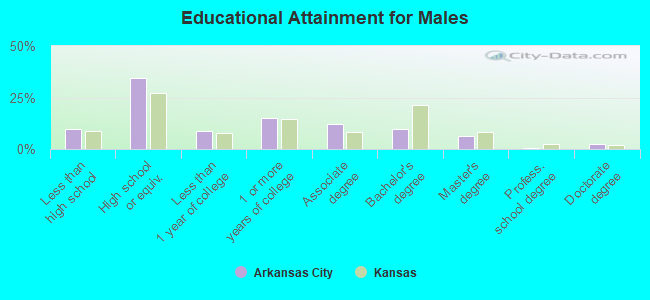
Education attainment for males 25 years and older:
- No schooling: 59
- Nursery to 4th grade: 0
- 5th and 6th grade: 24
- 7th and 8th grade: 24
- 9th grade: 77
- 10th grade: 15
- 11th grade: 91
- 12th grade, no diploma: 88
- High school graduate (or equivalency): 1,326
- Less than 1 year of college: 344
- Some college more than 1 year, no degree: 581
- Associate degree: 472
- Bachelor's degree: 380
- Master's degree: 249
- Professional school degree: 17
- Doctorate degree: 90
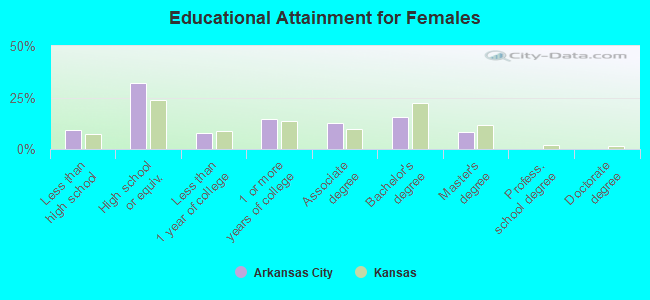
Education attainment for females 25 years and older:
- No schooling: 31
- Nursery to 4th grade: 5
- 5th and 6th grade: 32
- 7th and 8th grade: 20
- 9th grade: 39
- 10th grade: 76
- 11th grade: 28
- 12th grade, no diploma: 125
- High school graduate (or equivalency): 1,238
- Less than 1 year of college: 300
- Some college more than 1 year, no degree: 566
- Associate degree: 479
- Bachelor's degree: 590
- Master's degree: 310
- Professional school degree: 0
- Doctorate degree: 6
Housing units in structures:
- One, detached: 4,160
- One, attached: 13
- Two: 236
- 3 or 4: 318
- 5 to 9: 270
- 10 to 19: 41
- 20 to 49: 185
- 50 or more: 110
- Mobile homes: 320
Median worth of mobile homes: $27,615
Housing units lacking complete kitchen facilities in 2022: 5.8%
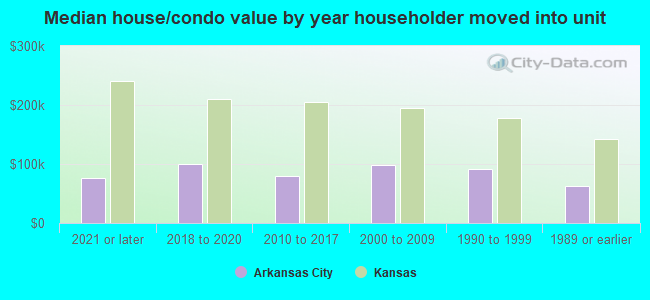
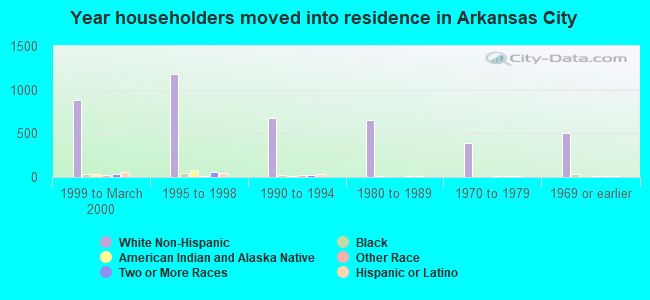
House/condo owner moved in on average 13 years ago
Renter moved in on average 3 years ago
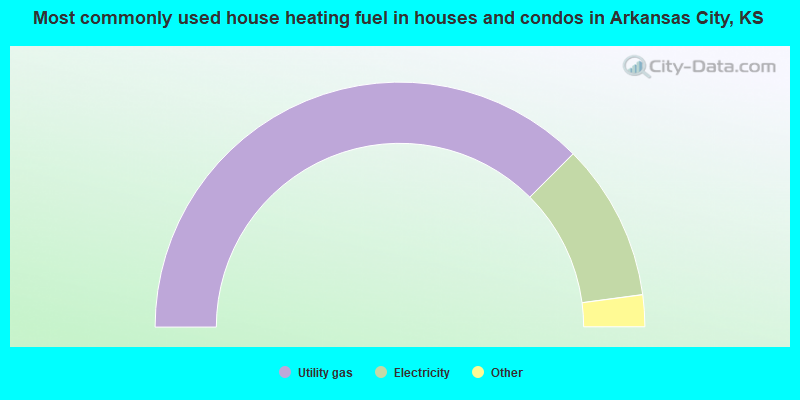
- 75.0%Utility gas
- 20.8%Electricity
- 2.0%Bottled, tank, or LP gas
- 1.1%Wood
- 0.6%Fuel oil, kerosene, etc.
- 0.5%No fuel used
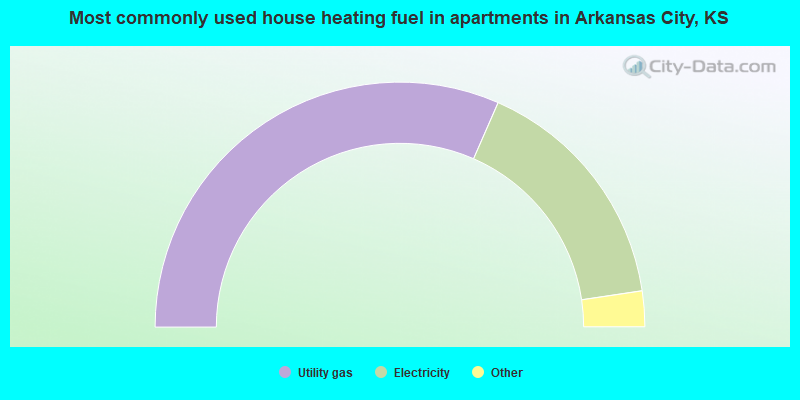
- 63.2%Utility gas
- 32.2%Electricity
- 3.6%Bottled, tank, or LP gas
- 0.6%No fuel used
- 0.3%Wood
- 0.2%Other fuel
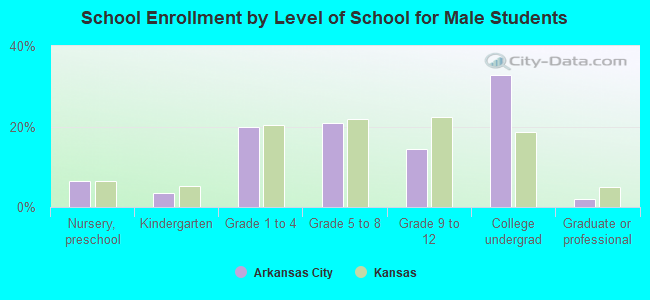
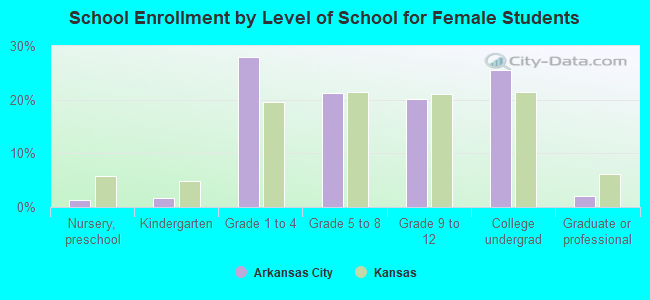
Private vs. public school enrollment:
| Here: | 5.8% |
| Kansas: | 14.1% |
| Here: | 6.7% |
| Kansas: | 10.8% |
| Here: | 40.0% |
| Kansas: | 15.4% |