Arthur, IL (Illinois) Houses and Residents
| Arthur: | $134,797 |
| Illinois: | $251,600 |
Mean price in 2022:
Detached houses: $158,684
Here: $158,684 State: $310,164
Total population: 2,281 (Urban population: 0, Rural population: 2,207 (all nonfarm))
Houses: 969 (920 occupied: 705 owner occupied, 226 renter occupied)
| % of renters here: | 24% |
| State: | 33% |
Housing density: 760 houses/condos per square mile
Median price asked for vacant for-sale houses and condos in 2022 in this county: $34,135.
Median contract rent in 2022: $726 (lower quartile is $616, upper quartile is $871)
Median rent asked for vacant for-rent units in 2022: $815
Median gross rent in Arthur, IL in 2022: $861
Housing units in Arthur with a mortgage: 293 (3 second mortgage, 0 home equity loan, 3 both second mortgage and home equity loan)
Houses without a mortgage: 1
Median household income for houses/condos with a mortgage: $91,192
Median household income for apartments without a mortgage: $47,134
Median monthly housing costs: $783
Compare current foreclosures near Arthur, IL:
| Photo | Address | Area | Beds / Baths | Price | Details |
|---|---|---|---|---|---|

|
#1
E 5th St
Hammond, IL 61929
|
- sq. feet
|
1 baths 4 beds |
$14,900
|
show details |

|
#2
Prairie St
Arthur, IL 61911
|
- sq. feet
|
- baths - beds |
show details | |

|
#3
E Main St
Arcola, IL 61910
|
3,252 sq. feet
|
3 baths 6 beds |
show details | |

|
#4
E County Road 1100n
Mattoon, IL 61938
|
2,346 sq. feet
|
2 baths 4 beds |
show details | |

|
#5
W Ensey St
Tuscola, IL 61953
|
1,764 sq. feet
|
1 baths 2 beds |
show details | |

|
#6
E Scott St
Tuscola, IL 61953
|
1,852 sq. feet
|
2 baths 3 beds |
show details | |

|
#7
Chickadee Ct W
Bethany, IL 61914
|
- sq. feet
|
2 baths 4 beds |
show details | |

|
#8
Polk Dr
Arcola, IL 61910
|
896 sq. feet
|
1 baths 3 beds |
show details | |

|
#9
Lincoln Ave
Arcola, IL 61910
|
754 sq. feet
|
1 baths - beds |
show details | |

|
#10
W Wilson St
Bement, IL 61813
|
- sq. feet
|
2 baths 3 beds |
show details |
| Photo | Address | Area | Beds / Baths | Price | Details |
|---|---|---|---|---|---|

|
#11
E Co Road N, 1400
Humboldt, IL 61931
|
- sq. feet
|
- baths - beds |
show details | |

|
#12
N 34th St
Mattoon, IL 61938
|
- sq. feet
|
- baths - beds |
show details | |

|
#13
N 11th St
Mattoon, IL 61938
|
- sq. feet
|
- baths - beds |
show details | |

|
#14
N 21st St
Mattoon, IL 61938
|
- sq. feet
|
- baths - beds |
show details | |

|
#15
Country Gdns
Mattoon, IL 61938
|
- sq. feet
|
- baths - beds |
show details | |

|
#16
N 23rd St
Mattoon, IL 61938
|
- sq. feet
|
- baths - beds |
show details | |

|
#17
Westwood
Mattoon, IL 61938
|
- sq. feet
|
- baths - beds |
show details | |

|
#18
N 22nd St
Mattoon, IL 61938
|
- sq. feet
|
- baths - beds |
show details | |

|
#19
Tilton St
Ivesdale, IL 61851
|
- sq. feet
|
- baths - beds |
show details | |

|
#20
N 29th St
Mattoon, IL 61938
|
- sq. feet
|
- baths - beds |
show details |
| Photo | Address | Area | Beds / Baths | Price | Details |
|---|---|---|---|---|---|

|
#21
N Piatt St
Bement, IL 61813
|
- sq. feet
|
- baths - beds |
show details | |

|
#22
4th St
Ivesdale, IL 61851
|
- sq. feet
|
- baths - beds |
show details | |

|
#23
E Ficklin St
Tuscola, IL 61953
|
- sq. feet
|
- baths - beds |
show details | |

|
#24
Charleston Ave
Mattoon, IL 61938
|
- sq. feet
|
- baths - beds |
show details | |

|
#25
S Niles Ave
Tuscola, IL 61953
|
- sq. feet
|
- baths - beds |
show details | |

|
#26
S Market St
Sullivan, IL 61951
|
- sq. feet
|
- baths - beds |
show details | |

|
#27
Broadway Ave # 1
Mattoon, IL 61938
|
- sq. feet
|
- baths - beds |
show details | |

|
#28
Western Ave
Mattoon, IL 61938
|
- sq. feet
|
- baths - beds |
show details | |

|
#29
Champaign Ave
Mattoon, IL 61938
|
- sq. feet
|
- baths - beds |
show details | |

|
#30
Richmond Ave
Mattoon, IL 61938
|
- sq. feet
|
- baths - beds |
show details |
| Photo | Address | Area | Beds / Baths | Price | Details |
|---|---|---|---|---|---|

|
#31
Moultrie Ave
Mattoon, IL 61938
|
- sq. feet
|
- baths - beds |
show details | |

|
#32
Park St
Mattoon, IL 61938
|
- sq. feet
|
- baths - beds |
show details | |

|
#33
N Champaign St
Bement, IL 61813
|
- sq. feet
|
- baths - beds |
show details | |

|
#34
Moultrie Ave
Mattoon, IL 61938
|
- sq. feet
|
- baths - beds |
show details | |

|
#35
Shelby Ave
Mattoon, IL 61938
|
- sq. feet
|
- baths - beds |
show details | |

|
#36
Champaign Ave
Mattoon, IL 61938
|
- sq. feet
|
- baths - beds |
show details | |

|
#37
W Forest Ave
Atwood, IL 61913
|
- sq. feet
|
- baths - beds |
show details | |

|
#38
Country Club Rd
Sullivan, IL 61951
|
- sq. feet
|
- baths - beds |
show details | |

|
#39
Country Club Rd
Sullivan, IL 61951
|
- sq. feet
|
- baths - beds |
show details | |

|
#40
S Hamilton St
Sullivan, IL 61951
|
- sq. feet
|
- baths - beds |
show details |
| Photo | Address | Area | Beds / Baths | Price | Details |
|---|---|---|---|---|---|

|
#41
N Juniper Dr
Atwood, IL 61913
|
- sq. feet
|
- baths - beds |
show details | |

|
#42
Prairie Ave
Mattoon, IL 61938
|
- sq. feet
|
- baths - beds |
show details | |

|
Check over 1 million property listings on Foreclosure.com!
|
browse all offers | |||

Latest news about housing in Arthur, IL collected exclusively by city-data.com from local newspapers, TV, and radio stations


Median year apartment built: 1973
Household type by relationship:
Households: 1,964- Male householders: 420 (117 living alone), Female householders: 483 (236 living alone)
424 spouses (424 opposite-sex spouses), 37 unmarried partners, (37 opposite-sex unmarried partners), 462 children (420 natural, 10 adopted, 31 stepchildren), 23 grandchildren, 25 brothers or sisters, 24 parents, 0 foster children, 9 other relatives, 3 non-relatives
- In group quarters: 49
Size of family households: 249 2-persons, 109 3-persons, 98 4-persons, 55 5-persons, 17 6-persons, 3 7-or-more-persons.
Size of nonfamily households: 372 1-person, 24 2-persons.
268 married couples with children.
101 single-parent households (40 men, 61 women).
93.4% of residents of Arthur speak English at home.
1.9% of residents speak Spanish at home (72% speak English very well, 28% speak English well).
5.4% of residents speak other Indo-European language at home (97% speak English very well, 3% speak English well).
Foreign born population: 64 (3.3%)
(54.7% of them are naturalized citizens)
| Here: | 6.5 |
| State: | 6.4 |
| Here: | 4.9 |
| State: | 4.1 |

- Bedrooms in owner-occupied houses and condos in Arthur, Illinois
- 0no bedroom
- 61 bedroom
- 1862 bedrooms
- 3503 bedrooms
- 1594 bedrooms
- 45+ bedrooms

- Bedrooms in renter-occupied apartments in Arthur, Illinois
- 10no bedroom
- 511 bedroom
- 702 bedrooms
- 783 bedrooms
- 124 bedrooms
- 55+ bedrooms

- Cars and other vehicles available in Arthur in owner-occupied houses/condos
- 24no vehicle
- 2231 vehicle
- 3252 vehicles
- 843 vehicles
- 494 vehicles
- 05+ vehicles

- Cars and other vehicles available in Arthur in renter-occupied apartments
- 34no vehicle
- 1181 vehicle
- 652 vehicles
- 103 vehicles
- 04 vehicles
- 05+ vehicles

- Rooms in owner-occupied houses in Arthur, Illinois
- 01 room
- 02 rooms
- 53 rooms
- 574 rooms
- 1285 rooms
- 1636 rooms
- 1347 rooms
- 618 rooms
- 1579+ rooms

- Rooms in renter-occupied apartments in Arthur, Illinois
- 101 room
- 342 rooms
- 123 rooms
- 214 rooms
- 745 rooms
- 286 rooms
- 287 rooms
- 108 rooms
- 89+ rooms


Arthur, IL household income distribution

- 88Less than $10,000
- 73$10,000 to $19,999
- 130$20,000 to $29,999
- 87$30,000 to $39,999
- 92$40,000 to $49,999
- 67$50,000 to $59,999
- 54$60,000 to $74,999
- 133$75,000 to $99,999
- 86$100,000 to $124,999
- 31$125,000 to $149,999
- 80$150,000 to $199,999
- 17$200,000 or more

Home value of owner - occupied houses in 2022 in Arthur, IL
-
- 8Less than $10,000
- 8$10,000 to $14,999
- 4$40,000 to $49,999
- 15$50,000 to $59,999
- 63$60,000 to $69,999
- 47$70,000 to $79,999
- 19$80,000 to $89,999
- 26$90,000 to $99,999
- 141$100,000 to $124,999
- 68$125,000 to $149,999
- 99$150,000 to $174,999
- 36$175,000 to $199,999
- 51$200,000 to $249,999
- 40$250,000 to $299,999
- 50$300,000 to $399,999
- 3$400,000 to $499,999
- 4$500,000 to $749,999

Rent paid by renters in 2022 in Arthur, IL
-
- 3Less than $100
- 8$250 to $299
- 8$400 to $449
- 5$450 to $499
- 7$500 to $549
- 4$550 to $599
- 34$600 to $649
- 11$650 to $699
- 38$700 to $749
- 33$750 to $799
- 10$800 to $899
- 14$900 to $999
- 33$1,500 to $1,999
- 2$2,500 to $2,999
- 12No cash rent

Percentage of workers working in this county: 55.9%
Number of people working at home: 82 (9.8% of all workers)
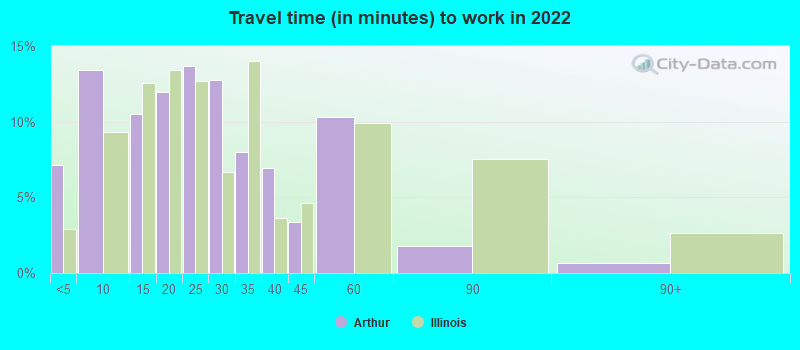
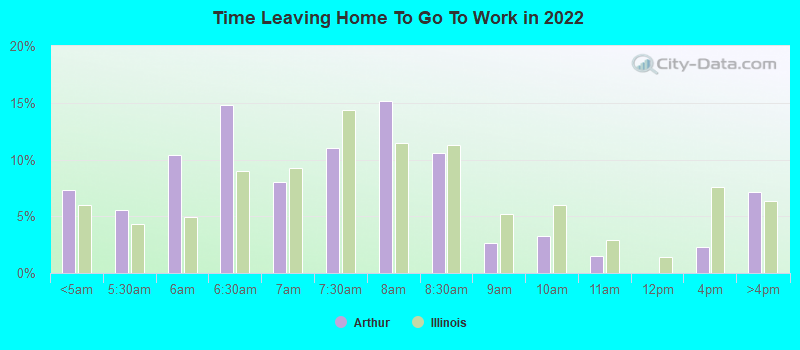
Travel time to work (commute)
- Less than 5 minutes: 139
- 5 to 9 minutes: 183
- 10 to 14 minutes: 82
- 15 to 19 minutes: 39
- 20 to 24 minutes: 115
- 25 to 29 minutes: 19
- 30 to 34 minutes: 31
- 35 to 39 minutes: 3
- 40 to 44 minutes: 10
- 45 to 59 minutes: 108
- 60 to 89 minutes: 13
- 90 or more minutes: 0
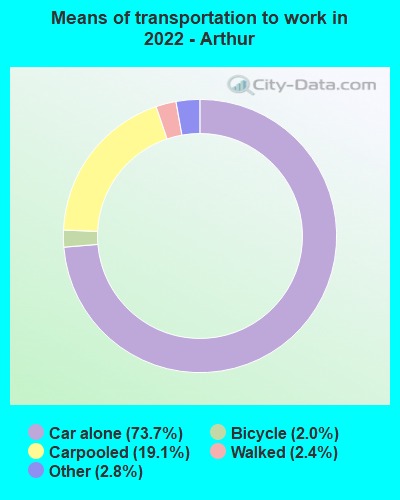
Means of transportation to work:
- Drove a car alone: 1,643 (69.1%)
- Carpooled: 453 (19.1%)
- Taxi: 68 (2.9%)
- Bicycle: 48 (2.0%)
- Walked: 54 (2.3%)
- Worked at home: 82 (3.4%)
- Unemployment by race in 2022
- Unemployment rate for White non-Hispanic residents
- 0.8%Males
- 5.7%Females
- Unemployment rate for other race residents
- 59.3%Females
- Unemployment rate for Hispanic or Latino residents
- 59.4%Females

- Year of entry for the foreign-born population in Arthur, Illinois
- 02010 or later
- 92000 to 2009
- 401990 to 1999
- 01980 to 1989
- 01970 to 1979
- 8Before 1970

First ancestries reported:
- German: 445 (51.1%)
- American: 115 (13.2%)
- Irish: 54 (6.2%)
- English: 43 (4.9%)
- Pennsylvania German: 36 (4.1%)
- European: 18 (2.1%)
- Scottish: 14 (1.6%)
- Dutch: 10 (1.1%)
- British: 4 (0.5%)
- Italian: 3 (0.3%)
- Scotch-Irish: 3 (0.3%)
- Swiss: 2 (0.2%)
- Swedish: 1 (0.1%)
Most common places of birth for foreign-born residents (%):
| Arthur: | 40.6% (26) |
| Illinois: | 1.1% (19,306) |
| Arthur: | 29.7% (19) |
| Illinois: | 0.5% (9,688) |
| Arthur: | 23.4% (15) |
| Illinois: | 0.9% (15,679) |
| Arthur: | 14.1% (9) |
| Illinois: | 34.7% (626,958) |
Place of birth for U.S.-born residents:
- This state: 1,427
- Other state: 463
- Northeast: 54
- Midwest: 262
- South: 107
- West: 38
88.5% of Arthur residents lived in the same house 1 years ago.
Out of people who lived in different houses, 22.0% lived in this county.
Out of people who lived in different counties, 44.4% lived in Illinois.
| Arthur: | 88.5% |
| State average: | 88.3% |
Education attainment for males 25 years and older:
- No schooling: 7
- Nursery to 4th grade: 0
- 5th and 6th grade: 0
- 7th and 8th grade: 49
- 9th grade: 6
- 10th grade: 14
- 11th grade: 13
- 12th grade, no diploma: 5
- High school graduate (or equivalency): 183
- Less than 1 year of college: 61
- Some college more than 1 year, no degree: 97
- Associate degree: 26
- Bachelor's degree: 95
- Master's degree: 33
- Professional school degree: 4
- Doctorate degree: 4

Education attainment for females 25 years and older:
- No schooling: 0
- Nursery to 4th grade: 0
- 5th and 6th grade: 0
- 7th and 8th grade: 36
- 9th grade: 49
- 10th grade: 8
- 11th grade: 8
- 12th grade, no diploma: 0
- High school graduate (or equivalency): 231
- Less than 1 year of college: 107
- Some college more than 1 year, no degree: 138
- Associate degree: 62
- Bachelor's degree: 117
- Master's degree: 48
- Professional school degree: 5
- Doctorate degree: 0


Housing units in structures:
- One, detached: 821
- One, attached: 27
- Two: 11
- 5 to 9: 21
- 20 to 49: 82
- Mobile homes: 6
Housing units lacking complete kitchen facilities in 2022: 5.6%
House/condo owner moved in on average 7 years ago
Renter moved in on average 3 years ago


- 70.3%Utility gas
- 27.6%Electricity
- 1.3%Other fuel
- 0.9%No fuel used

- 49.8%Electricity
- 46.2%Utility gas
- 4.0%No fuel used
Private vs. public school enrollment:
| Here: | 22.4% |
| Illinois: | 13.3% |
| Here: | 10.3% |
| Illinois: | 9.9% |
| Here: | 8.9% |
| Illinois: | 27.4% |


