Housing density: 4,332 houses/condos per square mile
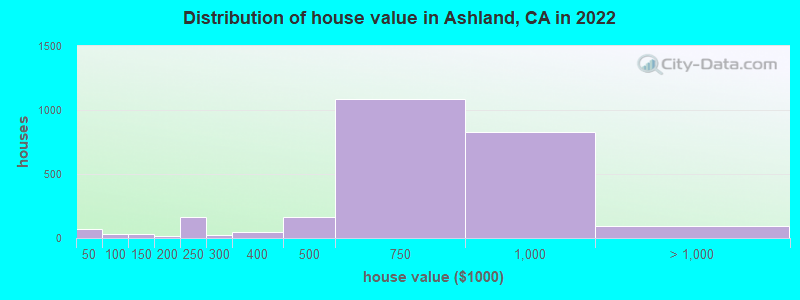
Median price asked for vacant for-sale houses and condos in 2022: $995,884.
Median contract rent in 2022: $1,795 (lower quartile is $1,410, upper quartile is over $2,000)
Median rent asked for vacant for-rent units in 2022: $2,264
Median gross rent in Ashland, CA in 2022: $1,952
Housing units in Ashland with a mortgage: 1,895 (86 second mortgage, 0 home equity loan, 73 both second mortgage and home equity loan) Houses without a mortgage: 0
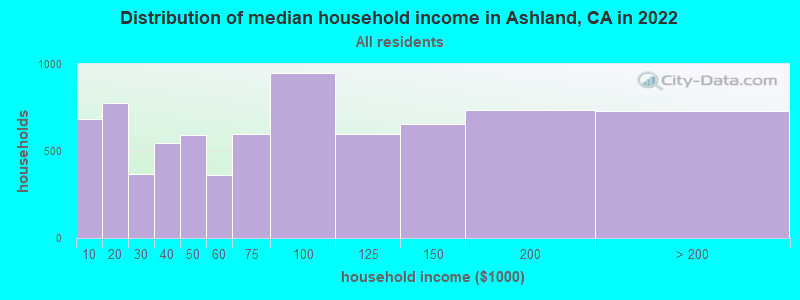
Median household income for houses/condos with a mortgage: $100,936
Median household income for apartments without a mortgage: $84,324
2,702 married couples with children.
1,755 single-parent households (412 men, 1,343 women).
40.1% of residents of Ashland speak English at home.
32.9% of residents speak Spanish at home (45% speak English very well, 24% speak English well, 20% speak English not well, 12% don't speak English at all).
4.5% of residents speak other Indo-European language at home (54% speak English very well, 34% speak English well, 11% speak English not well, 2% don't speak English at all).
20.3% of residents speak Asian or Pacific Island language at home (38% speak English very well, 29% speak English well, 21% speak English not well, 12% don't speak English at all).
3.1% of residents speak other language at home (66% speak English very well, 8% speak English well, 26% speak English not well).
Foreign born population: 9,205 (40.6%)
(48.9% of them are naturalized citizens)
Percentage of workers working in this county: 83.5% Number of people working at home: 1,179 (10.6% of all workers)
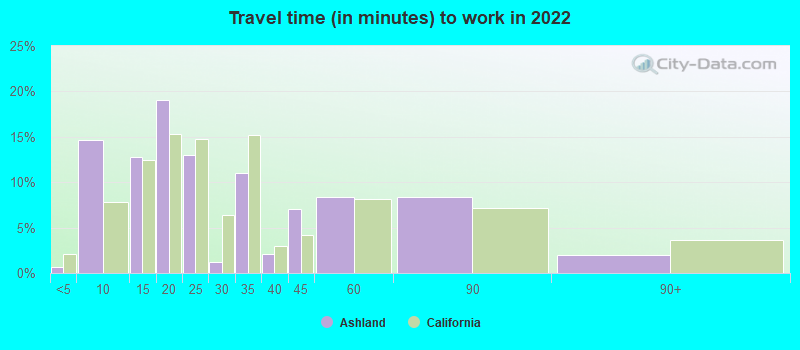
Travel time to work (commute)
Less than 5 minutes: 198
5 to 9 minutes: 489
10 to 14 minutes: 841
15 to 19 minutes: 1,588
20 to 24 minutes: 1,340
25 to 29 minutes: 504
30 to 34 minutes: 1,715
35 to 39 minutes: 301
40 to 44 minutes: 441
45 to 59 minutes: 789
60 to 89 minutes: 967
90 or more minutes: 154
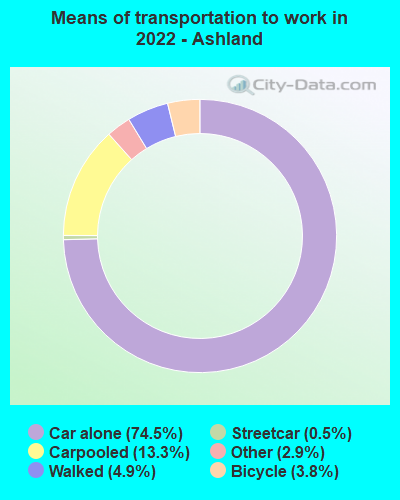
Means of transportation to work:
Drove a car alone: 1,451 (48.2%)
Carpooled: 271 (9.0%)
Subway or elevated rail: 7 (0.2%)
Taxi: 60 (2.0%)
Bicycle: 82 (2.7%)
Walked: 96 (3.2%)
Worked at home: 1,179 (39.2%)
Unemployment by race in 2022
Unemployment rate for White non-Hispanic residents
1.0%Males
5.0%Females
Unemployment rate for Black residents
0.9%Males
7.4%Females
Unemployment rate for American Indian and Alaska Native residents
27.0%Males
31.7%Females
Unemployment rate for Asian residents
8.5%Males
8.3%Females
Unemployment rate for other race residents
3.6%Males
9.5%Females
Unemployment rate for two or more race residents
5.2%Males
4.5%Females
Unemployment rate for Hispanic or Latino residents
4.1%Males
10.5%Females
Year of entry for the foreign-born population in Ashland, California
2,5752010 or later
1,8752000 to 2009
2,2541990 to 1999
2,0041980 to 1989
7411970 to 1979
450Before 1970
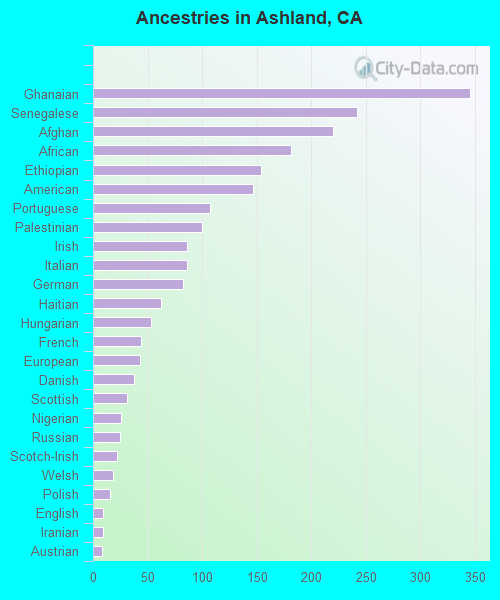
First ancestries reported:
Ghanaian: 346 (2.3%)
Senegalese: 242 (1.6%)
Afghan: 220 (1.4%)
African: 182 (1.2%)
Ethiopian: 154 (1.0%)
American: 147 (1.0%)
Portuguese: 107 (0.7%)
Palestinian: 100 (0.7%)
Irish: 86 (0.6%)
Italian: 86 (0.6%)
German: 83 (0.5%)
Haitian: 62 (0.4%)
Hungarian: 53 (0.3%)
French: 44 (0.3%)
European: 43 (0.3%)
Danish: 38 (0.3%)
Scottish: 31 (0.2%)
Nigerian: 26 (0.2%)
Russian: 25 (0.2%)
Scotch-Irish: 22 (0.1%)
Welsh: 18 (0.1%)
Polish: 16 (0.1%)
English: 9 (0.06%)
Iranian: 9 (0.06%)
Austrian: 8 (0.05%)
Ukrainian: 8 (0.05%)
Dutch: 3 (0.02%)
Most common places of birth for foreign-born residents (%):
Mexico
Ashland:
30.3% (2,788)
California:
37.2% (3,881,193)
China, excluding Hong Kong and Taiwan
Ashland:
16.5% (1,515)
California:
6.6% (684,672)
Philippines
Ashland:
15.1% (1,394)
California:
7.8% (818,297)
Vietnam
Ashland:
6.1% (557)
California:
4.9% (512,335)
El Salvador
Ashland:
4.5% (418)
California:
4.2% (440,287)
Ghana
Ashland:
3.3% (301)
California:
0.1% (8,814)
Afghanistan
Ashland:
2.8% (259)
California:
0.5% (53,260)
India
Ashland:
2.4% (217)
California:
5.2% (539,184)
Honduras
Ashland:
2.2% (200)
California:
0.6% (66,590)
Nicaragua
Ashland:
2.2% (199)
California:
0.6% (58,161)
Nepal
Ashland:
1.8% (163)
California:
0.2% (16,541)
Fiji
Ashland:
1.5% (139)
California:
0.3% (33,937)
Place of birth for U.S.-born residents:
This state: 11,620
Other state: 1,654
Northeast: 233
Midwest: 406
South: 680
West: 313
91.4% of Ashland residents lived in the same house 1 years ago. Out of people who lived in different houses, 43.0% lived in this county. Out of people who lived in different counties, 92.3% lived in California.
Ashland:
91.4%
State average:
88.9%
Education attainment for males 25 years and older:
No schooling: 328
Nursery to 4th grade: 133
5th and 6th grade: 347
7th and 8th grade: 201
9th grade: 105
10th grade: 62
11th grade: 75
12th grade, no diploma: 341
High school graduate (or equivalency): 1,969
Less than 1 year of college: 375
Some college more than 1 year, no degree: 1,273
Associate degree: 360
Bachelor's degree: 1,174
Master's degree: 342
Professional school degree: 20
Doctorate degree: 48
Education attainment for females 25 years and older:
No schooling: 792
Nursery to 4th grade: 191
5th and 6th grade: 298
7th and 8th grade: 42
9th grade: 168
10th grade: 49
11th grade: 45
12th grade, no diploma: 204
High school graduate (or equivalency): 1,948
Less than 1 year of college: 575
Some college more than 1 year, no degree: 1,188
Associate degree: 739
Bachelor's degree: 1,367
Master's degree: 552
Professional school degree: 38
Doctorate degree: 20
Housing units in structures:
One, detached: 3,204
One, attached: 606
Two: 268
3 or 4: 509
5 to 9: 541
10 to 19: 535
20 to 49: 754
50 or more: 1,350
Mobile homes: 166
Boats, RVs, vans, etc.: 44
Housing units lacking complete plumbing facilities in 2022: 0.3%
Housing units lacking complete kitchen facilities in 2022: 0.9%
House/condo owner moved in on average 12 years ago