Aspen Hill, MD (Maryland) Houses and Residents
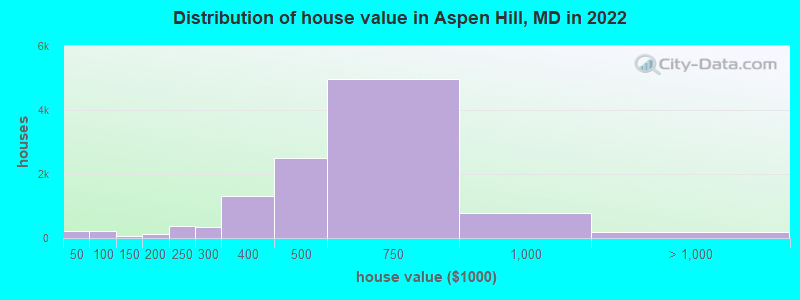
Estimated median house or condo value in 2022: $516,932 (it was $185,800 in 2000 )
Aspen Hill:
$516,932Maryland:
$398,100
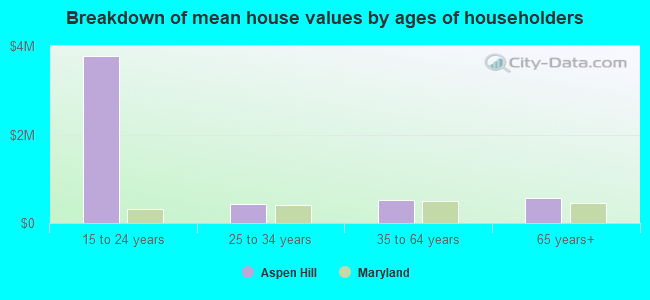
Lower value quartile - upper value quartile: $412,576 - $657,086Mean price in 2022: Detached houses: $624,705 Here:
$624,705State:
$526,819
Townhouses or other attached units: $415,698 Here:
$415,698State:
$328,305
In 3-to-4-unit structures: $406,381 Here:
$406,381State:
$295,378
In 5-or-more-unit structures: $204,185 Here:
$204,185State:
$350,378
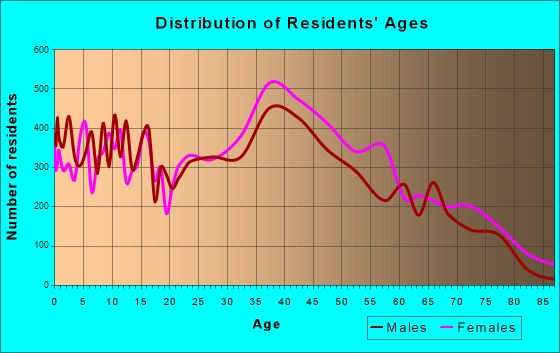
Total population: 48,759 (All urban)
Houses: 18,053 (17,506 occupied: 11,230 owner occupied, 6,409 renter occupied )
% of renters here:
36%State:
32%
Housing density: 1,725 houses/condos per square mile
Median price asked for vacant for-sale houses and condos in 2022: $502,069.
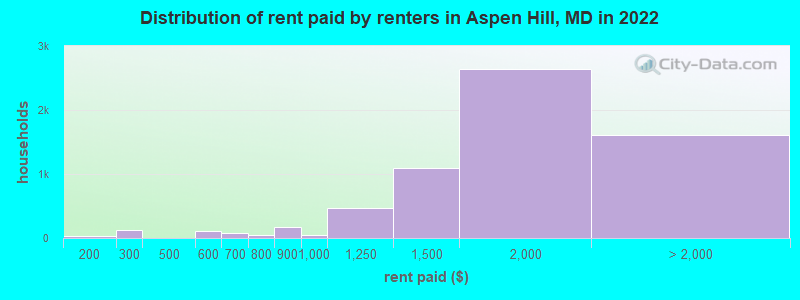
Median contract rent in 2022: $1,668 (lower quartile is $1,340, upper quartile is $1,998)
Median rent asked for vacant for-rent units in 2022: $1,156
Median gross rent in Aspen Hill, MD in 2022: $1,783
Housing units in Aspen Hill with a mortgage: 8,043 (983 second mortgage, 18 home equity loan, 801 both second mortgage and home equity loan )Houses without a mortgage: 49
Median household income for houses/condos with a mortgage: $140,850
Median household income for apartments without a mortgage: $120,445
Median monthly housing costs: $1,870
Data:
Median house or condo value ($)
Median house or condo value ($ change since 2000)
Median house or condo value ($) - White
Median house or condo value ($) - Black or African American
Median house or condo value ($) - Asian
Median house or condo value ($) - Hispanic or Latino
Median house or condo value ($) - American Indian and Alaska Native
Median house or condo value ($) - Multirace
Median house or condo value ($) - Other Race
Median price asked for mobile homes ($)
Household density (households per square mile)
Mean house or condo value by units in structure - 1, detached ($)
Mean house or condo value by units in structure - 1, attached ($)
Mean house or condo value by units in structure - 2 ($)
Mean house or condo value by units in structure by units in structure - 3 or 4 ($)
Mean house or condo value by units in structure - 5 or more ($)
Mean house or condo value by units in structure - Boat, RV, van, etc. ($)
Mean house or condo value by units in structure - Mobile home ($)
Median contract rent ($)
Median contract rent - Lower quartile ($)
Median contract rent - Upper quartile ($)
Median gross rent ($)
Urban houses (%)
Rural houses (%)
Houses occupied (%)
Houses occupied (% change since 2000)
Houses owner occupied (%)
Houses owner occupied (% change since 2000)
Houses renter occupied (%)
Houses renter occupied (% change since 2000)
Vacant housing units - For rent (%)
Vacant housing units - For rent (% change since 2000)
Vacant housing units - For sale only (%)
Vacant housing units - For sale only (% change since 2000)
Vacant housing units - Rented or sold, not occupied (%)
Vacant housing units - Rented or sold, not occupied (% change since 2000)
Vacant housing units - For seasonal, recreational, or occasional use (%)
Vacant housing units - For seasonal, recreational, or occasional use (% change since 2000)
Vacant housing units - For migrant workers (%)
Vacant housing units - For migrant workers (% change since 2000)
Vacant housing units - Other vacant (%)
Vacant housing units - Other vacant (% change since 2000)
Median monthly housing costs ($)
Median household income for houses/condos with a mortgage ($)
Median household income for houses/condos without a mortgage ($)
Median household income ($)
Median household income ($) - White
Median household income ($) - Black or African American
Median household income ($) - Asian
Median household income ($) - Hispanic or Latino
Median household income ($) - American Indian and Alaska Native
Median household income ($) - Multirace
Median household income ($) - Other Race
Mortgage status - with mortgage (%)
Mortgage status - with second mortgage (%)
Mortgage status - with home equity loan (%)
Mortgage status - with both second mortgage and home equity loan (%)
Mortgage status - without a mortgage (%)
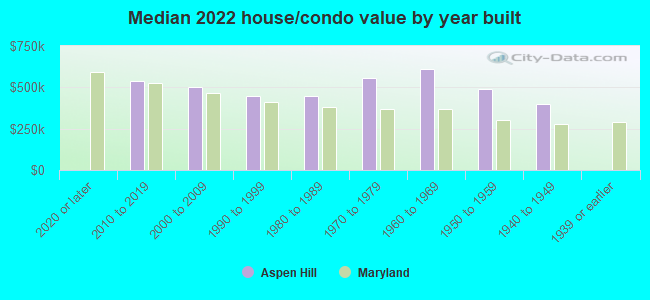
Median year house/condo built
Median year apartment built
Household type by relationship - Male householder living alone (%)
Household type by relationship - Male householder not living alone (%)
Household type by relationship - Female householder living alone (%)
Household type by relationship - Female householder not living alone (%)
Household type by relationship - Opposite-Sex spouse (%)
Household type by relationship - Same-Sex spouse (%)
Household type by relationship - Opposite-Sex unmarried partner (%)
Household type by relationship - Same-Sex unmarried partner (%)
Household type by relationship - In group quarters (%)
Size of family households - 2-person household (%)
Size of family households - 3-person household (%)
Size of family households - 4-person household (%)
Size of family households - 5-person household (%)
Size of family households - 6-person household (%)
Size of family households - 7-or-more-person household (%)
Size of nonfamily households - 1-person household (%)
Size of nonfamily households - 2-person household (%)
Size of nonfamily households - 3-person household (%)
Size of nonfamily households - 4-person household (%)
Size of nonfamily households - 5-person household (%)
Size of nonfamily households - 6-person household (%)
Size of nonfamily households - 7-or-moreperson household (%)
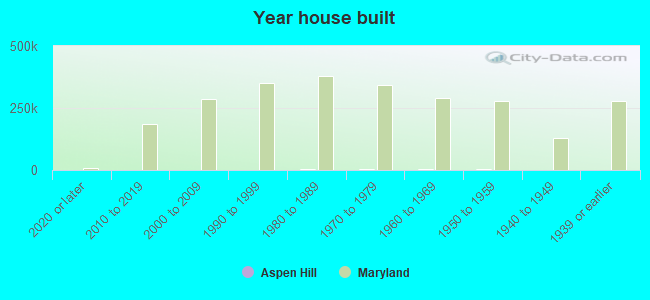
Year house built - Built 2010 or later (%)
Year house built - Built 2000 to 2009 (%)
Year house built - Built 1990 to 1999 (%)
Year house built - Built 1980 to 1989 (%)
Year house built - Built 1970 to 1979 (%)
Year house built - Built 1960 to 1969 (%)
Year house built - Built 1950 to 1959 (%)
Year house built - Built 1940 to 1949 (%)
Year house built - Built 1939 or earlier (%)
Median number of rooms in houses and condos
Median number of rooms in apartments
Median number of bedrooms in owner occupied houses
Mean number of bedrooms in owner occupied houses
Median number of bedrooms in renter occupied houses
Mean number of bedrooms in renter occupied houses
Median number of vehichles in owner occupied houses
Mean number of vehichles in owner occupied houses
Median number of vehichles in renter occupied houses
Mean number of vehichles in renter occupied houses
Rooms in owner-occupied houses - 1 room (%)
Rooms in owner-occupied houses - 2 rooms (%)
Rooms in owner-occupied houses - 3 rooms (%)
Rooms in owner-occupied houses - 4 rooms (%)
Rooms in owner-occupied houses - 5 rooms (%)
Rooms in owner-occupied houses - 6 rooms (%)
Rooms in owner-occupied houses - 7 rooms (%)
Rooms in owner-occupied houses - 8 rooms (%)
Rooms in owner-occupied houses - 9+ rooms (%)
Rooms in renter-occupied houses - 1 room (%)
Rooms in renter-occupied houses - 2 rooms (%)
Rooms in renter-occupied houses - 3 rooms (%)
Rooms in renter-occupied houses - 4 rooms (%)
Rooms in renter-occupied houses - 5 rooms (%)
Rooms in renter-occupied houses - 6 rooms (%)
Rooms in renter-occupied houses - 7 rooms (%)
Rooms in renter-occupied houses - 8 rooms (%)
Rooms in renter-occupied houses - 9+ rooms (%)
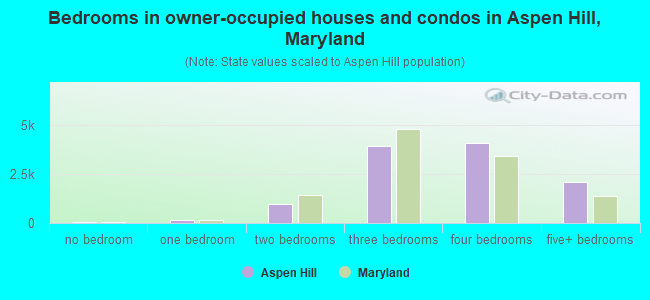
Bedrooms in owner-occupied houses - no bedrooms (%)
Bedrooms in owner-occupied houses - 1 bedroom (%)
Bedrooms in owner-occupied houses - 2 bedrooms (%)
Bedrooms in owner-occupied houses - 3 bedrooms (%)
Bedrooms in owner-occupied houses - 4 bedrooms (%)
Bedrooms in owner-occupied houses - 5+ bedrooms (%)
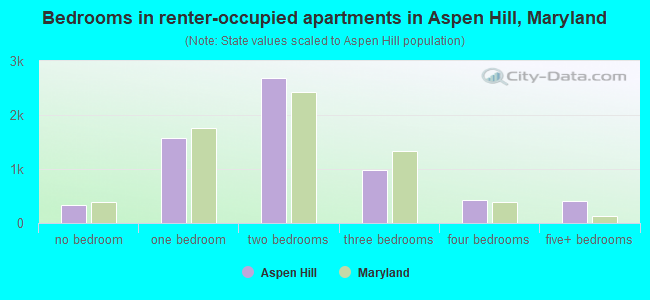
Bedrooms in renter-occupied houses - no bedrooms (%)
Bedrooms in renter-occupied houses - 1 bedroom (%)
Bedrooms in renter-occupied houses - 2 bedrooms (%)
Bedrooms in renter-occupied houses - 3 bedrooms (%)
Bedrooms in renter-occupied houses - 4 bedrooms (%)
Bedrooms in renter-occupied houses - 5+ bedrooms (%)
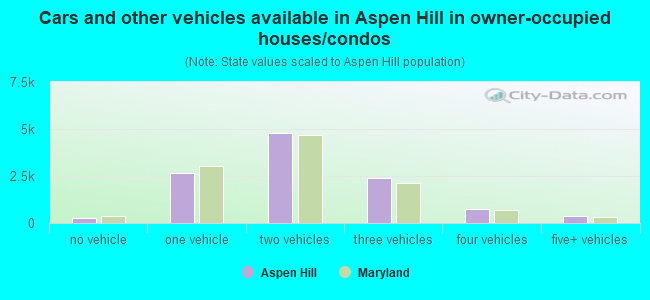
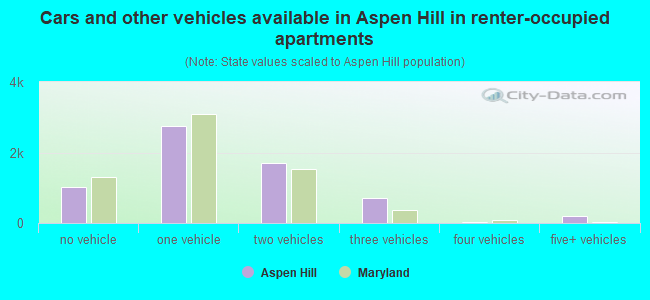
Vehicles available in owner-occupied houses - no vehicle available (%)
Vehicles available in owner-occupied houses - 1 vehicle available(%)
Vehicles available in owner-occupied houses - 2 Vehicles available (%)
Vehicles available in owner-occupied houses - 3 Vehicles available (%)
Vehicles available in owner-occupied houses - 4 Vehicles available (%)
Vehicles available in owner-occupied houses - 5+ Vehicles available (%)
Vehicles available in renter-occupied houses - no vehicle available (%)
Vehicles available in renter-occupied houses - 1 vehicle available (%)
Vehicles available in renter-occupied houses - 2 Vehicles available (%)
Vehicles available in renter-occupied houses - 3 Vehicles available (%)
Vehicles available in renter-occupied houses - 4 Vehicles available (%)
Vehicles available in renter-occupied houses - 5+ Vehicles available (%)
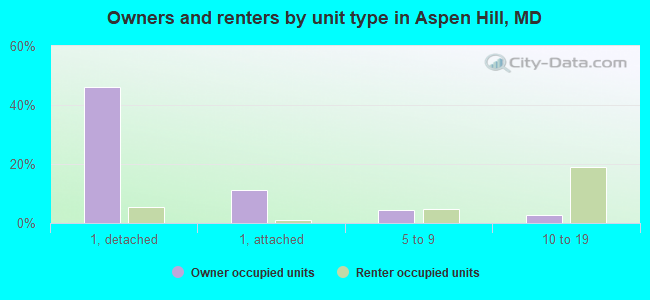
Housing units in structures - 1, detached (%)
Housing units in structures - 1, attached (%)
Housing units in structures - 2 (%)
Housing units in structures - 3 or 4 (%)
Housing units in structures - 5 to 9 (%)
Housing units in structures - 10 to 19 (%)
Housing units in structures - 20 to 49 (%)
Housing units in structures - 50 or more (%)
Housing units in structures - Mobile home (%)
Housing units in structures - Boat, RV, van, etc. (%)
Housing units in structures - Owners - 1, detached (%)
Housing units in structures - Owners - 1, attached (%)
Housing units in structures - Owners - 2 (%)
Housing units in structures - Owners - 3 or 4 (%)
Housing units in structures - Owners - 5 to 9 (%)
Housing units in structures - Owners - 10 to 19 (%)
Housing units in structures - Owners - 20 to 49 (%)
Housing units in structures - Owners - 50 or more (%)
Housing units in structures - Owners - Mobile home (%)
Housing units in structures - Owners - Boat, RV, van, etc. (%)
Housing units in structures - Renters - 1, detached (%)
Housing units in structures - Renters - 1, attached (%)
Housing units in structures - Renters - 2 (%)
Housing units in structures - Renters - 3 or 4 (%)
Housing units in structures - Renters - 5 to 9 (%)
Housing units in structures - Renters - 10 to 19 (%)
Housing units in structures - Renters - 20 to 49 (%)
Housing units in structures - Renters - 50 or more (%)
Housing units in structures - Renters - Mobile home (%)
Housing units in structures - Renters - Boat, RV, van, etc. (%)
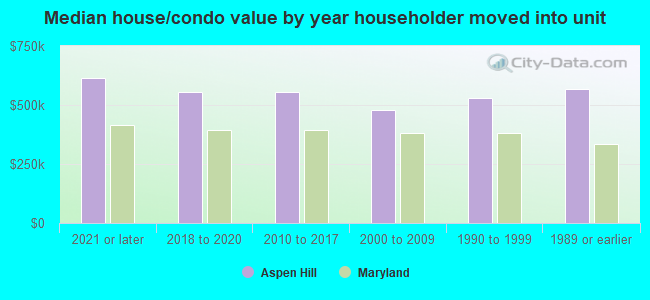
House/condo owner moved in on average (years ago)
Renter moved in on average (years ago)
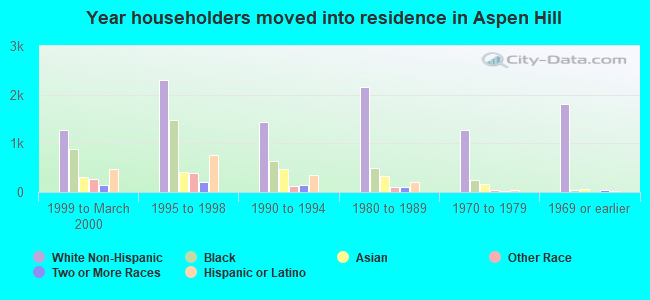
Year householder moved into unit - Moved in 1999 to March 2000 (%)
Year householder moved into unit - Moved in 1999 to March 2000 (%) - White
Year householder moved into unit - Moved in 1999 to March 2000 (%) - Black or African American
Year householder moved into unit - Moved in 1999 to March 2000 (%) - Asian
Year householder moved into unit - Moved in 1999 to March 2000 (%) - Hispanic or Latino
Year householder moved into unit - Moved in 1999 to March 2000 (%) - American Indian and Alaska Native
Year householder moved into unit - Moved in 1999 to March 2000 (%) - Multirace
Year householder moved into unit - Moved in 1999 to March 2000 (%) - Other Race
Year householder moved into unit - Moved in 1995 to 1998 (%)
Year householder moved into unit - Moved in 1995 to 1998 (%) - White
Year householder moved into unit - Moved in 1995 to 1998 (%) - Black or African American
Year householder moved into unit - Moved in 1995 to 1998 (%) - Asian
Year householder moved into unit - Moved in 1995 to 1998 (%) - Hispanic or Latino
Year householder moved into unit - Moved in 1995 to 1998 (%) - American Indian and Alaska Native
Year householder moved into unit - Moved in 1995 to 1998 (%) - Multirace
Year householder moved into unit - Moved in 1995 to 1998 (%) - Other Race
Year householder moved into unit - Moved in 1990 to 1994 (%)
Year householder moved into unit - Moved in 1990 to 1994 (%) - White
Year householder moved into unit - Moved in 1990 to 1994 (%) - Black or African American
Year householder moved into unit - Moved in 1990 to 1994 (%) - Asian
Year householder moved into unit - Moved in 1990 to 1994 (%) - Hispanic or Latino
Year householder moved into unit - Moved in 1990 to 1994 (%) - American Indian and Alaska Native
Year householder moved into unit - Moved in 1990 to 1994 (%) - Multirace
Year householder moved into unit - Moved in 1990 to 1994 (%) - Other Race
Year householder moved into unit - Moved in 1980 to 1989 (%)
Year householder moved into unit - Moved in 1980 to 1989 (%) - White
Year householder moved into unit - Moved in 1980 to 1989 (%) - Black or African American
Year householder moved into unit - Moved in 1980 to 1989 (%) - Asian
Year householder moved into unit - Moved in 1980 to 1989 (%) - Hispanic or Latino
Year householder moved into unit - Moved in 1980 to 1989 (%) - American Indian and Alaska Native
Year householder moved into unit - Moved in 1980 to 1989 (%) - Multirace
Year householder moved into unit - Moved in 1980 to 1989 (%) - Other Race
Year householder moved into unit - Moved in 1970 to 1979 (%)
Year householder moved into unit - Moved in 1970 to 1979 (%) - White
Year householder moved into unit - Moved in 1970 to 1979 (%) - Black or African American
Year householder moved into unit - Moved in 1970 to 1979 (%) - Asian
Year householder moved into unit - Moved in 1970 to 1979 (%) - Hispanic or Latino
Year householder moved into unit - Moved in 1970 to 1979 (%) - American Indian and Alaska Native
Year householder moved into unit - Moved in 1970 to 1979 (%) - Multirace
Year householder moved into unit - Moved in 1970 to 1979 (%) - Other Race
Year householder moved into unit - Moved in 1969 or earlier (%)
Year householder moved into unit - Moved in 1969 or earlier (%) - White
Year householder moved into unit - Moved in 1969 or earlier (%) - Black or African American
Year householder moved into unit - Moved in 1969 or earlier (%) - Asian
Year householder moved into unit - Moved in 1969 or earlier (%) - Hispanic or Latino
Year householder moved into unit - Moved in 1969 or earlier (%) - American Indian and Alaska Native
Year householder moved into unit - Moved in 1969 or earlier (%) - Multirace
Year householder moved into unit - Moved in 1969 or earlier (%) - Other Race
Housing units lacking complete plumbing facilities (%)
Housing units lacking complete kitchen facilities (%)
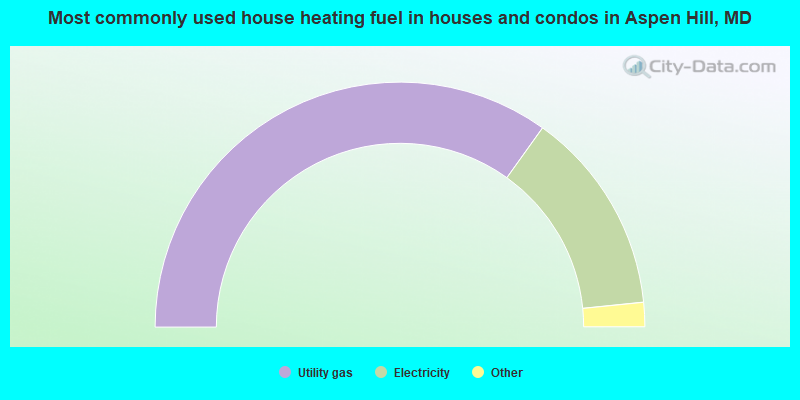
House heating fuel used in houses and condos - Utility gas (%)
House heating fuel used in houses and condos - Bottled, tank, or LP gas (%)
House heating fuel used in houses and condos - Electricity (%)
House heating fuel used in houses and condos - Fuel oil, kerosene, etc. (%)
House heating fuel used in houses and condos - Coal or coke (%)
House heating fuel used in houses and condos - Wood (%)
House heating fuel used in houses and condos - Solar energy (%)
House heating fuel used in houses and condos - Other fuel (%)
House heating fuel used in houses and condos - No fuel used (%)
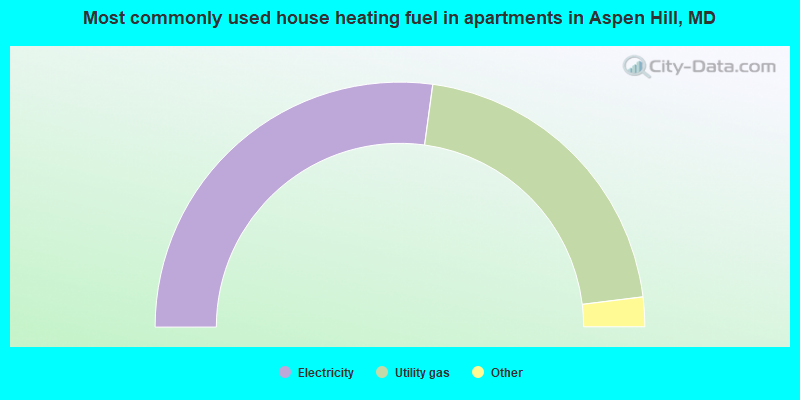
House heating fuel used in apartments - Utility gas (%)
House heating fuel used in apartments - Bottled, tank, or LP gas (%)
House heating fuel used in apartments - Electricity (%)
House heating fuel used in apartments - Fuel oil, kerosene, etc. (%)
House heating fuel used in apartments - Coal or coke (%)
House heating fuel used in apartments - Wood (%)
House heating fuel used in apartments - Solar energy (%)
House heating fuel used in apartments - Other fuel (%)
House heating fuel used in apartments - No fuel used (%)
Median year house/condo built: 1968Median year apartment built: 1978Household type by relationship:
Households: 54,036
Male householders: 8,414 (950 living alone ), Female householders: 8,881 (2,328 living alone )9,087 spouses (9,001 opposite-sex spouses ), 1,369 unmarried partners , (1,305 opposite-sex unmarried partners ), 16,962 children (15,767 natural , 404 adopted , 790 stepchildren ), 1,397 grandchildren , 1,283 brothers or sisters , 1,552 parents , 0 foster children , 1,918 other relatives , 2,768 non-relatives In group quarters: 401
Size of family households: 3,955 2-persons , 2,924 3-persons , 2,779 4-persons , 1,555 5-persons , 480 6-persons , 801 7-or-more-persons .
Size of nonfamily households: 3,744 1-person , 763 2-persons , 314 3-persons , 31 4-persons , 60 6-persons .
8,851 married couples with children. single-parent households (598 men , 1,744 women ).
49.2% of residents of Aspen Hill speak English at home. of residents speak Spanish at home (51% speak English very well , 20% speak English well , 25% speak English not well , 4% don't speak English at all ).of residents speak other Indo-European language at home (62% speak English very well , 21% speak English well , 14% speak English not well , 2% don't speak English at all ).of residents speak Asian or Pacific Island language at home (56% speak English very well , 19% speak English well , 22% speak English not well , 3% don't speak English at all ).of residents speak other language at home (87% speak English very well , 9% speak English well , 1% speak English not well , 3% don't speak English at all ).
Foreign born population: 21,224 (39.3%)of them are naturalized citizens )
Median number of rooms in houses and condos:
Median number of rooms in apartments
Owner-occupied Renter-occupied
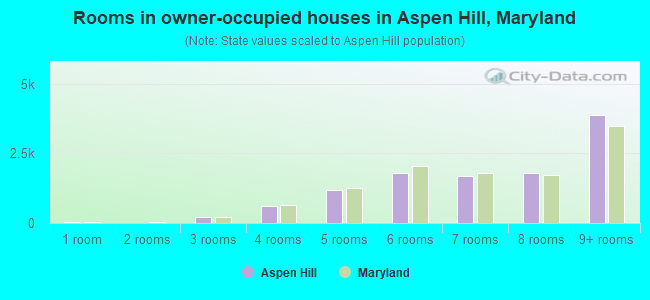
Rooms in owner-occupied houses in Aspen Hill, Maryland
46 1 room 0 2 rooms 203 3 rooms 619 4 rooms 1,183 5 rooms 1,800 6 rooms 1,698 7 rooms 1,801 8 rooms 3,882 9+ rooms
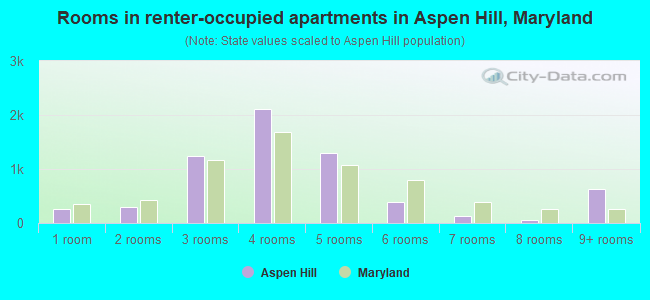
Rooms in renter-occupied apartments in Aspen Hill, Maryland
260 1 room 304 2 rooms 1,245 3 rooms 2,106 4 rooms 1,293 5 rooms 384 6 rooms 137 7 rooms 54 8 rooms 627 9+ rooms
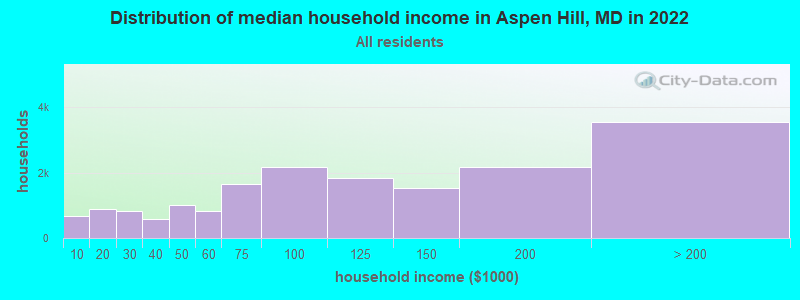
Aspen Hill, MD household income distribution 670 Less than $10,000874 $10,000 to $19,999831 $20,000 to $29,999582 $30,000 to $39,999996 $40,000 to $49,999828 $50,000 to $59,9991,661 $60,000 to $74,9992,176 $75,000 to $99,9991,819 $100,000 to $124,9991,530 $125,000 to $149,9992,180 $150,000 to $199,9993,546 $200,000 or more
Home value of owner - occupied houses in 2022 in Aspen Hill, MD 86 Less than $10,00032 $35,000 to $39,999108 $40,000 to $49,99917 $50,000 to $59,9998 $70,000 to $79,99973 $90,000 to $99,99959 $100,000 to $124,99948 $150,000 to $174,99964 $175,000 to $199,999369 $200,000 to $249,999355 $250,000 to $299,9991,326 $300,000 to $399,9992,492 $400,000 to $499,9994,979 $500,000 to $749,999771 $750,000 to $999,99995 $1,000,000 to $1,499,99913 $1,500,000 to $1,999,99967 $2,000,000 or moreRent paid by renters in 2022 in Aspen Hill, MD 21 Less than $10017 $100 to $14921 $150 to $1999 $200 to $249108 $250 to $29944 $500 to $54959 $550 to $59957 $600 to $64917 $650 to $69921 $700 to $74927 $750 to $799167 $800 to $89943 $900 to $999463 $1,000 to $1,2491,094 $1,250 to $1,4992,634 $1,500 to $1,999825 $2,000 to $2,499370 $2,500 to $2,999135 $3,000 to $3,499142 $3,500 or more139 No cash rent
Percentage of workers working in this county: 78.0%Number of people working at home: 6,754 (24.2% of all workers )
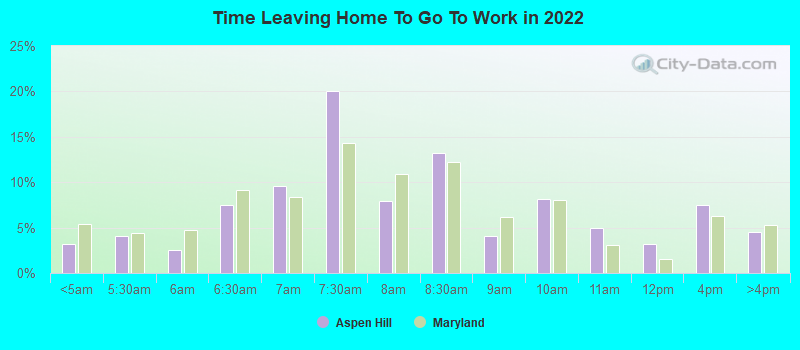
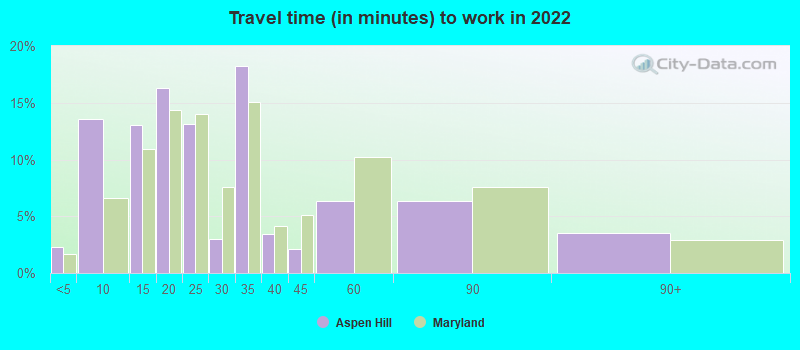
Travel time to work (commute)
Less than 5 minutes: 1445 to 9 minutes: 77810 to 14 minutes: 1,59115 to 19 minutes: 2,21420 to 24 minutes: 3,20025 to 29 minutes: 1,52630 to 34 minutes: 3,21035 to 39 minutes: 1,18440 to 44 minutes: 1,30045 to 59 minutes: 2,46360 to 89 minutes: 2,65090 or more minutes: 438
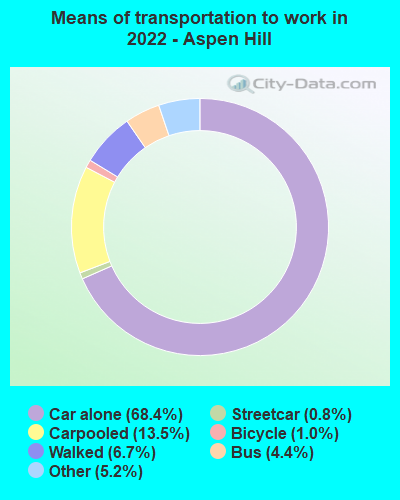
Means of transportation to work:
Drove a car alone: 2,881 (29.1%)Carpooled: 607 (6.1%)Bus : 158 (1.6%)Subway or elevated rail : 26 (0.3%)Taxi: 235 (2.4%)Bicycle: 68 (0.7%)Walked: 238 (2.4%)Worked at home: 6,754 (68.2%)
Unemployment by race in 2022
Unemployment rate for White non-Hispanic residents 3.4% Males1.6% FemalesUnemployment rate for Black residents 12.3% Males3.5% FemalesUnemployment rate for American Indian and Alaska Native residents 10.3% Males16.1% FemalesUnemployment rate for Asian residents 10.3% Males2.7% FemalesUnemployment rate for other race residents 1.2% Males13.6% FemalesUnemployment rate for two or more race residents 1.9% Males7.2% FemalesUnemployment rate for Hispanic or Latino residents 1.8% Males13.9% Females
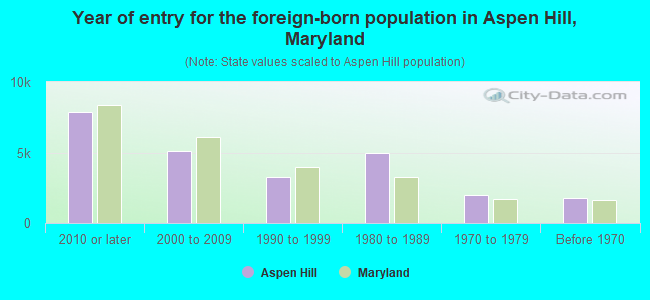
Year of entry for the foreign-born population in Aspen Hill, Maryland
7,905 2010 or later 5,129 2000 to 2009 3,279 1990 to 1999 4,968 1980 to 1989 1,968 1970 to 1979 1,801 Before 1970
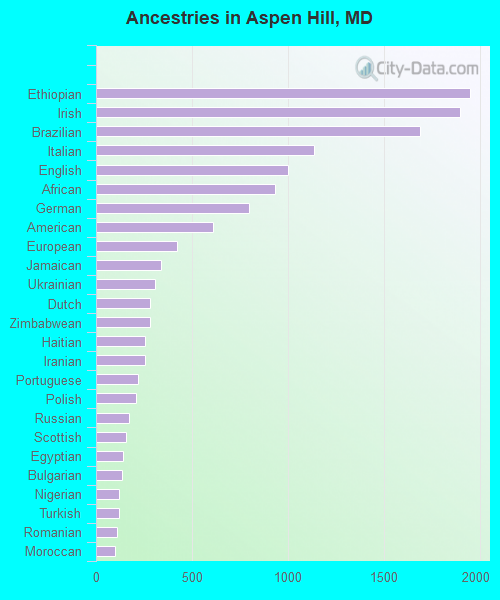
First ancestries reported:
Ethiopian: 1,950 (5.7%)
Irish: 1,896 (5.5%)
Brazilian: 1,686 (4.9%)
Italian: 1,138 (3.3%)
English: 1,001 (2.9%)
African: 934 (2.7%)
German: 796 (2.3%)
American: 609 (1.8%)
European: 421 (1.2%)
Jamaican: 340 (1.0%)
Ukrainian: 306 (0.9%)
Dutch: 283 (0.8%)
Zimbabwean: 281 (0.8%)
Haitian: 256 (0.7%)
Iranian: 255 (0.7%)
Portuguese: 220 (0.6%)
Polish: 206 (0.6%)
Russian: 171 (0.5%)
Scottish: 158 (0.5%)
Egyptian: 141 (0.4%)
Bulgarian: 134 (0.4%)
Nigerian: 122 (0.4%)
Turkish: 118 (0.3%)
Romanian: 109 (0.3%)
Moroccan: 97 (0.3%)
Greek: 96 (0.3%)
Eastern European: 76 (0.2%)
Lebanese: 75 (0.2%)
British West Indian: 70 (0.2%)
British: 67 (0.2%)
Ghanaian: 65 (0.2%)
Hungarian: 61 (0.2%)
Swedish: 59 (0.2%)
Palestinian: 58 (0.2%)
French: 57 (0.2%)
Trinidadian and Tobagonian: 49 (0.1%)
Czech: 41 (0.1%)
Finnish: 40 (0.1%)
Slovene: 38 (0.1%)
Swiss: 29 (0.08%)
Welsh: 29 (0.08%)
Barbadian: 29 (0.08%)
Arab: 27 (0.08%)
Czechoslovakian: 27 (0.08%)
Yugoslavian: 27 (0.08%)
Northern European: 26 (0.08%)
Scotch-Irish: 24 (0.07%)
Austrian: 23 (0.07%)
Belizean: 19 (0.06%)
Scandinavian: 18 (0.05%)
Celtic: 16 (0.05%)
Senegalese: 16 (0.05%)
Lithuanian: 15 (0.04%)
Cape Verdean: 15 (0.04%)
Canadian: 14 (0.04%)
Norwegian: 14 (0.04%)
Guyanese: 12 (0.03%)
Liberian: 11 (0.03%)
Ugandan: 10 (0.03%)
Croatian: 9 (0.03%)
West Indian: 8 (0.02%)
Latvian: 7 (0.02%)
Israeli: 4 (0.01%)
Most common places of birth for foreign-born residents (%): El Salvador Aspen Hill:
18.8% (3,981)Maryland:
12.0% (115,412)
Honduras Aspen Hill:
12.0% (2,550)Maryland:
2.5% (24,026)
Brazil Aspen Hill:
9.6% (2,033)Maryland:
1.2% (11,980)
Ethiopia Aspen Hill:
7.6% (1,612)Maryland:
3.2% (30,870)
Peru Aspen Hill:
3.9% (837)Maryland:
1.8% (17,161)
Korea Aspen Hill:
2.8% (602)Maryland:
3.4% (32,635)
Ecuador Aspen Hill:
2.7% (582)Maryland:
0.6% (6,211)
Guatemala Aspen Hill:
2.6% (561)Maryland:
4.4% (42,350)
China, excluding Hong Kong and Taiwan Aspen Hill:
2.2% (477)Maryland:
4.6% (44,742)
Philippines Aspen Hill:
2.1% (448)Maryland:
3.8% (36,698)
Bolivia Aspen Hill:
2.1% (445)Maryland:
0.7% (7,000)
Ghana Aspen Hill:
2.1% (440)Maryland:
1.8% (17,774)
India Aspen Hill:
2.1% (439)Maryland:
6.4% (61,725)
Sierra Leone Aspen Hill:
1.8% (387)Maryland:
1.1% (10,233)
Vietnam Aspen Hill:
1.8% (383)Maryland:
1.9% (18,716)
Colombia Aspen Hill:
1.7% (354)Maryland:
1.3% (12,898)
Venezuela Aspen Hill:
1.7% (352)Maryland:
0.5% (4,901)
Place of birth for U.S.-born residents:
This state: 16,417Other state: 15,624Northeast: 4,084Midwest: 2,160South: 8,417West: 1,035 89.8% of Aspen Hill residents lived in the same house 1 years ago.
Out of people who lived in different houses, 41.4% lived in this county.
Out of people who lived in different counties, 27.4% lived in Maryland.
Aspen Hill:
89.8%State average:
88.5%
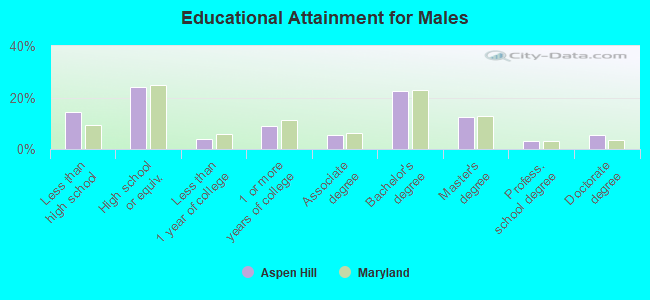
Education attainment for males 25 years and older:
No schooling: 507Nursery to 4th grade: 1935th and 6th grade: 3477th and 8th grade: 3719th grade: 13410th grade: 2811th grade: 48312th grade, no diploma: 297High school graduate (or equivalency): 3,968Less than 1 year of college: 669Some college more than 1 year, no degree: 1,468Associate degree: 911Bachelor's degree: 3,727Master's degree: 2,051Professional school degree: 487Doctorate degree: 918
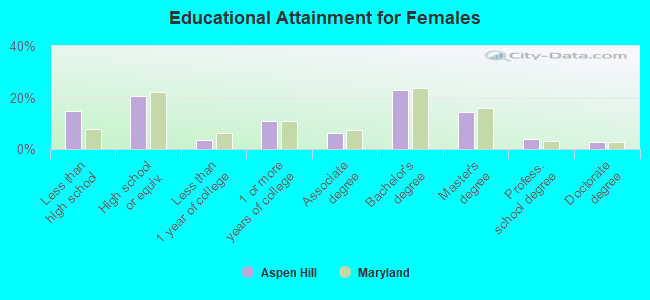
Education attainment for females 25 years and older:
No schooling: 653Nursery to 4th grade: 5905th and 6th grade: 3367th and 8th grade: 1539th grade: 31310th grade: 32111th grade: 9112th grade, no diploma: 294High school graduate (or equivalency): 3,812Less than 1 year of college: 640Some college more than 1 year, no degree: 2,011Associate degree: 1,127Bachelor's degree: 4,266Master's degree: 2,690Professional school degree: 734Doctorate degree: 502
Housing units in structures:
One, detached: 9,459One, attached: 2,176Two: 953 or 4: 2105 to 9: 1,36210 to 19: 4,07420 to 49: 23250 or more: 441Housing units lacking complete plumbing facilities in 2022: 1.2%Housing units lacking complete kitchen facilities in 2022: 1.3%House/condo owner moved in on average 15 years ago
Renter moved in on average 3 years ago
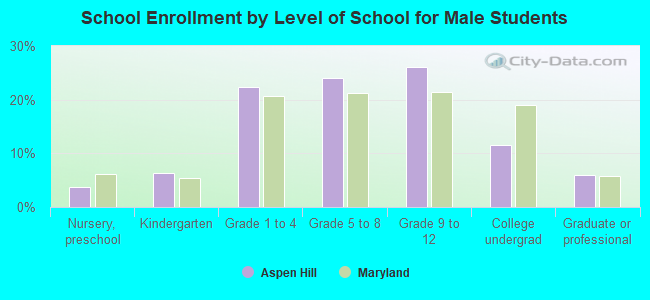
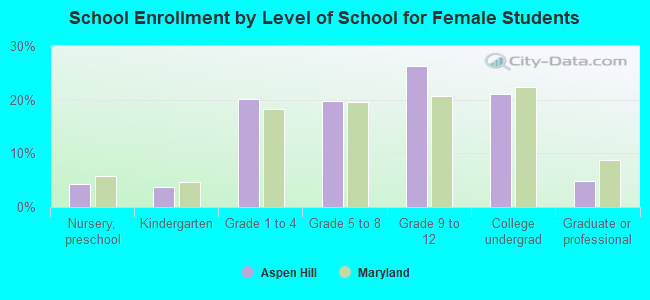
Private vs. public school enrollment:
Students in private schools in grades 1 to 8 (elementary and middle school): 1,196 Students in private schools in grades 9 to 12 (high school): 491 Students in private undergraduate colleges: 670