Atlantic City, NJ (New Jersey) Houses and Residents
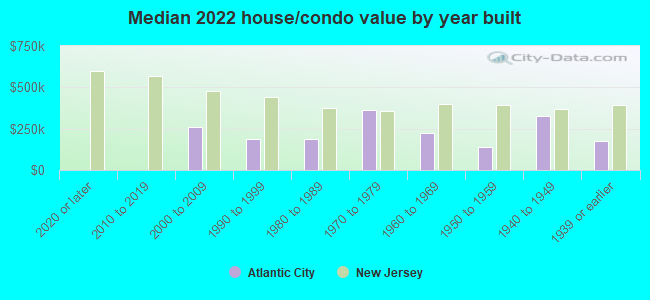
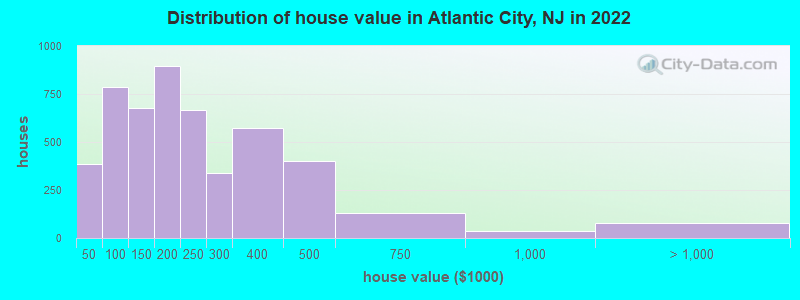
| Atlantic City: | $198,263 |
| New Jersey: | $428,900 |
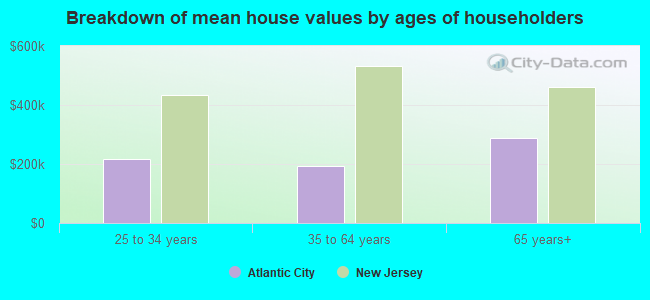
Mean price in 2022:
Detached houses: $251,007
Here: $251,007 State: $537,591 Townhouses or other attached units: $230,119
Here: $230,119 State: $381,113 In 2-unit structures: $343,188
Here: $343,188 State: $444,476 In 3-to-4-unit structures: $302,603
Here: $302,603 State: $457,463 In 5-or-more-unit structures: $129,105
Here: $129,105 State: $368,745 Mobile homes: $143,577
Here: $143,577 State: $119,788
Total population: 39,415 (All urban)
Houses: 20,698 (16,518 occupied: 5,090 owner occupied, 11,433 renter occupied)
| % of renters here: | 69% |
| State: | 35% |
Housing density: 1,824 houses/condos per square mile
Median price asked for vacant for-sale houses and condos in 2022: $144,094.
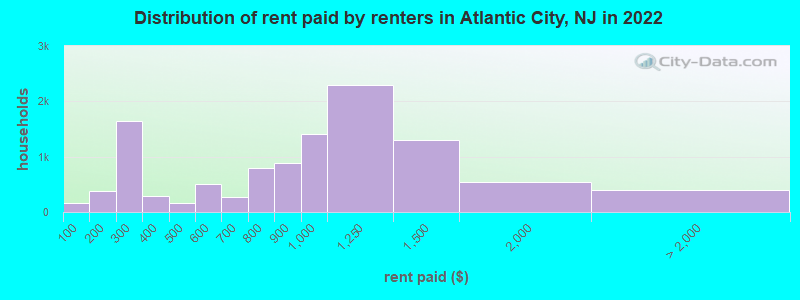
Median contract rent in 2022: $943 (lower quartile is $464, upper quartile is $1,181)
Median rent asked for vacant for-rent units in 2022: $785
Median gross rent in Atlantic City, NJ in 2022: $1,086
Housing units in Atlantic City with a mortgage: 2,477 (149 second mortgage, 0 home equity loan, 165 both second mortgage and home equity loan)
Houses without a mortgage: 88
Median household income for houses/condos with a mortgage: $60,323
Median household income for apartments without a mortgage: $51,896
Median monthly housing costs: $1,067
Compare current foreclosures in Atlantic City, NJ:
| Photo | Address | Area | Beds / Baths | Price | Details |
|---|---|---|---|---|---|

|
#1
N Connecticut Ave
Atlantic City, NJ 08401
|
1,200 sq. feet
|
1 baths 3 beds |
$139,900
|
show details |

|
#2
N Ohio Ave
Atlantic City, NJ 08401
|
3,320 sq. feet
|
4 baths 6 beds |
show details | |

|
#3
N Delancy Pl
Atlantic City, NJ 08401
|
2,214 sq. feet
|
3 baths 4 beds |
show details | |

|
#4
Drexel Ave
Atlantic City, NJ 08401
|
- sq. feet
|
- baths - beds |
$6,900
|
show details |

|
#5
N Aberdeen Pl
Atlantic City, NJ 08401
|
2,056 sq. feet
|
3 baths - beds |
show details | |

|
#6
Sunset Ave # 2
Atlantic City, NJ 08401
|
855 sq. feet
|
2 baths - beds |
show details | |

|
#7
Adriatic Ave
Atlantic City, NJ 08401
|
1,544 sq. feet
|
1 baths - beds |
show details | |

|
#8
S Bellevue Ave
Atlantic City, NJ 08401
|
1,728 sq. feet
|
- baths - beds |
show details | |

|
#9
N New York Ave
Atlantic City, NJ 08401
|
1,352 sq. feet
|
- baths - beds |
show details | |

|
#10
N Boston Ave
Atlantic City, NJ 08401
|
1,263 sq. feet
|
- baths - beds |
show details |
| Photo | Address | Area | Beds / Baths | Price | Details |
|---|---|---|---|---|---|

|
#11
S Sovereign Ave
Atlantic City, NJ 08401
|
- sq. feet
|
- baths - beds |
show details | |

|
#12
N Connecticut Ave
Atlantic City, NJ 08401
|
1,250 sq. feet
|
- baths - beds |
show details | |

|
#13
N Sovereign Ave
Atlantic City, NJ 08401
|
- sq. feet
|
- baths - beds |
show details | |

|
#14
N Sovereign Ave
Atlantic City, NJ 08401
|
1,826 sq. feet
|
- baths - beds |
show details | |

|
#15
Lighthouse Ct # F
Atlantic City, NJ 08401
|
1,588 sq. feet
|
- baths - beds |
show details | |

|
#16
N Ohio Ave
Atlantic City, NJ 08401
|
1,056 sq. feet
|
- baths - beds |
show details | |

|
#17
N Michigan Ave
Atlantic City, NJ 08401
|
1,084 sq. feet
|
- baths - beds |
show details | |

|
#18
Magellan Ave # B
Atlantic City, NJ 08401
|
- sq. feet
|
- baths - beds |
show details | |

|
#19
Madison Ave
Atlantic City, NJ 08401
|
- sq. feet
|
- baths - beds |
show details | |

|
#20
N Brighton Ave
Atlantic City, NJ 08401
|
- sq. feet
|
- baths - beds |
show details |
| Photo | Address | Area | Beds / Baths | Price | Details |
|---|---|---|---|---|---|

|
#21
Pacific Ave Apt E-207
Atlantic City, NJ 08401
|
- sq. feet
|
- baths - beds |
show details | |

|
#22
N Ohio Ave
Atlantic City, NJ 08401
|
1,851 sq. feet
|
- baths - beds |
show details | |

|
#23
Clipper Ct
Atlantic City, NJ 08401
|
- sq. feet
|
- baths - beds |
show details | |

|
#24
Boardwalk Apt 627
Atlantic City, NJ 08401
|
- sq. feet
|
- baths - beds |
show details | |

|
#25
Emerson Ave
Atlantic City, NJ 08401
|
1,814 sq. feet
|
- baths - beds |
show details | |

|
#26
Boardwalk Apt 1809
Atlantic City, NJ 08401
|
760 sq. feet
|
- baths - beds |
show details | |

|
#27
N Indiana Ave
Atlantic City, NJ 08401
|
1,728 sq. feet
|
- baths - beds |
show details | |

|
#28
Drexel Ave
Atlantic City, NJ 08401
|
- sq. feet
|
- baths - beds |
show details | |

|
#29
S Virginia Ave # 919
Atlantic City, NJ 08401
|
- sq. feet
|
- baths - beds |
show details | |

|
#30
N Richmond Ave
Atlantic City, NJ 08401
|
- sq. feet
|
- baths - beds |
show details |
| Photo | Address | Area | Beds / Baths | Price | Details |
|---|---|---|---|---|---|

|
#31
Boardwalk Tower 1, Apt 904
Atlantic City, NJ 08401
|
- sq. feet
|
- baths - beds |
show details | |

|
#32
W Riverside Dr
Atlantic City, NJ 08401
|
1,374 sq. feet
|
- baths - beds |
show details | |

|
#33
S Spray Ave
Atlantic City, NJ 08401
|
2,102 sq. feet
|
- baths - beds |
show details | |

|
#34
Caravel Ct
Atlantic City, NJ 08401
|
1,258 sq. feet
|
- baths - beds |
show details | |

|
#35
Atlantic Ave
Atlantic City, NJ 08401
|
639 sq. feet
|
- baths - beds |
show details | |

|
#36
N New York Ave Apt 504
Atlantic City, NJ 08401
|
- sq. feet
|
- baths - beds |
show details | |

|
#37
Dylan Dr
Atlantic City, NJ 08401
|
1,200 sq. feet
|
- baths - beds |
show details | |

|
#38
Ventnor Ave
Atlantic City, NJ 08401
|
704 sq. feet
|
- baths - beds |
show details | |

|
#39
Barkentine Ct
Atlantic City, NJ 08401
|
1,258 sq. feet
|
- baths - beds |
show details | |

|
#40
N Michigan Ave
Atlantic City, NJ 08401
|
742 sq. feet
|
- baths - beds |
show details |
| Photo | Address | Area | Beds / Baths | Price | Details |
|---|---|---|---|---|---|

|
#41
N Montpelier Ave
Atlantic City, NJ 08401
|
- sq. feet
|
- baths - beds |
show details | |

|
#42
Monroe Ave
Atlantic City, NJ 08401
|
1,062 sq. feet
|
- baths - beds |
show details | |

|
#43
S Kingston Ave # 2
Atlantic City, NJ 08401
|
- sq. feet
|
- baths - beds |
show details | |

|
#44
Winchester Ave
Atlantic City, NJ 08401
|
1,260 sq. feet
|
- baths - beds |
show details | |

|
#45
Windjammer Ct
Atlantic City, NJ 08401
|
- sq. feet
|
- baths - beds |
show details | |

|
#46
N New Hampshire Ave Apt 1309
Atlantic City, NJ 08401
|
- sq. feet
|
- baths - beds |
show details | |

|
#47
N Indiana Ave
Atlantic City, NJ 08401
|
1,930 sq. feet
|
- baths - beds |
show details | |

|
#48
N New York Ave # B
Atlantic City, NJ 08401
|
- sq. feet
|
- baths - beds |
show details | |

|
#49
Pacific Ave Apt F8
Atlantic City, NJ 08401
|
- sq. feet
|
- baths - beds |
show details | |

|
Check over 1 million property listings on Foreclosure.com!
|
browse all offers | |||


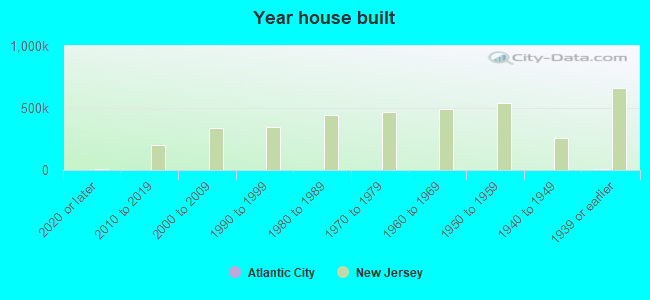
Median year apartment built: 1964
Household type by relationship:
Households: 38,669- Male householders: 7,711 (3,222 living alone), Female householders: 8,839 (3,383 living alone)
4,199 spouses (4,180 opposite-sex spouses), 1,636 unmarried partners, (1,529 opposite-sex unmarried partners), 11,505 children (11,021 natural, 68 adopted, 414 stepchildren), 554 grandchildren, 508 brothers or sisters, 426 parents, 23 foster children, 939 other relatives, 1,795 non-relatives
- In group quarters: 529
Size of family households: 3,551 2-persons, 2,474 3-persons, 1,643 4-persons, 421 5-persons, 378 6-persons, 349 7-or-more-persons.
Size of nonfamily households: 6,401 1-person, 1,055 2-persons, 86 3-persons, 4 4-persons, 48 6-persons.
3,616 married couples with children.
4,661 single-parent households (1,163 men, 3,498 women).
51.0% of residents of Atlantic City speak English at home.
29.8% of residents speak Spanish at home (41% speak English very well, 20% speak English well, 24% speak English not well, 15% don't speak English at all).
8.6% of residents speak other Indo-European language at home (44% speak English very well, 47% speak English well, 7% speak English not well, 2% don't speak English at all).
8.6% of residents speak Asian or Pacific Island language at home (37% speak English very well, 30% speak English well, 30% speak English not well, 4% don't speak English at all).
1.6% of residents speak other language at home (29% speak English very well, 65% speak English well, 7% speak English not well).
Foreign born population: 10,934 (28.3%)
(44.4% of them are naturalized citizens)
| Here: | 5.6 |
| State: | 6.8 |
| Here: | 3.7 |
| State: | 3.9 |
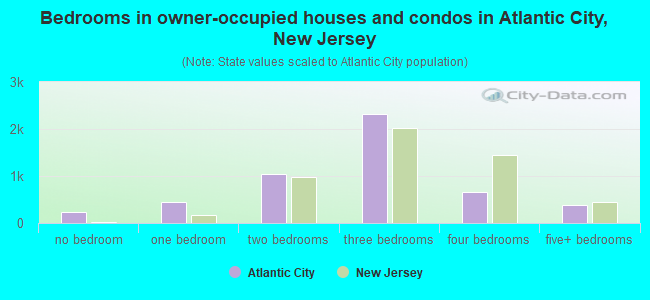
- Bedrooms in owner-occupied houses and condos in Atlantic City, New Jersey
- 233no bedroom
- 4511 bedroom
- 1,0382 bedrooms
- 2,3263 bedrooms
- 6614 bedrooms
- 3815+ bedrooms
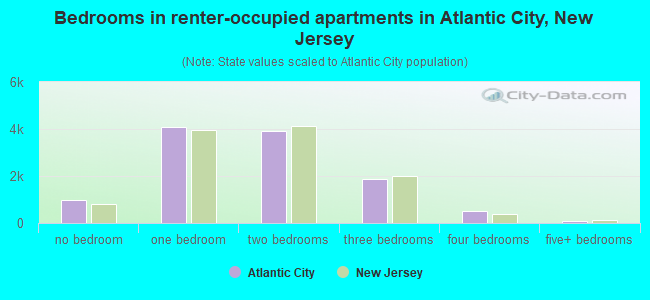
- Bedrooms in renter-occupied apartments in Atlantic City, New Jersey
- 999no bedroom
- 4,0861 bedroom
- 3,9142 bedrooms
- 1,8593 bedrooms
- 5114 bedrooms
- 655+ bedrooms
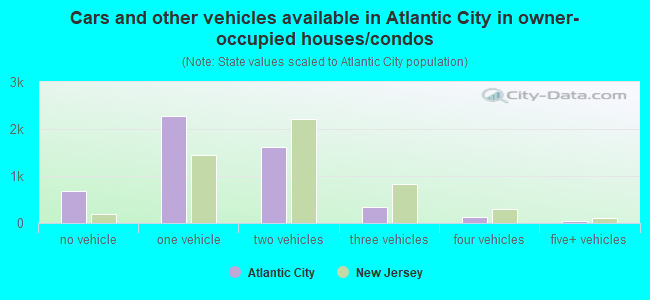
- Cars and other vehicles available in Atlantic City in owner-occupied houses/condos
- 687no vehicle
- 2,2781 vehicle
- 1,6192 vehicles
- 3443 vehicles
- 1294 vehicles
- 335+ vehicles
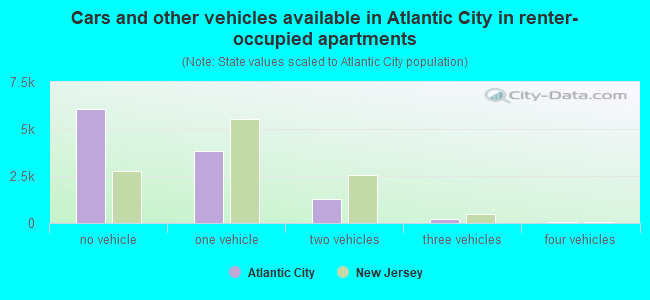
- Cars and other vehicles available in Atlantic City in renter-occupied apartments
- 6,077no vehicle
- 3,8351 vehicle
- 1,2722 vehicles
- 2203 vehicles
- 304 vehicles
- 05+ vehicles
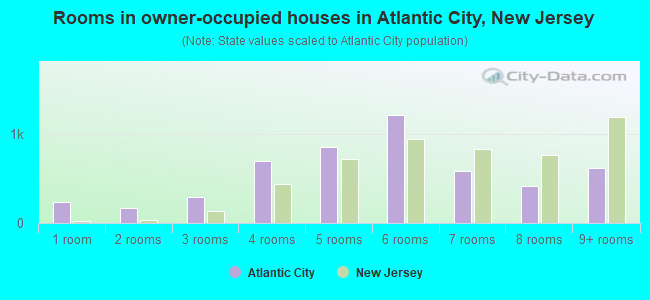
- Rooms in owner-occupied houses in Atlantic City, New Jersey
- 2331 room
- 1702 rooms
- 2903 rooms
- 6984 rooms
- 8565 rooms
- 1,2206 rooms
- 5897 rooms
- 4158 rooms
- 6219+ rooms
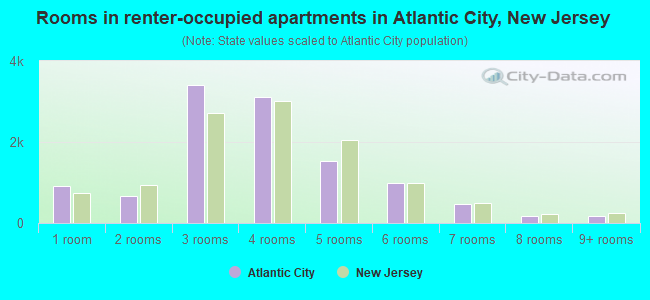
- Rooms in renter-occupied apartments in Atlantic City, New Jersey
- 9061 room
- 6682 rooms
- 3,4023 rooms
- 3,1004 rooms
- 1,5385 rooms
- 9986 rooms
- 4667 rooms
- 1728 rooms
- 1859+ rooms
Atlantic City, NJ household income distribution

- 1,493Less than $10,000
- 2,792$10,000 to $19,999
- 2,078$20,000 to $29,999
- 2,323$30,000 to $39,999
- 1,182$40,000 to $49,999
- 1,229$50,000 to $59,999
- 876$60,000 to $74,999
- 1,439$75,000 to $99,999
- 963$100,000 to $124,999
- 433$125,000 to $149,999
- 498$150,000 to $199,999
- 617$200,000 or more

Home value of owner - occupied houses in 2022 in Atlantic City, NJ
-
- 76Less than $10,000
- 38$15,000 to $19,999
- 33$20,000 to $24,999
- 43$25,000 to $29,999
- 44$30,000 to $34,999
- 78$35,000 to $39,999
- 70$40,000 to $49,999
- 111$50,000 to $59,999
- 152$60,000 to $69,999
- 181$70,000 to $79,999
- 179$80,000 to $89,999
- 92$90,000 to $99,999
- 343$100,000 to $124,999
- 332$125,000 to $149,999
- 508$150,000 to $174,999
- 390$175,000 to $199,999
- 668$200,000 to $249,999
- 338$250,000 to $299,999
- 575$300,000 to $399,999
- 400$400,000 to $499,999
- 131$500,000 to $749,999
- 36$750,000 to $999,999
- 23$1,000,000 to $1,499,999
- 52$1,500,000 to $1,999,999
Rent paid by renters in 2022 in Atlantic City, NJ
-
- 161Less than $100
- 278$100 to $149
- 105$150 to $199
- 1,168$200 to $249
- 470$250 to $299
- 115$300 to $349
- 181$350 to $399
- 82$400 to $449
- 73$450 to $499
- 379$500 to $549
- 134$550 to $599
- 85$600 to $649
- 180$650 to $699
- 392$700 to $749
- 394$750 to $799
- 880$800 to $899
- 1,415$900 to $999
- 2,297$1,000 to $1,249
- 1,293$1,250 to $1,499
- 551$1,500 to $1,999
- 220$2,000 to $2,499
- 51$2,500 to $2,999
- 19$3,500 or more
- 106No cash rent
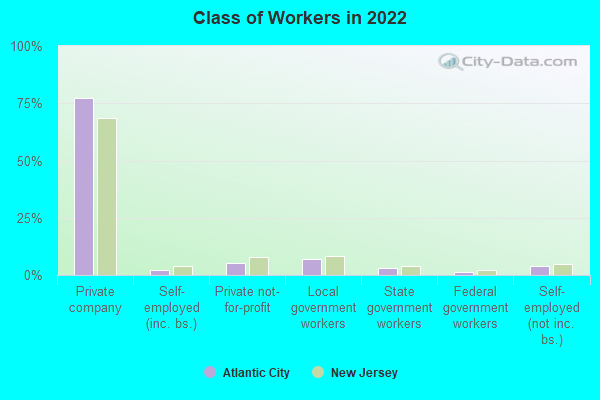
Percentage of workers working in this county: 88.6%
Number of people working at home: 1,002 (6.6% of all workers)

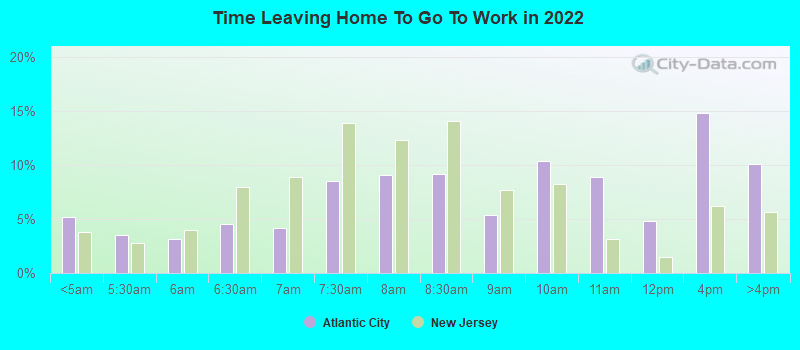
Travel time to work (commute)
- Less than 5 minutes: 185
- 5 to 9 minutes: 1,444
- 10 to 14 minutes: 4,032
- 15 to 19 minutes: 2,423
- 20 to 24 minutes: 1,913
- 25 to 29 minutes: 652
- 30 to 34 minutes: 1,179
- 35 to 39 minutes: 95
- 40 to 44 minutes: 844
- 45 to 59 minutes: 541
- 60 to 89 minutes: 658
- 90 or more minutes: 305
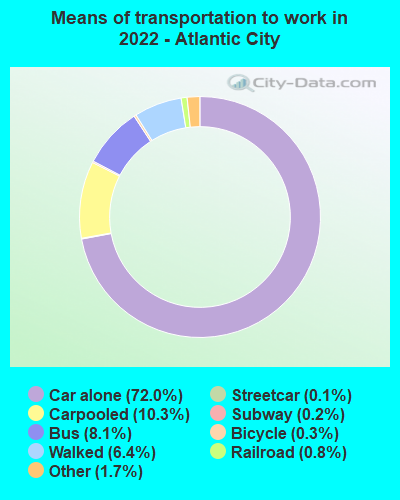
Means of transportation to work:
- Drove a car alone: 22,952 (66.7%)
- Carpooled: 3,728 (10.8%)
- Bus: 2,340 (6.8%)
- Subway or elevated rail: 29 (0.1%)
- Long-distance train or commuter rail: 58 (0.2%)
- Light rail, streetcar or trolley: 144 (0.4%)
- Taxi: 626 (1.8%)
- Bicycle: 106 (0.3%)
- Walked: 2,271 (6.6%)
- Worked at home: 1,002 (2.9%)
- Unemployment by race in 2022
- Unemployment rate for White non-Hispanic residents
- 2.6%Males
- 3.3%Females
- Unemployment rate for Black residents
- 18.7%Males
- 20.3%Females
- Unemployment rate for American Indian and Alaska Native residents
- 7.7%Males
- 21.0%Females
- Unemployment rate for Asian residents
- 13.0%Males
- 8.5%Females
- Unemployment rate for other race residents
- 7.0%Males
- 17.6%Females
- Unemployment rate for two or more race residents
- 6.5%Males
- 9.6%Females
- Unemployment rate for Hispanic or Latino residents
- 6.3%Males
- 14.6%Females
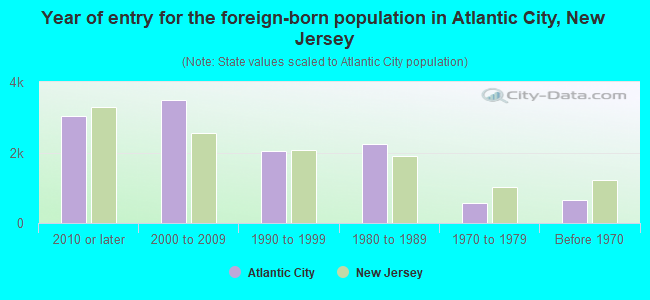
- Year of entry for the foreign-born population in Atlantic City, New Jersey
- 3,0442010 or later
- 3,5012000 to 2009
- 2,0331990 to 1999
- 2,2371980 to 1989
- 5751970 to 1979
- 653Before 1970

First ancestries reported:
- Italian: 843 (3.0%)
- Irish: 548 (2.0%)
- American: 346 (1.2%)
- Haitian: 281 (1.0%)
- Polish: 274 (1.0%)
- German: 258 (0.9%)
- Jamaican: 200 (0.7%)
- African: 124 (0.4%)
- English: 121 (0.4%)
- Russian: 107 (0.4%)
- Pennsylvania German: 96 (0.3%)
- Trinidadian and Tobagonian: 86 (0.3%)
- European: 76 (0.3%)
- Egyptian: 64 (0.2%)
- Arab: 61 (0.2%)
- Moroccan: 59 (0.2%)
- Jordanian: 56 (0.2%)
- Liberian: 50 (0.2%)
- Iranian: 41 (0.1%)
- Romanian: 38 (0.1%)
- Greek: 34 (0.1%)
- Afghan: 31 (0.1%)
- Dutch: 29 (0.1%)
- Barbadian: 26 (0.09%)
- Slovene: 24 (0.09%)
- Palestinian: 19 (0.07%)
- Ukrainian: 19 (0.07%)
- French: 16 (0.06%)
- Brazilian: 14 (0.05%)
- Nigerian: 9 (0.03%)
- Turkish: 8 (0.03%)
- Finnish: 8 (0.03%)
- Hungarian: 5 (0.02%)
- West Indian: 4 (0.01%)
Most common places of birth for foreign-born residents (%):
| Atlantic City: | 20.0% (2,408) |
| New Jersey: | 4.8% (102,527) |
| Atlantic City: | 14.4% (1,726) |
| New Jersey: | 9.7% (209,055) |
| Atlantic City: | 12.3% (1,480) |
| New Jersey: | 0.7% (14,405) |
| Atlantic City: | 8.1% (971) |
| New Jersey: | 0.7% (15,644) |
| Atlantic City: | 6.2% (749) |
| New Jersey: | 1.7% (37,335) |
| Atlantic City: | 4.6% (552) |
| New Jersey: | 4.2% (90,817) |
| Atlantic City: | 4.1% (498) |
| New Jersey: | 3.7% (78,969) |
| Atlantic City: | 3.8% (459) |
| New Jersey: | 4.0% (85,934) |
| Atlantic City: | 3.1% (371) |
| New Jersey: | 1.3% (27,580) |
| Atlantic City: | 2.9% (347) |
| New Jersey: | 12.8% (274,609) |
| Atlantic City: | 2.0% (242) |
| New Jersey: | 2.3% (49,491) |
| Atlantic City: | 1.7% (204) |
| New Jersey: | 2.3% (48,885) |
Place of birth for U.S.-born residents:
- This state: 19,573
- Other state: 6,140
- Northeast: 3,168
- Midwest: 463
- South: 2,279
- West: 406
86.6% of Atlantic City residents lived in the same house 1 years ago.
Out of people who lived in different houses, 45.1% lived in this county.
Out of people who lived in different counties, 34.9% lived in New Jersey.
| Atlantic City: | 86.6% |
| State average: | 90.4% |
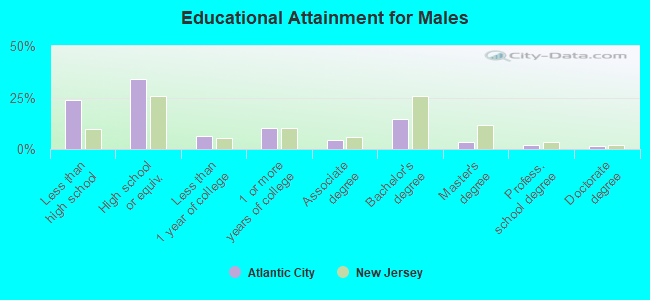
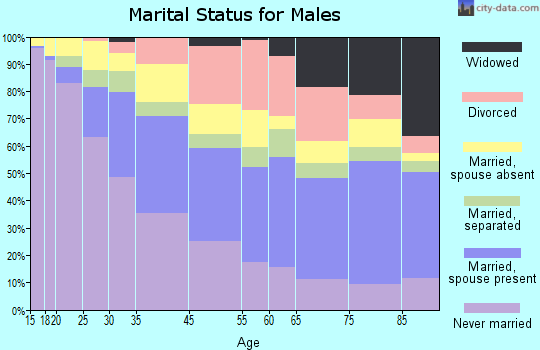
Education attainment for males 25 years and older:
- No schooling: 618
- Nursery to 4th grade: 213
- 5th and 6th grade: 250
- 7th and 8th grade: 162
- 9th grade: 141
- 10th grade: 311
- 11th grade: 535
- 12th grade, no diploma: 631
- High school graduate (or equivalency): 4,080
- Less than 1 year of college: 749
- Some college more than 1 year, no degree: 1,229
- Associate degree: 555
- Bachelor's degree: 1,747
- Master's degree: 416
- Professional school degree: 231
- Doctorate degree: 171
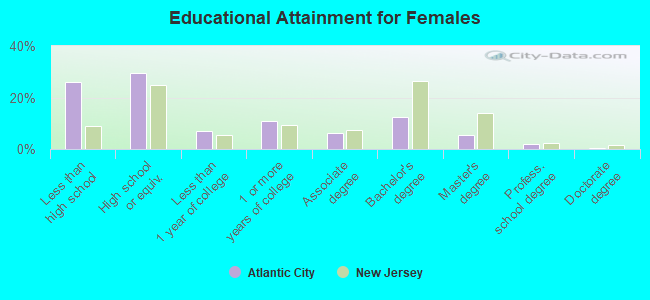
Education attainment for females 25 years and older:
- No schooling: 1,103
- Nursery to 4th grade: 353
- 5th and 6th grade: 503
- 7th and 8th grade: 304
- 9th grade: 184
- 10th grade: 139
- 11th grade: 474
- 12th grade, no diploma: 334
- High school graduate (or equivalency): 3,817
- Less than 1 year of college: 893
- Some college more than 1 year, no degree: 1,390
- Associate degree: 827
- Bachelor's degree: 1,621
- Master's degree: 732
- Professional school degree: 262
- Doctorate degree: 60
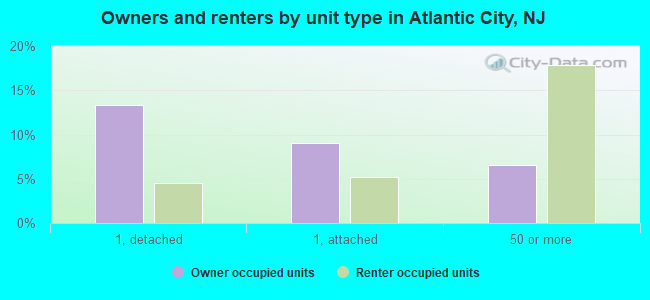
Housing units in structures:
- One, detached: 3,526
- One, attached: 3,640
- Two: 1,968
- 3 or 4: 1,332
- 5 to 9: 1,918
- 10 to 19: 1,555
- 20 to 49: 1,104
- 50 or more: 5,509
- Mobile homes: 136
- Boats, RVs, vans, etc.: 7
Housing units lacking complete kitchen facilities in 2022: 3.4%
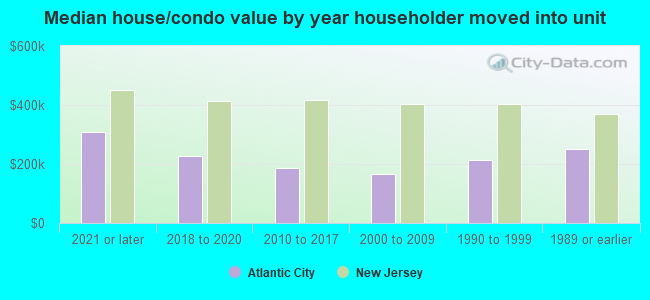
House/condo owner moved in on average 16 years ago
Renter moved in on average 6 years ago
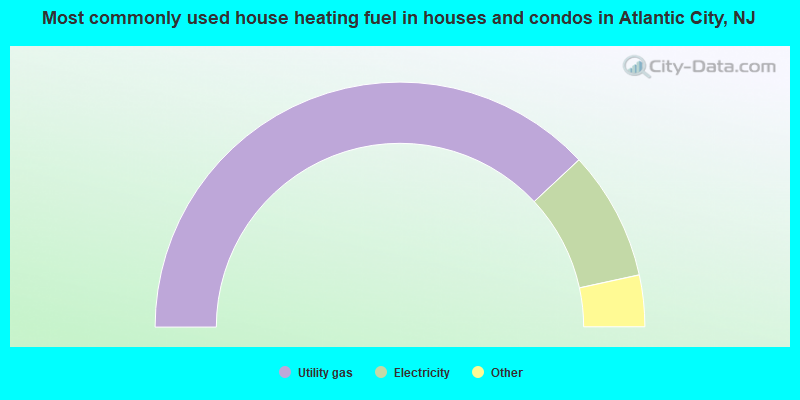
- 76.1%Utility gas
- 17.1%Electricity
- 3.7%Fuel oil, kerosene, etc.
- 1.3%Bottled, tank, or LP gas
- 1.2%No fuel used
- 0.4%Other fuel
- 0.1%Solar energy
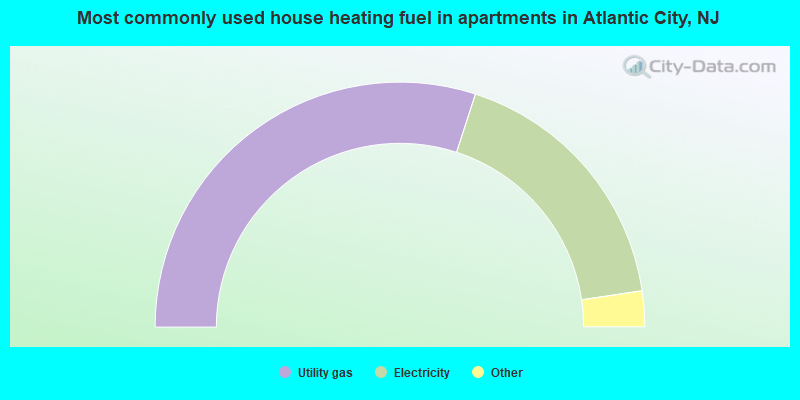
- 60.0%Utility gas
- 35.3%Electricity
- 2.2%No fuel used
- 1.1%Fuel oil, kerosene, etc.
- 0.9%Bottled, tank, or LP gas
- 0.3%Other fuel
- 0.1%Solar energy
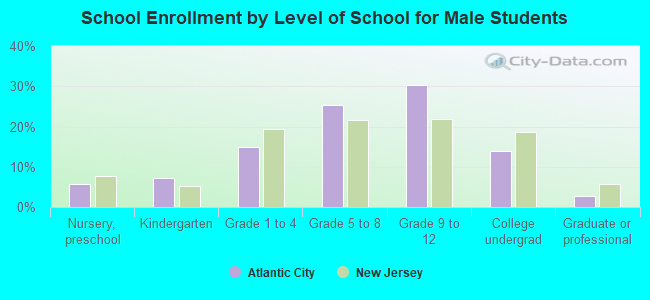
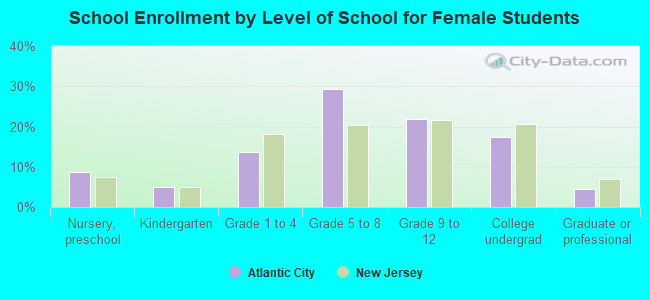
Private vs. public school enrollment:
| Here: | 1.6% |
| New Jersey: | 12.3% |
| Here: | 7.0% |
| New Jersey: | 13.1% |
| Here: | 27.2% |
| New Jersey: | 33.2% |