Attleboro, MA (Massachusetts) Houses and Residents
Estimated median house or condo value in 2022: $425,155 (it was $147,200 in 2000 )
Attleboro:
$425,155Massachusetts:
$534,700
Lower value quartile - upper value quartile: $321,970 - $554,016Mean price in 2022: Detached houses: $447,019 Here:
$447,019State:
$651,570
Townhouses or other attached units: $345,555 Here:
$345,555State:
$617,749
In 2-unit structures: $351,217 Here:
$351,217State:
$594,808
In 3-to-4-unit structures: $533,486 Here:
$533,486State:
$601,912
In 5-or-more-unit structures: $226,987 Here:
$226,987State:
$555,768
Mobile homes: $151,947 Here:
$151,947State:
$170,209
Total population: 43,970 (Urban population: 41,880, Rural population: 188 (all nonfarm) )
Houses: 19,606 (18,142 occupied: 12,044 owner occupied, 6,230 renter occupied )
% of renters here:
34%State:
38%
Housing density: 713 houses/condos per square mile
Median price asked for vacant for-sale houses and condos in 2022: $591,565.
Median contract rent in 2022: $1,213 (lower quartile is $900, upper quartile is $1,649)
Median rent asked for vacant for-rent units in 2022: $2,060
Median gross rent in Attleboro, MA in 2022: $1,369
Housing units in Attleboro with a mortgage: 8,238 (972 second mortgage, 40 home equity loan, 739 both second mortgage and home equity loan )Houses without a mortgage: 432
Median household income for houses/condos with a mortgage: $138,264
Median household income for apartments without a mortgage: $85,821
Median monthly housing costs: $1,633
Data:
Median house or condo value ($)
Median house or condo value ($ change since 2000)
Median house or condo value ($) - White
Median house or condo value ($) - Black or African American
Median house or condo value ($) - Asian
Median house or condo value ($) - Hispanic or Latino
Median house or condo value ($) - American Indian and Alaska Native
Median house or condo value ($) - Multirace
Median house or condo value ($) - Other Race
Median price asked for mobile homes ($)
Household density (households per square mile)
Mean house or condo value by units in structure - 1, detached ($)
Mean house or condo value by units in structure - 1, attached ($)
Mean house or condo value by units in structure - 2 ($)
Mean house or condo value by units in structure by units in structure - 3 or 4 ($)
Mean house or condo value by units in structure - 5 or more ($)
Mean house or condo value by units in structure - Boat, RV, van, etc. ($)
Mean house or condo value by units in structure - Mobile home ($)
Median contract rent ($)
Median contract rent - Lower quartile ($)
Median contract rent - Upper quartile ($)
Median gross rent ($)
Urban houses (%)
Rural houses (%)
Houses occupied (%)
Houses occupied (% change since 2000)
Houses owner occupied (%)
Houses owner occupied (% change since 2000)
Houses renter occupied (%)
Houses renter occupied (% change since 2000)
Vacant housing units - For rent (%)
Vacant housing units - For rent (% change since 2000)
Vacant housing units - For sale only (%)
Vacant housing units - For sale only (% change since 2000)
Vacant housing units - Rented or sold, not occupied (%)
Vacant housing units - Rented or sold, not occupied (% change since 2000)
Vacant housing units - For seasonal, recreational, or occasional use (%)
Vacant housing units - For seasonal, recreational, or occasional use (% change since 2000)
Vacant housing units - For migrant workers (%)
Vacant housing units - For migrant workers (% change since 2000)
Vacant housing units - Other vacant (%)
Vacant housing units - Other vacant (% change since 2000)
Median monthly housing costs ($)
Median household income for houses/condos with a mortgage ($)
Median household income for houses/condos without a mortgage ($)
Median household income ($)
Median household income ($) - White
Median household income ($) - Black or African American
Median household income ($) - Asian
Median household income ($) - Hispanic or Latino
Median household income ($) - American Indian and Alaska Native
Median household income ($) - Multirace
Median household income ($) - Other Race
Mortgage status - with mortgage (%)
Mortgage status - with second mortgage (%)
Mortgage status - with home equity loan (%)
Mortgage status - with both second mortgage and home equity loan (%)
Mortgage status - without a mortgage (%)
Median year house/condo built
Median year apartment built
Household type by relationship - Male householder living alone (%)
Household type by relationship - Male householder not living alone (%)
Household type by relationship - Female householder living alone (%)
Household type by relationship - Female householder not living alone (%)
Household type by relationship - Opposite-Sex spouse (%)
Household type by relationship - Same-Sex spouse (%)
Household type by relationship - Opposite-Sex unmarried partner (%)
Household type by relationship - Same-Sex unmarried partner (%)
Household type by relationship - In group quarters (%)
Size of family households - 2-person household (%)
Size of family households - 3-person household (%)
Size of family households - 4-person household (%)
Size of family households - 5-person household (%)
Size of family households - 6-person household (%)
Size of family households - 7-or-more-person household (%)
Size of nonfamily households - 1-person household (%)
Size of nonfamily households - 2-person household (%)
Size of nonfamily households - 3-person household (%)
Size of nonfamily households - 4-person household (%)
Size of nonfamily households - 5-person household (%)
Size of nonfamily households - 6-person household (%)
Size of nonfamily households - 7-or-moreperson household (%)
Year house built - Built 2010 or later (%)
Year house built - Built 2000 to 2009 (%)
Year house built - Built 1990 to 1999 (%)
Year house built - Built 1980 to 1989 (%)
Year house built - Built 1970 to 1979 (%)
Year house built - Built 1960 to 1969 (%)
Year house built - Built 1950 to 1959 (%)
Year house built - Built 1940 to 1949 (%)
Year house built - Built 1939 or earlier (%)
Median number of rooms in houses and condos
Median number of rooms in apartments
Median number of bedrooms in owner occupied houses
Mean number of bedrooms in owner occupied houses
Median number of bedrooms in renter occupied houses
Mean number of bedrooms in renter occupied houses
Median number of vehichles in owner occupied houses
Mean number of vehichles in owner occupied houses
Median number of vehichles in renter occupied houses
Mean number of vehichles in renter occupied houses
Rooms in owner-occupied houses - 1 room (%)
Rooms in owner-occupied houses - 2 rooms (%)
Rooms in owner-occupied houses - 3 rooms (%)
Rooms in owner-occupied houses - 4 rooms (%)
Rooms in owner-occupied houses - 5 rooms (%)
Rooms in owner-occupied houses - 6 rooms (%)
Rooms in owner-occupied houses - 7 rooms (%)
Rooms in owner-occupied houses - 8 rooms (%)
Rooms in owner-occupied houses - 9+ rooms (%)
Rooms in renter-occupied houses - 1 room (%)
Rooms in renter-occupied houses - 2 rooms (%)
Rooms in renter-occupied houses - 3 rooms (%)
Rooms in renter-occupied houses - 4 rooms (%)
Rooms in renter-occupied houses - 5 rooms (%)
Rooms in renter-occupied houses - 6 rooms (%)
Rooms in renter-occupied houses - 7 rooms (%)
Rooms in renter-occupied houses - 8 rooms (%)
Rooms in renter-occupied houses - 9+ rooms (%)
Bedrooms in owner-occupied houses - no bedrooms (%)
Bedrooms in owner-occupied houses - 1 bedroom (%)
Bedrooms in owner-occupied houses - 2 bedrooms (%)
Bedrooms in owner-occupied houses - 3 bedrooms (%)
Bedrooms in owner-occupied houses - 4 bedrooms (%)
Bedrooms in owner-occupied houses - 5+ bedrooms (%)
Bedrooms in renter-occupied houses - no bedrooms (%)
Bedrooms in renter-occupied houses - 1 bedroom (%)
Bedrooms in renter-occupied houses - 2 bedrooms (%)
Bedrooms in renter-occupied houses - 3 bedrooms (%)
Bedrooms in renter-occupied houses - 4 bedrooms (%)
Bedrooms in renter-occupied houses - 5+ bedrooms (%)
Vehicles available in owner-occupied houses - no vehicle available (%)
Vehicles available in owner-occupied houses - 1 vehicle available(%)
Vehicles available in owner-occupied houses - 2 Vehicles available (%)
Vehicles available in owner-occupied houses - 3 Vehicles available (%)
Vehicles available in owner-occupied houses - 4 Vehicles available (%)
Vehicles available in owner-occupied houses - 5+ Vehicles available (%)
Vehicles available in renter-occupied houses - no vehicle available (%)
Vehicles available in renter-occupied houses - 1 vehicle available (%)
Vehicles available in renter-occupied houses - 2 Vehicles available (%)
Vehicles available in renter-occupied houses - 3 Vehicles available (%)
Vehicles available in renter-occupied houses - 4 Vehicles available (%)
Vehicles available in renter-occupied houses - 5+ Vehicles available (%)
Housing units in structures - 1, detached (%)
Housing units in structures - 1, attached (%)
Housing units in structures - 2 (%)
Housing units in structures - 3 or 4 (%)
Housing units in structures - 5 to 9 (%)
Housing units in structures - 10 to 19 (%)
Housing units in structures - 20 to 49 (%)
Housing units in structures - 50 or more (%)
Housing units in structures - Mobile home (%)
Housing units in structures - Boat, RV, van, etc. (%)
Housing units in structures - Owners - 1, detached (%)
Housing units in structures - Owners - 1, attached (%)
Housing units in structures - Owners - 2 (%)
Housing units in structures - Owners - 3 or 4 (%)
Housing units in structures - Owners - 5 to 9 (%)
Housing units in structures - Owners - 10 to 19 (%)
Housing units in structures - Owners - 20 to 49 (%)
Housing units in structures - Owners - 50 or more (%)
Housing units in structures - Owners - Mobile home (%)
Housing units in structures - Owners - Boat, RV, van, etc. (%)
Housing units in structures - Renters - 1, detached (%)
Housing units in structures - Renters - 1, attached (%)
Housing units in structures - Renters - 2 (%)
Housing units in structures - Renters - 3 or 4 (%)
Housing units in structures - Renters - 5 to 9 (%)
Housing units in structures - Renters - 10 to 19 (%)
Housing units in structures - Renters - 20 to 49 (%)
Housing units in structures - Renters - 50 or more (%)
Housing units in structures - Renters - Mobile home (%)
Housing units in structures - Renters - Boat, RV, van, etc. (%)
House/condo owner moved in on average (years ago)
Renter moved in on average (years ago)
Year householder moved into unit - Moved in 1999 to March 2000 (%)
Year householder moved into unit - Moved in 1999 to March 2000 (%) - White
Year householder moved into unit - Moved in 1999 to March 2000 (%) - Black or African American
Year householder moved into unit - Moved in 1999 to March 2000 (%) - Asian
Year householder moved into unit - Moved in 1999 to March 2000 (%) - Hispanic or Latino
Year householder moved into unit - Moved in 1999 to March 2000 (%) - American Indian and Alaska Native
Year householder moved into unit - Moved in 1999 to March 2000 (%) - Multirace
Year householder moved into unit - Moved in 1999 to March 2000 (%) - Other Race
Year householder moved into unit - Moved in 1995 to 1998 (%)
Year householder moved into unit - Moved in 1995 to 1998 (%) - White
Year householder moved into unit - Moved in 1995 to 1998 (%) - Black or African American
Year householder moved into unit - Moved in 1995 to 1998 (%) - Asian
Year householder moved into unit - Moved in 1995 to 1998 (%) - Hispanic or Latino
Year householder moved into unit - Moved in 1995 to 1998 (%) - American Indian and Alaska Native
Year householder moved into unit - Moved in 1995 to 1998 (%) - Multirace
Year householder moved into unit - Moved in 1995 to 1998 (%) - Other Race
Year householder moved into unit - Moved in 1990 to 1994 (%)
Year householder moved into unit - Moved in 1990 to 1994 (%) - White
Year householder moved into unit - Moved in 1990 to 1994 (%) - Black or African American
Year householder moved into unit - Moved in 1990 to 1994 (%) - Asian
Year householder moved into unit - Moved in 1990 to 1994 (%) - Hispanic or Latino
Year householder moved into unit - Moved in 1990 to 1994 (%) - American Indian and Alaska Native
Year householder moved into unit - Moved in 1990 to 1994 (%) - Multirace
Year householder moved into unit - Moved in 1990 to 1994 (%) - Other Race
Year householder moved into unit - Moved in 1980 to 1989 (%)
Year householder moved into unit - Moved in 1980 to 1989 (%) - White
Year householder moved into unit - Moved in 1980 to 1989 (%) - Black or African American
Year householder moved into unit - Moved in 1980 to 1989 (%) - Asian
Year householder moved into unit - Moved in 1980 to 1989 (%) - Hispanic or Latino
Year householder moved into unit - Moved in 1980 to 1989 (%) - American Indian and Alaska Native
Year householder moved into unit - Moved in 1980 to 1989 (%) - Multirace
Year householder moved into unit - Moved in 1980 to 1989 (%) - Other Race
Year householder moved into unit - Moved in 1970 to 1979 (%)
Year householder moved into unit - Moved in 1970 to 1979 (%) - White
Year householder moved into unit - Moved in 1970 to 1979 (%) - Black or African American
Year householder moved into unit - Moved in 1970 to 1979 (%) - Asian
Year householder moved into unit - Moved in 1970 to 1979 (%) - Hispanic or Latino
Year householder moved into unit - Moved in 1970 to 1979 (%) - American Indian and Alaska Native
Year householder moved into unit - Moved in 1970 to 1979 (%) - Multirace
Year householder moved into unit - Moved in 1970 to 1979 (%) - Other Race
Year householder moved into unit - Moved in 1969 or earlier (%)
Year householder moved into unit - Moved in 1969 or earlier (%) - White
Year householder moved into unit - Moved in 1969 or earlier (%) - Black or African American
Year householder moved into unit - Moved in 1969 or earlier (%) - Asian
Year householder moved into unit - Moved in 1969 or earlier (%) - Hispanic or Latino
Year householder moved into unit - Moved in 1969 or earlier (%) - American Indian and Alaska Native
Year householder moved into unit - Moved in 1969 or earlier (%) - Multirace
Year householder moved into unit - Moved in 1969 or earlier (%) - Other Race
Housing units lacking complete plumbing facilities (%)
Housing units lacking complete kitchen facilities (%)
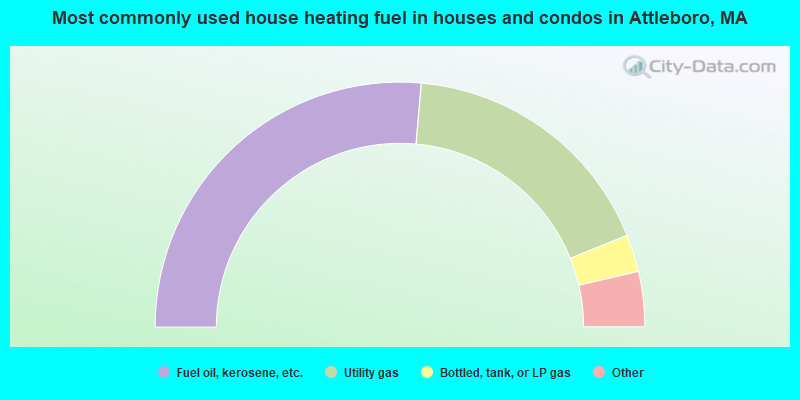
House heating fuel used in houses and condos - Utility gas (%)
House heating fuel used in houses and condos - Bottled, tank, or LP gas (%)
House heating fuel used in houses and condos - Electricity (%)
House heating fuel used in houses and condos - Fuel oil, kerosene, etc. (%)
House heating fuel used in houses and condos - Coal or coke (%)
House heating fuel used in houses and condos - Wood (%)
House heating fuel used in houses and condos - Solar energy (%)
House heating fuel used in houses and condos - Other fuel (%)
House heating fuel used in houses and condos - No fuel used (%)
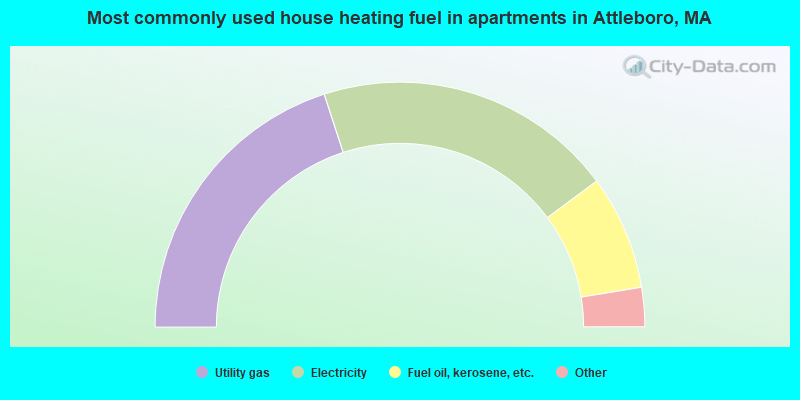
House heating fuel used in apartments - Utility gas (%)
House heating fuel used in apartments - Bottled, tank, or LP gas (%)
House heating fuel used in apartments - Electricity (%)
House heating fuel used in apartments - Fuel oil, kerosene, etc. (%)
House heating fuel used in apartments - Coal or coke (%)
House heating fuel used in apartments - Wood (%)
House heating fuel used in apartments - Solar energy (%)
House heating fuel used in apartments - Other fuel (%)
House heating fuel used in apartments - No fuel used (%)
Latest news about housing in Attleboro, MA collected exclusively by city-data.com from local newspapers, TV, and radio stations
Median year house/condo built: 1972Median year apartment built: 1973Household type by relationship:
Households: 46,654
Male householders: 8,139 (2,363 living alone ), Female householders: 9,978 (2,512 living alone )8,323 spouses (8,199 opposite-sex spouses ), 1,750 unmarried partners , (1,676 opposite-sex unmarried partners ), 13,901 children (13,218 natural , 383 adopted , 299 stepchildren ), 865 grandchildren , 345 brothers or sisters , 1,016 parents , 13 foster children , 607 other relatives , 1,122 non-relatives In group quarters: 591
Size of family households: 4,345 2-persons , 2,708 3-persons , 2,614 4-persons , 1,217 5-persons , 502 6-persons , 189 7-or-more-persons .
Size of nonfamily households: 4,968 1-person , 1,565 2-persons , 163 3-persons .
6,146 married couples with children. single-parent households (476 men , 2,307 women ).
86.9% of residents of Attleboro speak English at home. of residents speak Spanish at home (56% speak English very well , 19% speak English well , 12% speak English not well , 12% don't speak English at all ).of residents speak other Indo-European language at home (61% speak English very well , 27% speak English well , 11% speak English not well , 1% don't speak English at all ).of residents speak Asian or Pacific Island language at home (36% speak English very well , 28% speak English well , 27% speak English not well , 10% don't speak English at all ).of residents speak other language at home (54% speak English very well , 45% speak English well , 2% speak English not well ).
Foreign born population: 5,075 (10.9%)of them are naturalized citizens )
Median number of rooms in houses and condos:
Median number of rooms in apartments
Owner-occupied Renter-occupied
Rooms in owner-occupied houses in Attleboro, Massachusetts
0 1 room 44 2 rooms 92 3 rooms 1,098 4 rooms 2,551 5 rooms 2,526 6 rooms 2,528 7 rooms 1,561 8 rooms 1,643 9+ rooms
Rooms in renter-occupied apartments in Attleboro, Massachusetts
111 1 room 512 2 rooms 1,200 3 rooms 1,897 4 rooms 1,657 5 rooms 481 6 rooms 293 7 rooms 22 8 rooms 57 9+ rooms
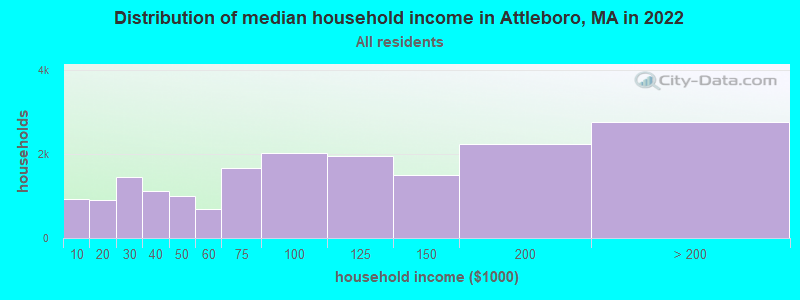
Attleboro, MA household income distribution 925 Less than $10,000896 $10,000 to $19,9991,459 $20,000 to $29,9991,110 $30,000 to $39,9991,009 $40,000 to $49,999691 $50,000 to $59,9991,671 $60,000 to $74,9992,015 $75,000 to $99,9991,959 $100,000 to $124,9991,503 $125,000 to $149,9992,235 $150,000 to $199,9992,762 $200,000 or more
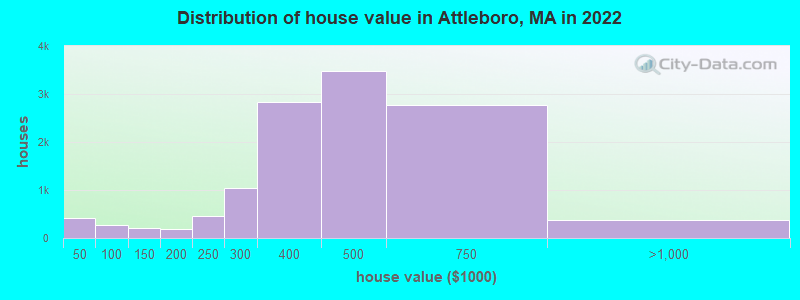
Home value of owner - occupied houses in 2022 in Attleboro, MA 97 Less than $10,00068 $10,000 to $14,999125 $20,000 to $24,99920 $25,000 to $29,99939 $35,000 to $39,99969 $40,000 to $49,999124 $50,000 to $59,99911 $70,000 to $79,99925 $80,000 to $89,99938 $90,000 to $99,999110 $100,000 to $124,99990 $125,000 to $149,99960 $150,000 to $174,999125 $175,000 to $199,999466 $200,000 to $249,9991,047 $250,000 to $299,9992,827 $300,000 to $399,9993,482 $400,000 to $499,9992,778 $500,000 to $749,999334 $750,000 to $999,99948 $2,000,000 or moreRent paid by renters in 2022 in Attleboro, MA 24 Less than $1006 $150 to $199170 $200 to $249105 $250 to $29966 $300 to $34918 $350 to $399159 $400 to $449130 $450 to $499182 $500 to $54925 $550 to $59955 $600 to $64962 $650 to $699122 $700 to $74970 $750 to $799268 $800 to $899613 $900 to $9991,001 $1,000 to $1,2491,027 $1,250 to $1,4991,676 $1,500 to $1,999322 $2,000 to $2,49960 $3,000 to $3,499227 No cash rent
Percentage of workers working in this county: 54.3%Number of people working at home: 4,306 (16.8% of all workers )
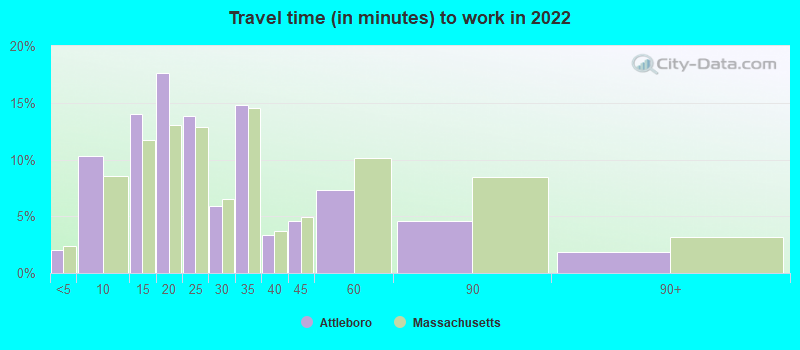
Travel time to work (commute)
Less than 5 minutes: 3395 to 9 minutes: 1,88610 to 14 minutes: 2,40515 to 19 minutes: 2,65920 to 24 minutes: 2,96825 to 29 minutes: 1,22130 to 34 minutes: 2,68935 to 39 minutes: 91840 to 44 minutes: 1,68745 to 59 minutes: 2,15560 to 89 minutes: 2,03790 or more minutes: 693
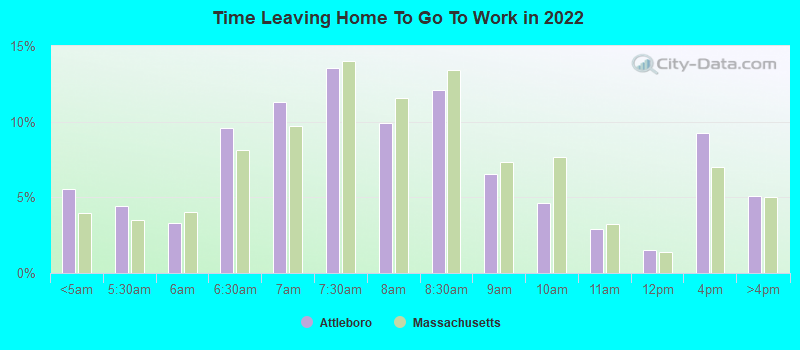
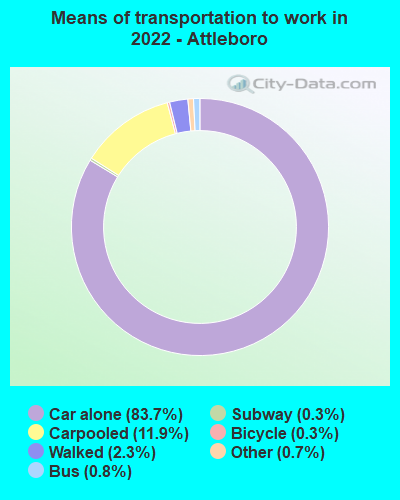
Means of transportation to work:
Drove a car alone: 14,746 (68.0%)Carpooled: 2,327 (10.7%)Bus : 128 (0.6%)Long-distance train or commuter rail : 102 (0.5%)Taxi: 137 (0.6%)Bicycle: 43 (0.2%)Walked: 285 (1.3%)Worked at home: 4,306 (19.9%)
Unemployment by race in 2022
Unemployment rate for White non-Hispanic residents 2.7% Males4.0% FemalesUnemployment rate for Black residents 6.7% MalesUnemployment rate for American Indian and Alaska Native residents 65.6% MalesUnemployment rate for Asian residents 2.9% FemalesUnemployment rate for other race residents 5.7% FemalesUnemployment rate for two or more race residents 3.7% Males11.0% FemalesUnemployment rate for Hispanic or Latino residents 1.7% Males4.1% Females
Year of entry for the foreign-born population in Attleboro, Massachusetts
1,704 2010 or later 985 2000 to 2009 952 1990 to 1999 1,139 1980 to 1989 735 1970 to 1979 1,002 Before 1970
First ancestries reported:
Irish: 3,155 (15.2%)
English: 1,730 (8.3%)
Portuguese: 1,703 (8.2%)
Italian: 1,560 (7.5%)
French: 1,199 (5.8%)
French Canadian: 1,143 (5.5%)
American: 995 (4.8%)
Polish: 892 (4.3%)
German: 634 (3.0%)
Brazilian: 384 (1.8%)
Egyptian: 286 (1.4%)
Haitian: 227 (1.1%)
Cape Verdean: 207 (1.0%)
Scottish: 197 (0.9%)
European: 195 (0.9%)
African: 143 (0.7%)
Russian: 129 (0.6%)
Ukrainian: 109 (0.5%)
Czech: 103 (0.5%)
Swedish: 97 (0.5%)
Jamaican: 84 (0.4%)
Armenian: 78 (0.4%)
Greek: 71 (0.3%)
Albanian: 67 (0.3%)
Jordanian: 64 (0.3%)
Syrian: 61 (0.3%)
Arab: 58 (0.3%)
Canadian: 56 (0.3%)
Eastern European: 43 (0.2%)
Moroccan: 39 (0.2%)
Lebanese: 39 (0.2%)
Serbian: 37 (0.2%)
Danish: 36 (0.2%)
Lithuanian: 34 (0.2%)
Scotch-Irish: 31 (0.1%)
West Indian: 29 (0.1%)
Yugoslavian: 27 (0.1%)
Norwegian: 24 (0.1%)
Dutch: 23 (0.1%)
Scandinavian: 22 (0.1%)
Senegalese: 22 (0.1%)
Austrian: 12 (0.06%)
British West Indian: 12 (0.06%)
Pennsylvania German: 9 (0.04%)
Welsh: 3 (0.01%)
British: 2 (0.01%)
Most common places of birth for foreign-born residents (%): Guatemala Attleboro:
18.2% (916)Massachusetts:
2.7% (32,733)
Portugal Attleboro:
13.7% (693)Massachusetts:
4.1% (50,360)
Brazil Attleboro:
6.8% (342)Massachusetts:
7.6% (92,959)
Egypt Attleboro:
5.2% (260)Massachusetts:
0.5% (6,109)
Haiti Attleboro:
4.7% (237)Massachusetts:
4.9% (60,432)
India Attleboro:
4.7% (236)Massachusetts:
6.8% (82,934)
Azores Islands Attleboro:
4.1% (209)Massachusetts:
0.9% (10,768)
China, excluding Hong Kong and Taiwan Attleboro:
3.7% (185)Massachusetts:
8.4% (103,233)
Canada Attleboro:
3.5% (176)Massachusetts:
2.3% (28,158)
Burma (Myanmar) Attleboro:
3.1% (158)Massachusetts:
0.1% (1,644)
Cambodia Attleboro:
2.7% (134)Massachusetts:
1.2% (14,305)
Pakistan Attleboro:
2.6% (133)Massachusetts:
0.6% (7,555)
Other Caribbean Attleboro:
2.6% (131)Massachusetts:
0.2% (2,335)
Russia Attleboro:
2.4% (119)Massachusetts:
1.5% (18,278)
Vietnam Attleboro:
2.3% (116)Massachusetts:
3.0% (37,197)
Ukraine Attleboro:
2.3% (114)Massachusetts:
0.9% (10,808)
Mexico Attleboro:
2.2% (113)Massachusetts:
1.1% (13,065)
Armenia Attleboro:
1.7% (86)Massachusetts:
0.2% (2,307)
Dominican Republic Attleboro:
1.7% (84)Massachusetts:
8.3% (101,767)
Place of birth for U.S.-born residents:
This state: 27,615Other state: 13,630Northeast: 10,830Midwest: 908South: 1,116West: 675 93.4% of Attleboro residents lived in the same house 1 years ago.
Out of people who lived in different houses, 32.7% lived in this county.
Out of people who lived in different counties, 55.0% lived in Massachusetts.
Attleboro:
93.4%State average:
87.7%
Education attainment for males 25 years and older:
No schooling: 198Nursery to 4th grade: 935th and 6th grade: 2197th and 8th grade: 1329th grade: 8410th grade: 23111th grade: 26612th grade, no diploma: 264High school graduate (or equivalency): 5,400Less than 1 year of college: 962Some college more than 1 year, no degree: 1,379Associate degree: 1,393Bachelor's degree: 3,745Master's degree: 1,327Professional school degree: 145Doctorate degree: 98
Education attainment for females 25 years and older:
No schooling: 228Nursery to 4th grade: 1405th and 6th grade: 1727th and 8th grade: 1609th grade: 8010th grade: 28111th grade: 13312th grade, no diploma: 403High school graduate (or equivalency): 5,266Less than 1 year of college: 851Some college more than 1 year, no degree: 1,550Associate degree: 1,974Bachelor's degree: 3,728Master's degree: 1,702Professional school degree: 237Doctorate degree: 96
Housing units in structures:
One, detached: 10,568One, attached: 1,131Two: 1,7053 or 4: 2,1925 to 9: 88810 to 19: 88220 to 49: 37050 or more: 978Mobile homes: 839Boats, RVs, vans, etc.: 49Median worth of mobile homes: $177,365
Housing units lacking complete plumbing facilities in 2022: 1.2%Housing units lacking complete kitchen facilities in 2022: 2.5%House/condo owner moved in on average 14 years ago
Renter moved in on average 4 years ago
Private vs. public school enrollment:
Students in private schools in grades 1 to 8 (elementary and middle school): 457 Here:
10.2%Massachusetts:
10.3%
Students in private schools in grades 9 to 12 (high school): 309 Here:
14.3%Massachusetts:
12.3%
Students in private undergraduate colleges: 566 Here:
47.8%Massachusetts:
51.2%