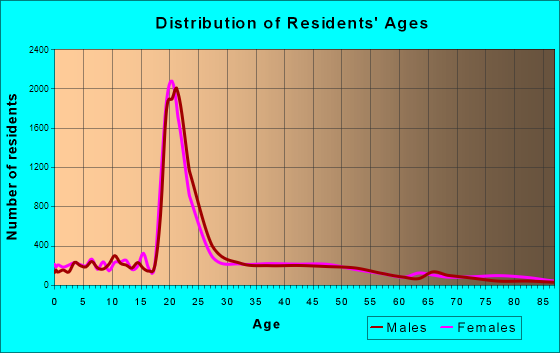
Auburn, AL (Alabama) Houses and Residents
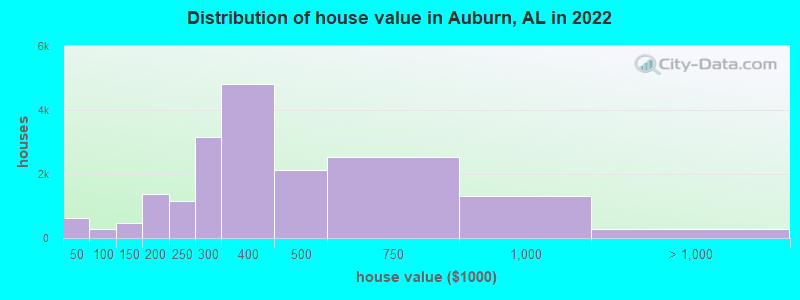
Estimated median house or condo value in 2022: $335,200 (it was $116,100 in 2000 )
Auburn:
$335,200Alabama:
$200,900
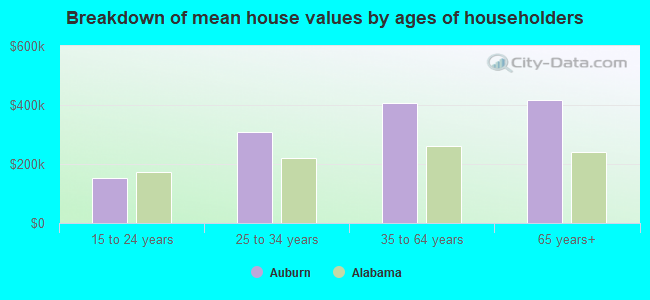
Lower value quartile - upper value quartile: $262,500 - $471,200Mean price in 2022: Detached houses: $444,185 Here:
$444,185State:
$273,076
Townhouses or other attached units: $218,332 Here:
$218,332State:
$222,857
In 2-unit structures: $112,488 Here:
$112,488State:
$191,282
In 3-to-4-unit structures: $151,361 Here:
$151,361State:
$194,388
In 5-or-more-unit structures: $230,706 Here:
$230,706State:
$307,073
Mobile homes: $35,119 Here:
$35,119State:
$77,780
Total population: 60,258 (Urban population: 38,765, Rural population: 4,131 (21 farm, 4,110 nonfarm ))
Houses: 35,738 (31,076 occupied: 15,632 owner occupied, 15,444 renter occupied )
% of renters here:
50%State:
30%
Housing density: 913 houses/condos per square mile
Median price asked for vacant for-sale houses and condos in 2022: $242,282.
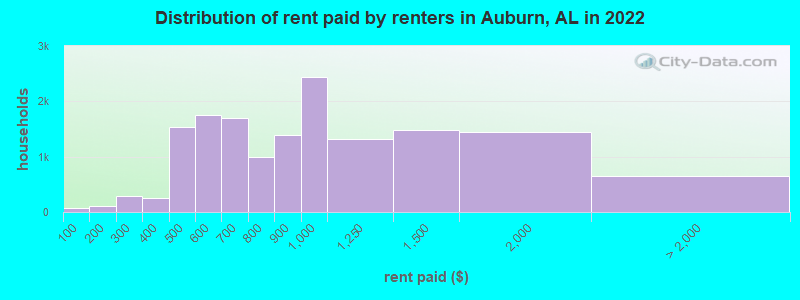
Median contract rent in 2022: $856 (lower quartile is $583, upper quartile is $1,129)
Median rent asked for vacant for-rent units in 2022: $2,340
Median gross rent in Auburn, AL in 2022: $999
Housing units in Auburn with a mortgage: 11,423 (963 second mortgage, 0 home equity loan, 636 both second mortgage and home equity loan )Houses without a mortgage: 139
Median household income for houses/condos with a mortgage: $109,994
Median household income for apartments without a mortgage: $80,240
Median monthly housing costs: $1,129
Data:
Median house or condo value ($)
Median house or condo value ($ change since 2000)
Median house or condo value ($) - White
Median house or condo value ($) - Black or African American
Median house or condo value ($) - Asian
Median house or condo value ($) - Hispanic or Latino
Median house or condo value ($) - American Indian and Alaska Native
Median house or condo value ($) - Multirace
Median house or condo value ($) - Other Race
Median price asked for mobile homes ($)
Household density (households per square mile)
Mean house or condo value by units in structure - 1, detached ($)
Mean house or condo value by units in structure - 1, attached ($)
Mean house or condo value by units in structure - 2 ($)
Mean house or condo value by units in structure by units in structure - 3 or 4 ($)
Mean house or condo value by units in structure - 5 or more ($)
Mean house or condo value by units in structure - Boat, RV, van, etc. ($)
Mean house or condo value by units in structure - Mobile home ($)
Median contract rent ($)
Median contract rent - Lower quartile ($)
Median contract rent - Upper quartile ($)
Median gross rent ($)
Urban houses (%)
Rural houses (%)
Houses occupied (%)
Houses occupied (% change since 2000)
Houses owner occupied (%)
Houses owner occupied (% change since 2000)
Houses renter occupied (%)
Houses renter occupied (% change since 2000)
Vacant housing units - For rent (%)
Vacant housing units - For rent (% change since 2000)
Vacant housing units - For sale only (%)
Vacant housing units - For sale only (% change since 2000)
Vacant housing units - Rented or sold, not occupied (%)
Vacant housing units - Rented or sold, not occupied (% change since 2000)
Vacant housing units - For seasonal, recreational, or occasional use (%)
Vacant housing units - For seasonal, recreational, or occasional use (% change since 2000)
Vacant housing units - For migrant workers (%)
Vacant housing units - For migrant workers (% change since 2000)
Vacant housing units - Other vacant (%)
Vacant housing units - Other vacant (% change since 2000)
Median monthly housing costs ($)
Median household income for houses/condos with a mortgage ($)
Median household income for houses/condos without a mortgage ($)
Median household income ($)
Median household income ($) - White
Median household income ($) - Black or African American
Median household income ($) - Asian
Median household income ($) - Hispanic or Latino
Median household income ($) - American Indian and Alaska Native
Median household income ($) - Multirace
Median household income ($) - Other Race
Mortgage status - with mortgage (%)
Mortgage status - with second mortgage (%)
Mortgage status - with home equity loan (%)
Mortgage status - with both second mortgage and home equity loan (%)
Mortgage status - without a mortgage (%)
Median year house/condo built
Median year apartment built
Household type by relationship - Male householder living alone (%)
Household type by relationship - Male householder not living alone (%)
Household type by relationship - Female householder living alone (%)
Household type by relationship - Female householder not living alone (%)
Household type by relationship - Opposite-Sex spouse (%)
Household type by relationship - Same-Sex spouse (%)
Household type by relationship - Opposite-Sex unmarried partner (%)
Household type by relationship - Same-Sex unmarried partner (%)
Household type by relationship - In group quarters (%)
Size of family households - 2-person household (%)
Size of family households - 3-person household (%)
Size of family households - 4-person household (%)
Size of family households - 5-person household (%)
Size of family households - 6-person household (%)
Size of family households - 7-or-more-person household (%)
Size of nonfamily households - 1-person household (%)
Size of nonfamily households - 2-person household (%)
Size of nonfamily households - 3-person household (%)
Size of nonfamily households - 4-person household (%)
Size of nonfamily households - 5-person household (%)
Size of nonfamily households - 6-person household (%)
Size of nonfamily households - 7-or-moreperson household (%)
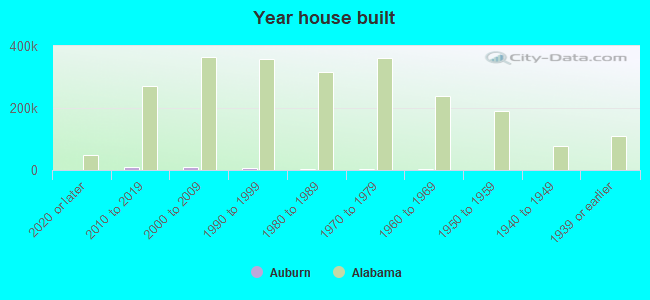
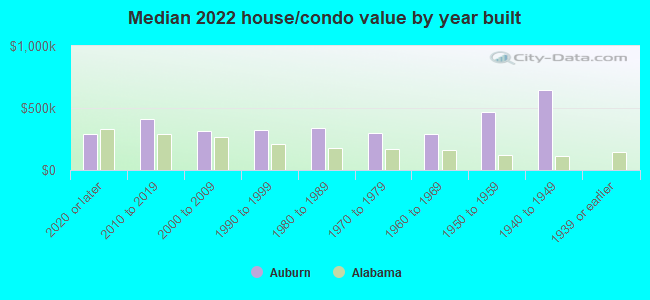
Year house built - Built 2010 or later (%)
Year house built - Built 2000 to 2009 (%)
Year house built - Built 1990 to 1999 (%)
Year house built - Built 1980 to 1989 (%)
Year house built - Built 1970 to 1979 (%)
Year house built - Built 1960 to 1969 (%)
Year house built - Built 1950 to 1959 (%)
Year house built - Built 1940 to 1949 (%)
Year house built - Built 1939 or earlier (%)
Median number of rooms in houses and condos
Median number of rooms in apartments
Median number of bedrooms in owner occupied houses
Mean number of bedrooms in owner occupied houses
Median number of bedrooms in renter occupied houses
Mean number of bedrooms in renter occupied houses
Median number of vehichles in owner occupied houses
Mean number of vehichles in owner occupied houses
Median number of vehichles in renter occupied houses
Mean number of vehichles in renter occupied houses
Rooms in owner-occupied houses - 1 room (%)
Rooms in owner-occupied houses - 2 rooms (%)
Rooms in owner-occupied houses - 3 rooms (%)
Rooms in owner-occupied houses - 4 rooms (%)
Rooms in owner-occupied houses - 5 rooms (%)
Rooms in owner-occupied houses - 6 rooms (%)
Rooms in owner-occupied houses - 7 rooms (%)
Rooms in owner-occupied houses - 8 rooms (%)
Rooms in owner-occupied houses - 9+ rooms (%)
Rooms in renter-occupied houses - 1 room (%)
Rooms in renter-occupied houses - 2 rooms (%)
Rooms in renter-occupied houses - 3 rooms (%)
Rooms in renter-occupied houses - 4 rooms (%)
Rooms in renter-occupied houses - 5 rooms (%)
Rooms in renter-occupied houses - 6 rooms (%)
Rooms in renter-occupied houses - 7 rooms (%)
Rooms in renter-occupied houses - 8 rooms (%)
Rooms in renter-occupied houses - 9+ rooms (%)
Bedrooms in owner-occupied houses - no bedrooms (%)
Bedrooms in owner-occupied houses - 1 bedroom (%)
Bedrooms in owner-occupied houses - 2 bedrooms (%)
Bedrooms in owner-occupied houses - 3 bedrooms (%)
Bedrooms in owner-occupied houses - 4 bedrooms (%)
Bedrooms in owner-occupied houses - 5+ bedrooms (%)
Bedrooms in renter-occupied houses - no bedrooms (%)
Bedrooms in renter-occupied houses - 1 bedroom (%)
Bedrooms in renter-occupied houses - 2 bedrooms (%)
Bedrooms in renter-occupied houses - 3 bedrooms (%)
Bedrooms in renter-occupied houses - 4 bedrooms (%)
Bedrooms in renter-occupied houses - 5+ bedrooms (%)
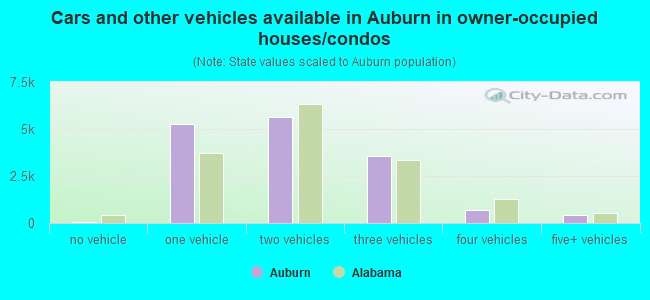
Vehicles available in owner-occupied houses - no vehicle available (%)
Vehicles available in owner-occupied houses - 1 vehicle available(%)
Vehicles available in owner-occupied houses - 2 Vehicles available (%)
Vehicles available in owner-occupied houses - 3 Vehicles available (%)
Vehicles available in owner-occupied houses - 4 Vehicles available (%)
Vehicles available in owner-occupied houses - 5+ Vehicles available (%)
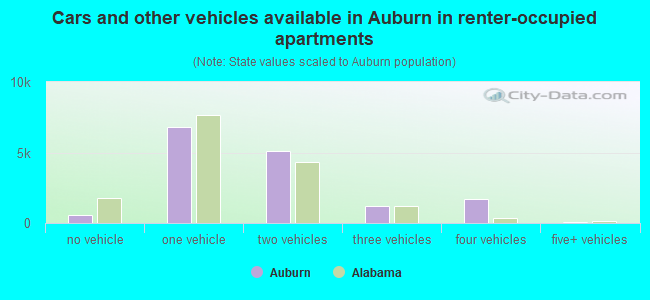
Vehicles available in renter-occupied houses - no vehicle available (%)
Vehicles available in renter-occupied houses - 1 vehicle available (%)
Vehicles available in renter-occupied houses - 2 Vehicles available (%)
Vehicles available in renter-occupied houses - 3 Vehicles available (%)
Vehicles available in renter-occupied houses - 4 Vehicles available (%)
Vehicles available in renter-occupied houses - 5+ Vehicles available (%)
Housing units in structures - 1, detached (%)
Housing units in structures - 1, attached (%)
Housing units in structures - 2 (%)
Housing units in structures - 3 or 4 (%)
Housing units in structures - 5 to 9 (%)
Housing units in structures - 10 to 19 (%)
Housing units in structures - 20 to 49 (%)
Housing units in structures - 50 or more (%)
Housing units in structures - Mobile home (%)
Housing units in structures - Boat, RV, van, etc. (%)
Housing units in structures - Owners - 1, detached (%)
Housing units in structures - Owners - 1, attached (%)
Housing units in structures - Owners - 2 (%)
Housing units in structures - Owners - 3 or 4 (%)
Housing units in structures - Owners - 5 to 9 (%)
Housing units in structures - Owners - 10 to 19 (%)
Housing units in structures - Owners - 20 to 49 (%)
Housing units in structures - Owners - 50 or more (%)
Housing units in structures - Owners - Mobile home (%)
Housing units in structures - Owners - Boat, RV, van, etc. (%)
Housing units in structures - Renters - 1, detached (%)
Housing units in structures - Renters - 1, attached (%)
Housing units in structures - Renters - 2 (%)
Housing units in structures - Renters - 3 or 4 (%)
Housing units in structures - Renters - 5 to 9 (%)
Housing units in structures - Renters - 10 to 19 (%)
Housing units in structures - Renters - 20 to 49 (%)
Housing units in structures - Renters - 50 or more (%)
Housing units in structures - Renters - Mobile home (%)
Housing units in structures - Renters - Boat, RV, van, etc. (%)
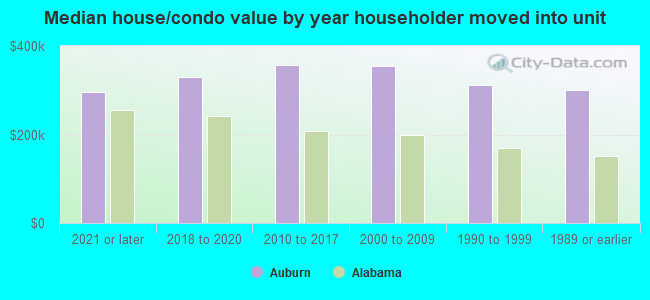
House/condo owner moved in on average (years ago)
Renter moved in on average (years ago)
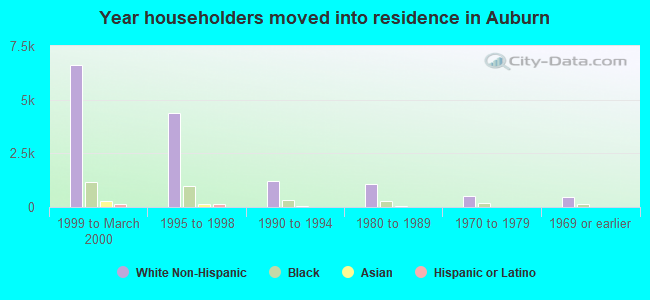
Year householder moved into unit - Moved in 1999 to March 2000 (%)
Year householder moved into unit - Moved in 1999 to March 2000 (%) - White
Year householder moved into unit - Moved in 1999 to March 2000 (%) - Black or African American
Year householder moved into unit - Moved in 1999 to March 2000 (%) - Asian
Year householder moved into unit - Moved in 1999 to March 2000 (%) - Hispanic or Latino
Year householder moved into unit - Moved in 1999 to March 2000 (%) - American Indian and Alaska Native
Year householder moved into unit - Moved in 1999 to March 2000 (%) - Multirace
Year householder moved into unit - Moved in 1999 to March 2000 (%) - Other Race
Year householder moved into unit - Moved in 1995 to 1998 (%)
Year householder moved into unit - Moved in 1995 to 1998 (%) - White
Year householder moved into unit - Moved in 1995 to 1998 (%) - Black or African American
Year householder moved into unit - Moved in 1995 to 1998 (%) - Asian
Year householder moved into unit - Moved in 1995 to 1998 (%) - Hispanic or Latino
Year householder moved into unit - Moved in 1995 to 1998 (%) - American Indian and Alaska Native
Year householder moved into unit - Moved in 1995 to 1998 (%) - Multirace
Year householder moved into unit - Moved in 1995 to 1998 (%) - Other Race
Year householder moved into unit - Moved in 1990 to 1994 (%)
Year householder moved into unit - Moved in 1990 to 1994 (%) - White
Year householder moved into unit - Moved in 1990 to 1994 (%) - Black or African American
Year householder moved into unit - Moved in 1990 to 1994 (%) - Asian
Year householder moved into unit - Moved in 1990 to 1994 (%) - Hispanic or Latino
Year householder moved into unit - Moved in 1990 to 1994 (%) - American Indian and Alaska Native
Year householder moved into unit - Moved in 1990 to 1994 (%) - Multirace
Year householder moved into unit - Moved in 1990 to 1994 (%) - Other Race
Year householder moved into unit - Moved in 1980 to 1989 (%)
Year householder moved into unit - Moved in 1980 to 1989 (%) - White
Year householder moved into unit - Moved in 1980 to 1989 (%) - Black or African American
Year householder moved into unit - Moved in 1980 to 1989 (%) - Asian
Year householder moved into unit - Moved in 1980 to 1989 (%) - Hispanic or Latino
Year householder moved into unit - Moved in 1980 to 1989 (%) - American Indian and Alaska Native
Year householder moved into unit - Moved in 1980 to 1989 (%) - Multirace
Year householder moved into unit - Moved in 1980 to 1989 (%) - Other Race
Year householder moved into unit - Moved in 1970 to 1979 (%)
Year householder moved into unit - Moved in 1970 to 1979 (%) - White
Year householder moved into unit - Moved in 1970 to 1979 (%) - Black or African American
Year householder moved into unit - Moved in 1970 to 1979 (%) - Asian
Year householder moved into unit - Moved in 1970 to 1979 (%) - Hispanic or Latino
Year householder moved into unit - Moved in 1970 to 1979 (%) - American Indian and Alaska Native
Year householder moved into unit - Moved in 1970 to 1979 (%) - Multirace
Year householder moved into unit - Moved in 1970 to 1979 (%) - Other Race
Year householder moved into unit - Moved in 1969 or earlier (%)
Year householder moved into unit - Moved in 1969 or earlier (%) - White
Year householder moved into unit - Moved in 1969 or earlier (%) - Black or African American
Year householder moved into unit - Moved in 1969 or earlier (%) - Asian
Year householder moved into unit - Moved in 1969 or earlier (%) - Hispanic or Latino
Year householder moved into unit - Moved in 1969 or earlier (%) - American Indian and Alaska Native
Year householder moved into unit - Moved in 1969 or earlier (%) - Multirace
Year householder moved into unit - Moved in 1969 or earlier (%) - Other Race
Housing units lacking complete plumbing facilities (%)
Housing units lacking complete kitchen facilities (%)
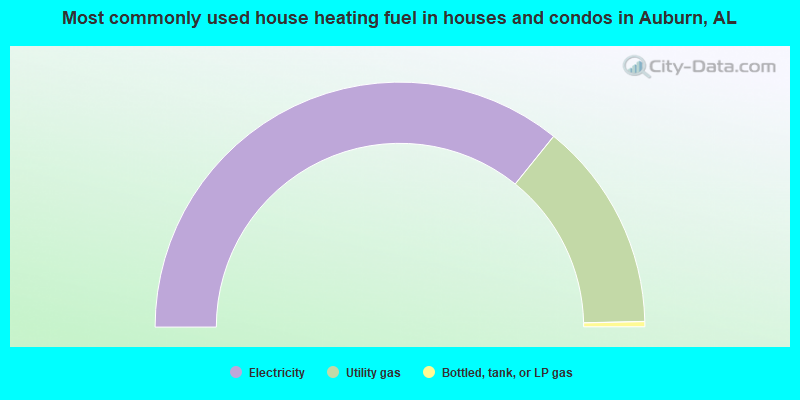
House heating fuel used in houses and condos - Utility gas (%)
House heating fuel used in houses and condos - Bottled, tank, or LP gas (%)
House heating fuel used in houses and condos - Electricity (%)
House heating fuel used in houses and condos - Fuel oil, kerosene, etc. (%)
House heating fuel used in houses and condos - Coal or coke (%)
House heating fuel used in houses and condos - Wood (%)
House heating fuel used in houses and condos - Solar energy (%)
House heating fuel used in houses and condos - Other fuel (%)
House heating fuel used in houses and condos - No fuel used (%)
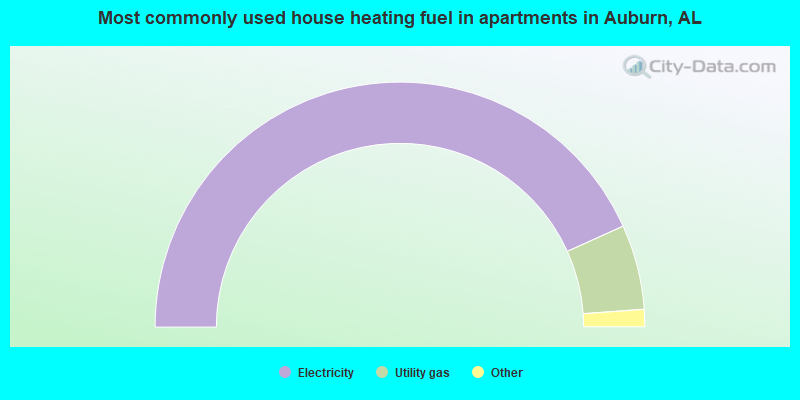
House heating fuel used in apartments - Utility gas (%)
House heating fuel used in apartments - Bottled, tank, or LP gas (%)
House heating fuel used in apartments - Electricity (%)
House heating fuel used in apartments - Fuel oil, kerosene, etc. (%)
House heating fuel used in apartments - Coal or coke (%)
House heating fuel used in apartments - Wood (%)
House heating fuel used in apartments - Solar energy (%)
House heating fuel used in apartments - Other fuel (%)
House heating fuel used in apartments - No fuel used (%)
Latest news about housing in Auburn, AL collected exclusively by city-data.com from local newspapers, TV, and radio stations
Median year house/condo built: 2005Median year apartment built: 1996Household type by relationship:
Households: 80,009
Male householders: 14,553 (4,360 living alone ), Female householders: 16,523 (6,815 living alone )12,467 spouses (12,399 opposite-sex spouses ), 1,096 unmarried partners , (1,076 opposite-sex unmarried partners ), 18,719 children (18,236 natural , 0 adopted , 483 stepchildren ), 287 grandchildren , 908 brothers or sisters , 250 parents , 0 foster children , 82 other relatives , 8,595 non-relatives In group quarters: 6,529
Size of family households: 6,302 2-persons , 3,917 3-persons , 3,700 4-persons , 1,087 5-persons , 30 6-persons , 63 7-or-more-persons .
Size of nonfamily households: 11,175 1-person , 2,789 2-persons , 1,130 3-persons , 699 4-persons , 44 5-persons , 140 6-persons .
12,320 married couples with children. single-parent households (515 men , 1,796 women ).
87.8% of residents of Auburn speak English at home. of residents speak Spanish at home (61% speak English very well , 26% speak English well , 12% speak English not well , 1% don't speak English at all ).of residents speak other Indo-European language at home (73% speak English very well , 15% speak English well , 12% speak English not well ).of residents speak Asian or Pacific Island language at home (40% speak English very well , 42% speak English well , 18% speak English not well , 1% don't speak English at all ).of residents speak other language at home (72% speak English very well , 24% speak English well , 4% speak English not well ).
Foreign born population: 7,615 (9.5%)of them are naturalized citizens )
Median number of rooms in houses and condos:
Median number of rooms in apartments
Owner-occupied Renter-occupied
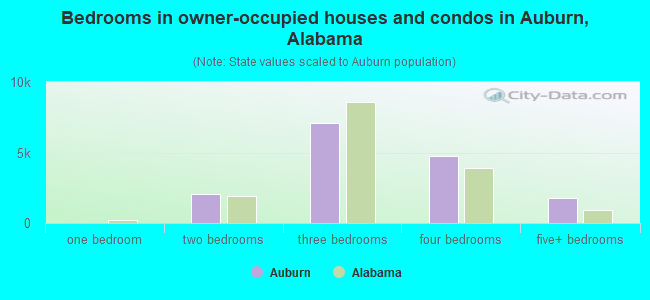
Bedrooms in owner-occupied houses and condos in Auburn, Alabama
0 no bedroom 0 1 bedroom 2,062 2 bedrooms 7,092 3 bedrooms 4,737 4 bedrooms 1,741 5+ bedrooms
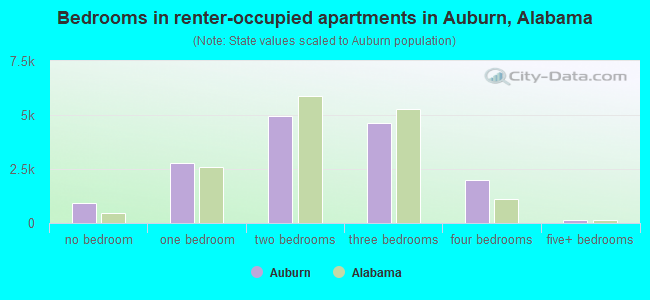
Bedrooms in renter-occupied apartments in Auburn, Alabama
946 no bedroom 2,777 1 bedroom 4,958 2 bedrooms 4,647 3 bedrooms 1,985 4 bedrooms 131 5+ bedrooms
Owner-occupied Renter-occupied
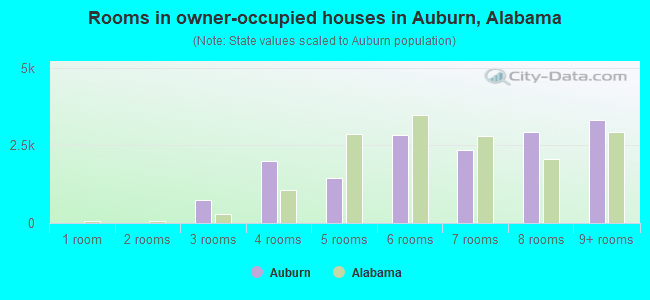
Rooms in owner-occupied houses in Auburn, Alabama
0 1 room 0 2 rooms 747 3 rooms 2,012 4 rooms 1,444 5 rooms 2,846 6 rooms 2,351 7 rooms 2,917 8 rooms 3,315 9+ rooms
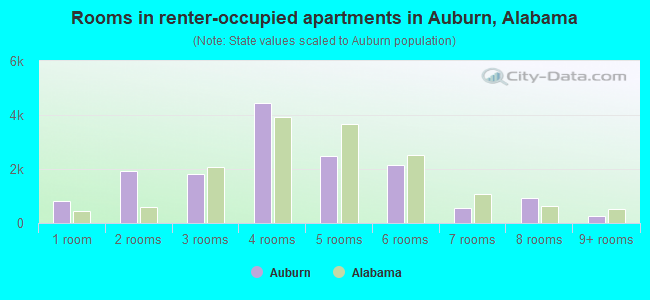
Rooms in renter-occupied apartments in Auburn, Alabama
815 1 room 1,940 2 rooms 1,822 3 rooms 4,454 4 rooms 2,495 5 rooms 2,165 6 rooms 571 7 rooms 913 8 rooms 269 9+ rooms
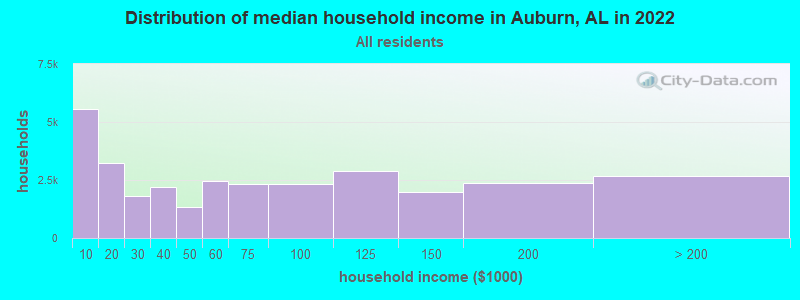
Auburn, AL household income distribution 5,556 Less than $10,0003,221 $10,000 to $19,9991,793 $20,000 to $29,9992,198 $30,000 to $39,9991,326 $40,000 to $49,9992,460 $50,000 to $59,9992,322 $60,000 to $74,9992,329 $75,000 to $99,9992,867 $100,000 to $124,9991,981 $125,000 to $149,9992,350 $150,000 to $199,9992,673 $200,000 or more
Home value of owner - occupied houses in 2022 in Auburn, AL 154 Less than $10,00048 $10,000 to $14,99935 $15,000 to $19,99995 $20,000 to $24,99986 $25,000 to $29,999110 $30,000 to $34,99945 $35,000 to $39,99940 $40,000 to $49,99955 $50,000 to $59,999106 $70,000 to $79,99957 $80,000 to $89,99920 $90,000 to $99,999199 $100,000 to $124,999264 $125,000 to $149,999772 $150,000 to $174,999607 $175,000 to $199,9991,169 $200,000 to $249,9993,163 $250,000 to $299,9994,811 $300,000 to $399,9992,133 $400,000 to $499,9992,539 $500,000 to $749,9991,325 $750,000 to $999,999202 $1,000,000 to $1,499,99989 $2,000,000 or moreRent paid by renters in 2022 in Auburn, AL 78 Less than $100103 $150 to $199154 $200 to $249142 $250 to $299229 $300 to $34922 $350 to $399563 $400 to $449979 $450 to $499935 $500 to $549820 $550 to $599976 $600 to $649724 $650 to $699590 $700 to $749399 $750 to $7991,384 $800 to $8992,444 $900 to $9991,321 $1,000 to $1,2491,477 $1,250 to $1,4991,446 $1,500 to $1,999104 $2,000 to $2,49976 $3,000 to $3,499478 No cash rent
Percentage of workers working in this county: 85.3%Number of people working at home: 4,009 (10.8% of all workers )
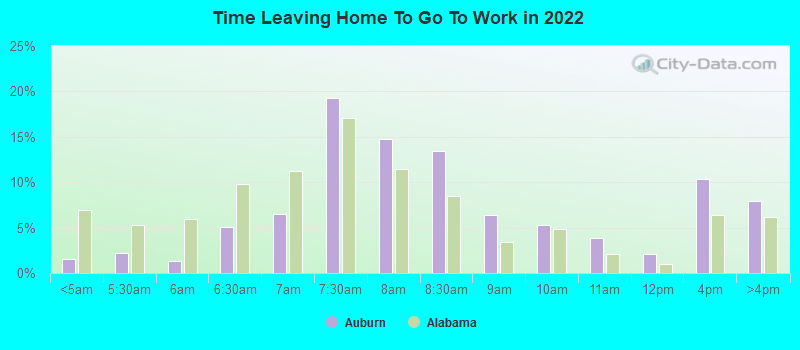
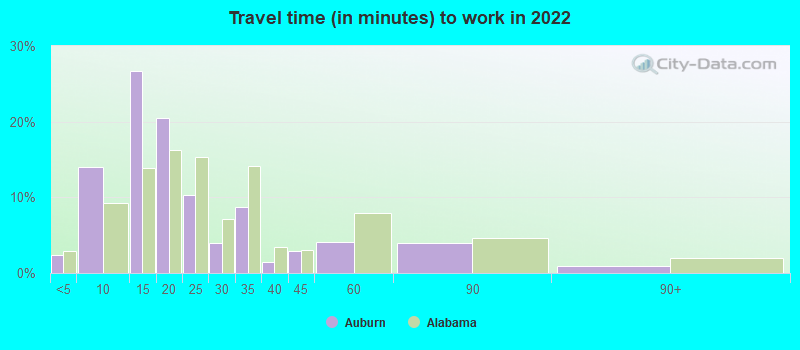
Travel time to work (commute)
Less than 5 minutes: 1,0665 to 9 minutes: 5,08110 to 14 minutes: 10,82415 to 19 minutes: 6,54620 to 24 minutes: 4,06025 to 29 minutes: 78530 to 34 minutes: 2,83935 to 39 minutes: 86640 to 44 minutes: 79245 to 59 minutes: 81260 to 89 minutes: 1,48890 or more minutes: 683
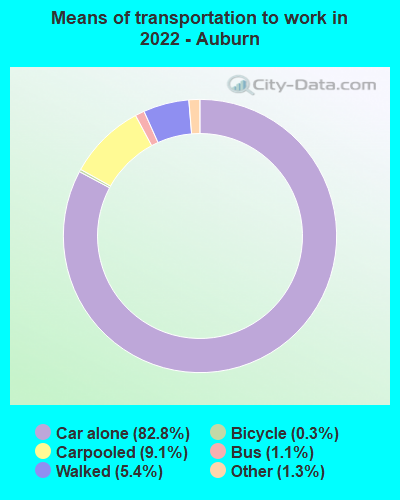
Means of transportation to work:
Drove a car alone: 28,589 (74.2%)Carpooled: 3,168 (8.2%)Bus : 341 (0.9%)Ferryboat: 16 (0.0%)Taxi: 582 (1.5%)Bicycle: 72 (0.2%)Walked: 2,010 (5.2%)Worked at home: 4,009 (10.4%)
Unemployment by race in 2022
Unemployment rate for White non-Hispanic residents 4.2% Males3.5% FemalesUnemployment rate for Black residents 2.4% Males3.5% FemalesUnemployment rate for Asian residents 0.7% MalesUnemployment rate for two or more race residents 4.4% Males2.7% FemalesUnemployment rate for Hispanic or Latino residents 2.4% Females
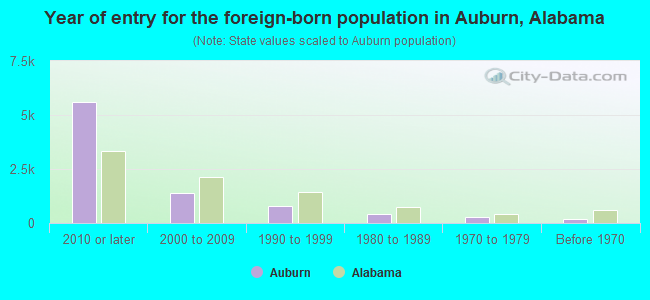
Year of entry for the foreign-born population in Auburn, Alabama
5,616 2010 or later 1,378 2000 to 2009 785 1990 to 1999 428 1980 to 1989 259 1970 to 1979 171 Before 1970
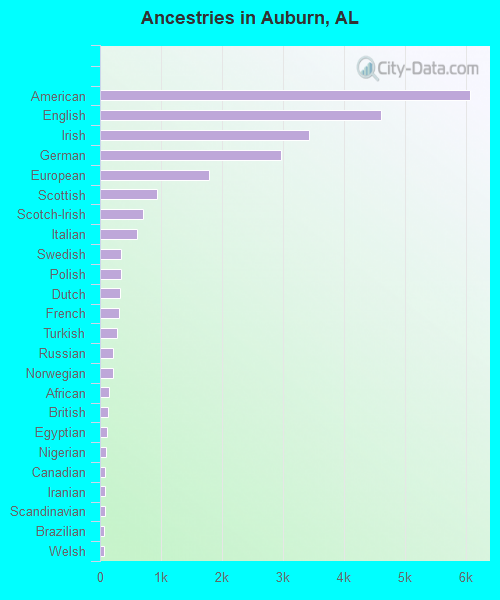
First ancestries reported:
American: 6,075 (13.7%)
English: 4,614 (10.4%)
Irish: 3,428 (7.8%)
German: 2,966 (6.7%)
European: 1,786 (4.0%)
Scottish: 929 (2.1%)
Scotch-Irish: 707 (1.6%)
Italian: 606 (1.4%)
Swedish: 352 (0.8%)
Polish: 344 (0.8%)
Dutch: 321 (0.7%)
French: 309 (0.7%)
Turkish: 286 (0.6%)
Russian: 221 (0.5%)
Norwegian: 206 (0.5%)
African: 142 (0.3%)
British: 125 (0.3%)
Egyptian: 117 (0.3%)
Nigerian: 101 (0.2%)
Canadian: 85 (0.2%)
Iranian: 84 (0.2%)
Scandinavian: 74 (0.2%)
Brazilian: 66 (0.1%)
Welsh: 59 (0.1%)
Ghanaian: 53 (0.1%)
Greek: 51 (0.1%)
Jamaican: 45 (0.1%)
Finnish: 44 (0.10%)
Portuguese: 38 (0.09%)
Northern European: 37 (0.08%)
Haitian: 28 (0.06%)
French Canadian: 19 (0.04%)
Slavic: 18 (0.04%)
Armenian: 18 (0.04%)
Lebanese: 18 (0.04%)
Bermudan: 18 (0.04%)
Hungarian: 14 (0.03%)
Danish: 12 (0.03%)
West Indian: 12 (0.03%)
Czechoslovakian: 9 (0.02%)
Swiss: 7 (0.02%) Most common places of birth for foreign-born residents (%): Korea Auburn:
34.8% (2,531)Alabama:
5.2% (9,293)
China, excluding Hong Kong and Taiwan Auburn:
15.3% (1,113)Alabama:
4.6% (8,075)
India Auburn:
7.7% (563)Alabama:
5.5% (9,672)
Mexico Auburn:
5.5% (397)Alabama:
26.4% (46,832)
Brazil Auburn:
2.3% (167)Alabama:
1.1% (1,867)
Vietnam Auburn:
2.2% (163)Alabama:
3.6% (6,414)
France Auburn:
2.1% (150)Alabama:
0.6% (1,115)
Other Eastern Africa Auburn:
1.9% (139)Alabama:
0.1% (260)
Peru Auburn:
1.8% (129)Alabama:
0.5% (801)
Bangladesh Auburn:
1.6% (114)Alabama:
0.6% (1,123)
Place of birth for U.S.-born residents:
This state: 40,034Other state: 31,625Northeast: 2,316Midwest: 5,864South: 20,622West: 2,823 78.1% of Auburn residents lived in the same house 1 years ago.
Out of people who lived in different houses, 29.8% lived in this county.
Out of people who lived in different counties, 63.5% lived in Alabama.
Auburn:
78.1%State average:
87.6%
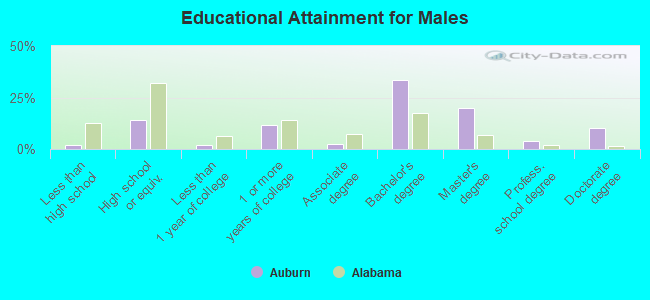
Education attainment for males 25 years and older:
No schooling: 109Nursery to 4th grade: 05th and 6th grade: 07th and 8th grade: 669th grade: 3010th grade: 011th grade: 012th grade, no diploma: 116High school graduate (or equivalency): 2,665Less than 1 year of college: 391Some college more than 1 year, no degree: 2,208Associate degree: 427Bachelor's degree: 6,283Master's degree: 3,678Professional school degree: 756Doctorate degree: 1,905
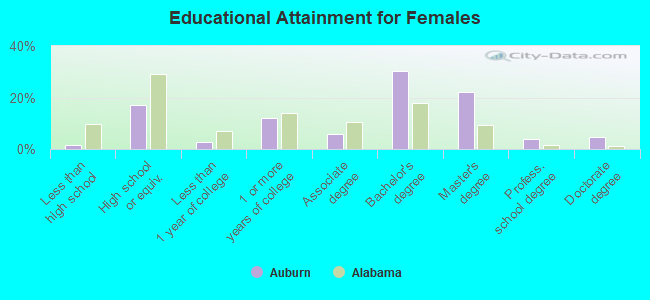
Education attainment for females 25 years and older:
No schooling: 39Nursery to 4th grade: 05th and 6th grade: 07th and 8th grade: 09th grade: 2710th grade: 3711th grade: 712th grade, no diploma: 209High school graduate (or equivalency): 3,612Less than 1 year of college: 548Some college more than 1 year, no degree: 2,534Associate degree: 1,207Bachelor's degree: 6,371Master's degree: 4,603Professional school degree: 785Doctorate degree: 996
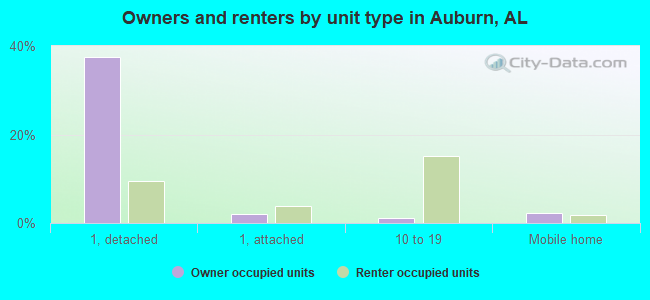
Housing units in structures:
One, detached: 16,190One, attached: 3,352Two: 1,4653 or 4: 2,2715 to 9: 2,33610 to 19: 4,23920 to 49: 2,68650 or more: 1,261Mobile homes: 1,938Median worth of mobile homes: $34,300
Housing units lacking complete kitchen facilities in 2022: 0.2%House/condo owner moved in on average 7 years ago
Renter moved in on average 2 years ago
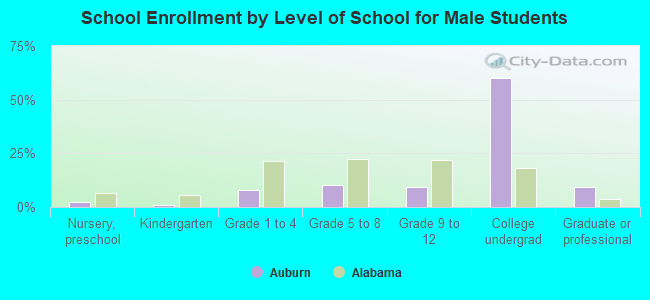
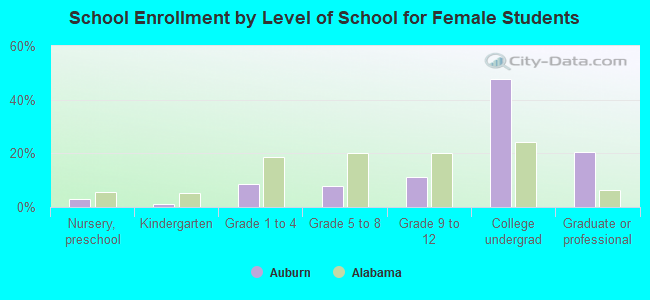
Private vs. public school enrollment:
Students in private schools in grades 1 to 8 (elementary and middle school): 87 Students in private schools in grades 9 to 12 (high school): 160 Students in private undergraduate colleges: 2,922