Aurora, IN (Indiana) Houses and Residents
| Aurora: | $132,540 |
| Indiana: | $208,700 |
Total population: 3,705 (All urban)
Houses: 1,577 (1,552 occupied: 944 owner occupied, 626 renter occupied)
| % of renters here: | 40% |
| State: | 29% |
Housing density: 568 houses/condos per square mile
Median price asked for vacant for-sale houses and condos in 2022: $881,985.
Median contract rent in 2022: $658 (lower quartile is $481, upper quartile is $732)
Median rent asked for vacant for-rent units in 2022: $545
Median gross rent in Aurora, IN in 2022: $837
Housing units in Aurora with a mortgage: 733 (11 second mortgage, 0 home equity loan, 4 both second mortgage and home equity loan)
Houses without a mortgage: 0
Median household income for houses/condos with a mortgage: $53,043
Median household income for apartments without a mortgage: $42,153
Median monthly housing costs: $865
Compare current foreclosures near Aurora, IN:
| Photo | Address | Area | Beds / Baths | Price | Details |
|---|---|---|---|---|---|

|
#1
Conwell St
Aurora, IN 47001
|
1,560 sq. feet
|
1 baths 3 beds |
$29,900
|
show details |

|
#2
Deborah Dr
Aurora, IN 47001
|
1,433 sq. feet
|
1 baths 3 beds |
show details | |

|
#3
Dinah Dr
Aurora, IN 47001
|
1,160 sq. feet
|
2 baths 2 beds |
show details | |

|
#4
Ridge Ave
Aurora, IN 47001
|
1,107 sq. feet
|
1 baths 3 beds |
show details | |

|
#5
Henschen Rd
Aurora, IN 47001
|
460 sq. feet
|
1 baths 2 beds |
show details | |

|
#6
Alberta Dr
Aurora, IN 47001
|
1,179 sq. feet
|
2 baths 3 beds |
show details | |

|
#7
5th St
Aurora, IN 47001
|
1,582 sq. feet
|
1 baths 3 beds |
show details | |

|
#8
Sunnyside Ave
Aurora, IN 47001
|
1,224 sq. feet
|
1 baths 3 beds |
show details | |

|
#9
Sunset Dr
Aurora, IN 47001
|
1,728 sq. feet
|
1 baths 3 beds |
show details | |

|
#10
Ridge Ave
Aurora, IN 47001
|
1,178 sq. feet
|
1 baths 2 beds |
show details |
| Photo | Address | Area | Beds / Baths | Price | Details |
|---|---|---|---|---|---|

|
#11
State Road 48
Aurora, IN 47001
|
806 sq. feet
|
1 baths 2 beds |
show details | |

|
#12
Grant St
Aurora, IN 47001
|
960 sq. feet
|
1 baths 3 beds |
show details | |

|
#13
Douglas Dr
Aurora, IN 47001
|
2,376 sq. feet
|
2 baths 3 beds |
show details | |

|
#14
Westside Dr
Aurora, IN 47001
|
3,914 sq. feet
|
3 baths 4 beds |
show details | |

|
#15
State Road 48
Aurora, IN 47001
|
1,483 sq. feet
|
1 baths 2 beds |
show details | |

|
#16
Indiana Ave
Aurora, IN 47001
|
926 sq. feet
|
1 baths 3 beds |
show details | |

|
#17
Harrison Ave
Aurora, IN 47001
|
1,960 sq. feet
|
1 baths 3 beds |
show details | |

|
#18
Sunnyside Ave
Aurora, IN 47001
|
1,888 sq. feet
|
1 baths 3 beds |
show details | |

|
#19
Wilmington Pike
Aurora, IN 47001
|
1,196 sq. feet
|
2 baths 3 beds |
show details | |

|
#20
Us Highway 50
Aurora, IN 47001
|
1,752 sq. feet
|
1 baths 3 beds |
show details |
| Photo | Address | Area | Beds / Baths | Price | Details |
|---|---|---|---|---|---|

|
#21
Hartford Rdg
Aurora, IN 47001
|
- sq. feet
|
1 baths 2 beds |
show details | |

|
#22
Walker Ave
Aurora, IN 47001
|
- sq. feet
|
- baths - beds |
show details | |

|
#23
State Road 350 N
Aurora, IN 47001
|
- sq. feet
|
- baths - beds |
show details | |

|
#24
Manchester St
Aurora, IN 47001
|
- sq. feet
|
- baths - beds |
show details | |

|
#25
Union Ridge Rd
Aurora, IN 47001
|
- sq. feet
|
- baths - beds |
show details | |

|
#26
Salem Rdg
Aurora, IN 47001
|
- sq. feet
|
- baths - beds |
show details | |

|
#27
John St # 1
Aurora, IN 47001
|
- sq. feet
|
- baths - beds |
show details | |

|
#28
Denali Dr
Aurora, IN 47001
|
- sq. feet
|
- baths - beds |
show details | |

|
#29
Franklin St
Aurora, IN 47001
|
- sq. feet
|
- baths - beds |
show details | |

|
#30
Race Rd
Cincinnati, OH 45211
|
1,523 sq. feet
|
2 baths 3 beds |
show details |
| Photo | Address | Area | Beds / Baths | Price | Details |
|---|---|---|---|---|---|

|
#31
Aberdeen Rd
Cross Plains, IN 47017
|
1,548 sq. feet
|
2 baths 3 beds |
show details | |

|
#32
Columbia Street
Patriot, IN 47038
|
1,560 sq. feet
|
2 baths 4 beds |
show details | |

|
#33
Western Ave
Sunman, IN 47041
|
1,753 sq. feet
|
1 baths 3 beds |
show details | |

|
#34
Alex Ct
Hebron, KY 41048
|
1,432 sq. feet
|
2 baths 3 beds |
show details | |

|
#35
Josephine St
Milan, IN 47031
|
- sq. feet
|
2 baths 3 beds |
show details | |

|
#36
Garvey Ave
Erlanger, KY 41018
|
848 sq. feet
|
1 baths 3 beds |
show details | |

|
#37
Golden Pond Dr
Union, KY 41091
|
1,700 sq. feet
|
2 baths 4 beds |
show details | |

|
#38
Hillside Ave
Cincinnati, OH 45233
|
1,566 sq. feet
|
1 baths 3 beds |
show details | |

|
#39
Harwinton Ln
Cincinnati, OH 45248
|
1,092 sq. feet
|
1 baths 2 beds |
show details | |

|
#40
Meadowlake Way
Union, KY 41091
|
4,012 sq. feet
|
2 baths 4 beds |
show details |
| Photo | Address | Area | Beds / Baths | Price | Details |
|---|---|---|---|---|---|

|
#41
Viscount Dr
Cincinnati, OH 45238
|
2,072 sq. feet
|
2 baths 4 beds |
show details | |

|
#42
Whitmore Dr
Cincinnati, OH 45238
|
1,530 sq. feet
|
1 baths 3 beds |
show details | |

|
#43
Roberta Ave
Florence, KY 41042
|
1,216 sq. feet
|
1 baths 3 beds |
show details | |

|
#44
Ebenezer Rd
Cincinnati, OH 45248
|
1,260 sq. feet
|
1 baths 3 beds |
show details | |

|
#45
State Road 250
Bennington, IN 47011
|
2,400 sq. feet
|
1 baths 3 beds |
show details | |

|
#46
Circle Dr
Harrison, OH 45030
|
1,180 sq. feet
|
1 baths 3 beds |
show details | |

|
#47
Rapid Run Rd Apt 5
Cincinnati, OH 45238
|
1,222 sq. feet
|
1 baths 2 beds |
show details | |

|
#48
Julmar Dr
Cincinnati, OH 45238
|
2,160 sq. feet
|
2 baths 4 beds |
show details | |

|
#49
Victoryview Ln
Cincinnati, OH 45233
|
1,066 sq. feet
|
2 baths 3 beds |
show details | |

|
Check over 1 million property listings on Foreclosure.com!
|
browse all offers | |||

Latest news about housing in Aurora, IN collected exclusively by city-data.com from local newspapers, TV, and radio stations

 | thinking about moving from Denver to Indianapolis (46 replies) |
| Illinois To NWI Migration (361 replies) |
| I am done with Illinois what are some good options in NW Indiana? (47 replies) |
| Bloomington, IN. - Good For A Retired Person? (7 replies) |
| Just a little love for your beautiful state (12 replies) |
| Moving to Southern Indiana -- Versailles, Aurora, Lawrenceburg and Madison (3 replies) |

Median year apartment built: 1954
Household type by relationship:
Households: 3,324- Male householders: 772 (288 living alone), Female householders: 767 (210 living alone)
458 spouses (458 opposite-sex spouses), 91 unmarried partners, (91 opposite-sex unmarried partners), 849 children (815 natural, 17 adopted, 16 stepchildren), 63 grandchildren, 11 brothers or sisters, 38 parents, 0 foster children, 20 other relatives, 252 non-relatives
Size of family households: 419 2-persons, 264 3-persons, 63 4-persons, 13 5-persons, 89 6-persons, 8 7-or-more-persons.
Size of nonfamily households: 511 1-person, 160 2-persons, 32 3-persons, 18 7-or-more-persons.
275 married couples with children.
271 single-parent households (119 men, 152 women).
97.7% of residents of Aurora speak English at home.
0.3% of residents speak Spanish at home (100% speak English very well).
0.9% of residents speak other Indo-European language at home (76% speak English very well, 24% speak English well).
Foreign born population: 70 (2.1%)
(85.7% of them are naturalized citizens)
| Here: | 6.9 |
| State: | 6.6 |
| Here: | 4.0 |
| State: | 4.3 |

- Bedrooms in owner-occupied houses and condos in Aurora, Indiana
- 0no bedroom
- 181 bedroom
- 2472 bedrooms
- 4163 bedrooms
- 2354 bedrooms
- 285+ bedrooms

- Bedrooms in renter-occupied apartments in Aurora, Indiana
- 10no bedroom
- 2371 bedroom
- 1862 bedrooms
- 1383 bedrooms
- 04 bedrooms
- 555+ bedrooms

- Cars and other vehicles available in Aurora in owner-occupied houses/condos
- 44no vehicle
- 2721 vehicle
- 4312 vehicles
- 1303 vehicles
- 474 vehicles
- 205+ vehicles

- Cars and other vehicles available in Aurora in renter-occupied apartments
- 108no vehicle
- 3451 vehicle
- 1022 vehicles
- 603 vehicles
- 04 vehicles
- 125+ vehicles

- Rooms in owner-occupied houses in Aurora, Indiana
- 01 room
- 02 rooms
- 03 rooms
- 754 rooms
- 1335 rooms
- 1746 rooms
- 2377 rooms
- 2368 rooms
- 899+ rooms

- Rooms in renter-occupied apartments in Aurora, Indiana
- 101 room
- 02 rooms
- 2313 rooms
- 1134 rooms
- 915 rooms
- 866 rooms
- 547 rooms
- 128 rooms
- 289+ rooms


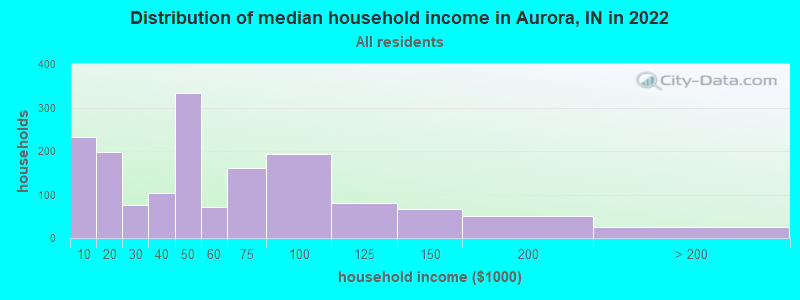
Aurora, IN household income distribution

- 233Less than $10,000
- 197$10,000 to $19,999
- 77$20,000 to $29,999
- 104$30,000 to $39,999
- 333$40,000 to $49,999
- 71$50,000 to $59,999
- 162$60,000 to $74,999
- 193$75,000 to $99,999
- 81$100,000 to $124,999
- 67$125,000 to $149,999
- 50$150,000 to $199,999
- 26$200,000 or more
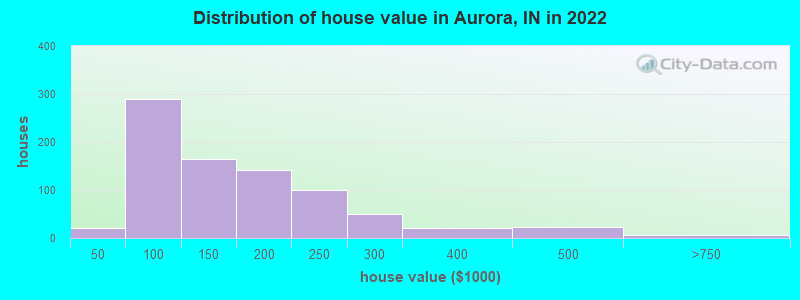
Home value of owner - occupied houses in 2022 in Aurora, IN
-
- 6$25,000 to $29,999
- 8$30,000 to $34,999
- 4$35,000 to $39,999
- 31$50,000 to $59,999
- 26$60,000 to $69,999
- 57$70,000 to $79,999
- 12$80,000 to $89,999
- 160$90,000 to $99,999
- 80$100,000 to $124,999
- 82$125,000 to $149,999
- 89$150,000 to $174,999
- 51$175,000 to $199,999
- 99$200,000 to $249,999
- 50$250,000 to $299,999
- 20$300,000 to $399,999
- 22$400,000 to $499,999
- 6$500,000 to $749,999
Rent paid by renters in 2022 in Aurora, IN
-
- 6$100 to $149
- 54$200 to $249
- 23$250 to $299
- 10$300 to $349
- 38$400 to $449
- 29$450 to $499
- 9$500 to $549
- 29$550 to $599
- 83$600 to $649
- 166$650 to $699
- 27$700 to $749
- 13$750 to $799
- 34$800 to $899
- 8$900 to $999
- 55$1,000 to $1,249
- 17$1,500 to $1,999


Percentage of workers working in this county: 46.6%
Number of people working at home: 53 (3.0% of all workers)
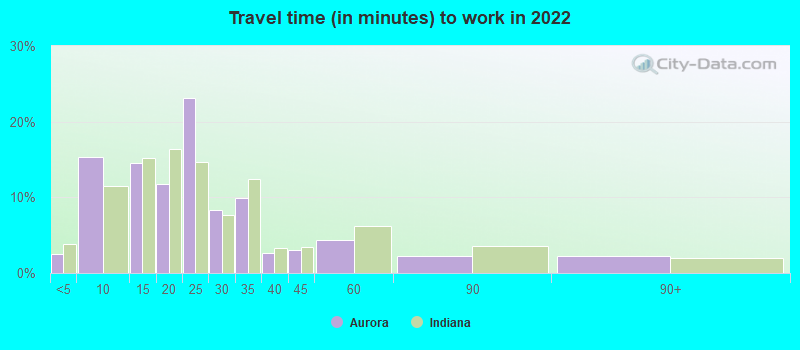
Travel time to work (commute)
- Less than 5 minutes: 67
- 5 to 9 minutes: 312
- 10 to 14 minutes: 118
- 15 to 19 minutes: 103
- 20 to 24 minutes: 153
- 25 to 29 minutes: 211
- 30 to 34 minutes: 201
- 35 to 39 minutes: 42
- 40 to 44 minutes: 163
- 45 to 59 minutes: 181
- 60 to 89 minutes: 75
- 90 or more minutes: 28
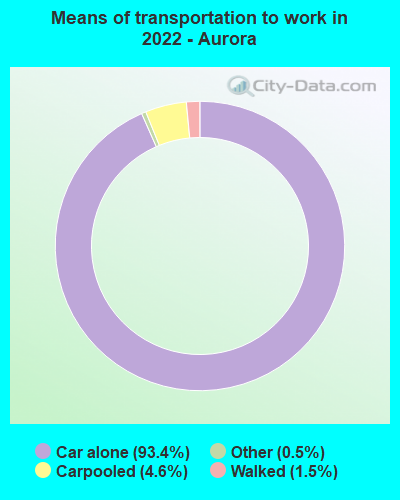
Means of transportation to work:
- Drove a car alone: 1,580 (87.8%)
- Carpooled: 86 (4.8%)
- Taxi: 10 (0.6%)
- Walked: 24 (1.3%)
- Worked at home: 53 (2.9%)

- Unemployment by race in 2022
- Unemployment rate for White non-Hispanic residents
- 0.9%Males
- 1.5%Females
- Unemployment rate for Black residents
- 37.9%Males

- Year of entry for the foreign-born population in Aurora, Indiana
- 02010 or later
- 432000 to 2009
- 121990 to 1999
- 01980 to 1989
- 51970 to 1979
- 31Before 1970

First ancestries reported:
- German: 361 (24.3%)
- American: 246 (16.6%)
- Irish: 176 (11.9%)
- English: 158 (10.6%)
- Russian: 97 (6.5%)
- Italian: 37 (2.5%)
- Scottish: 21 (1.4%)
- Scotch-Irish: 13 (0.9%)
- Polish: 9 (0.6%)
- Swedish: 7 (0.5%)
- Eastern European: 6 (0.4%)
- French: 6 (0.4%)
Most common places of birth for foreign-born residents (%):
| Aurora: | 72.9% (51) |
| Indiana: | 27.0% (101,996) |
| Aurora: | 20.0% (14) |
| Indiana: | 0.4% (1,540) |
Place of birth for U.S.-born residents:
- This state: 1,638
- Other state: 1,598
- Northeast: 155
- Midwest: 1,027
- South: 267
- West: 156
91.7% of Aurora residents lived in the same house 1 years ago.
Out of people who lived in different houses, 35.1% lived in this county.
Out of people who lived in different counties, 49.6% lived in Indiana.
| Aurora: | 91.7% |
| State average: | 87.1% |
Education attainment for males 25 years and older:
- No schooling: 14
- Nursery to 4th grade: 1
- 5th and 6th grade: 0
- 7th and 8th grade: 0
- 9th grade: 11
- 10th grade: 12
- 11th grade: 16
- 12th grade, no diploma: 59
- High school graduate (or equivalency): 638
- Less than 1 year of college: 55
- Some college more than 1 year, no degree: 131
- Associate degree: 76
- Bachelor's degree: 134
- Master's degree: 27
- Professional school degree: 11
- Doctorate degree: 12

Education attainment for females 25 years and older:
- No schooling: 0
- Nursery to 4th grade: 6
- 5th and 6th grade: 0
- 7th and 8th grade: 0
- 9th grade: 5
- 10th grade: 32
- 11th grade: 93
- 12th grade, no diploma: 28
- High school graduate (or equivalency): 504
- Less than 1 year of college: 125
- Some college more than 1 year, no degree: 58
- Associate degree: 153
- Bachelor's degree: 157
- Master's degree: 13
- Professional school degree: 0
- Doctorate degree: 0


Housing units in structures:
- One, detached: 1,106
- One, attached: 51
- Two: 141
- 3 or 4: 134
- 5 to 9: 19
- 10 to 19: 27
- 20 to 49: 87
- Mobile homes: 9
House/condo owner moved in on average 14 years ago
Renter moved in on average 7 years ago

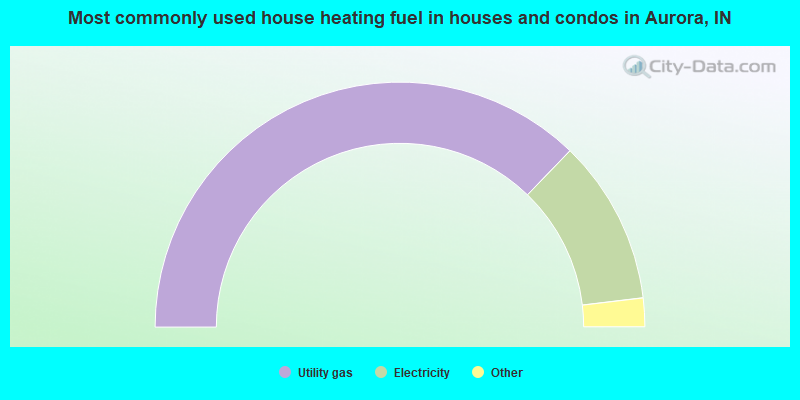
- 74.5%Utility gas
- 21.8%Electricity
- 2.9%Bottled, tank, or LP gas
- 0.8%Fuel oil, kerosene, etc.
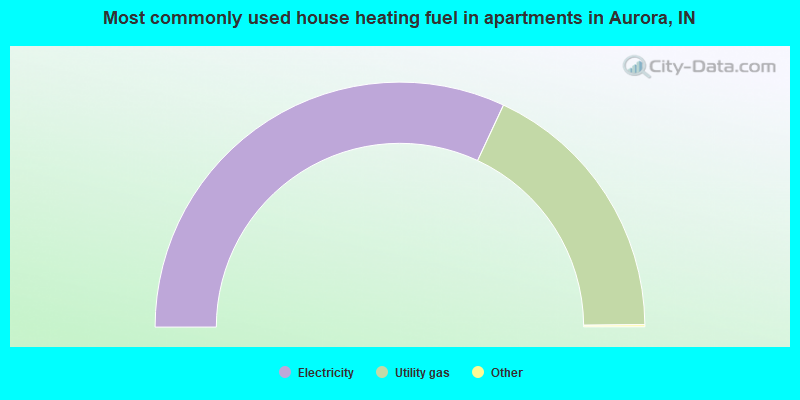
- 64.1%Electricity
- 35.9%Utility gas
Private vs. public school enrollment:
| Here: | 7.7% |
| Indiana: | 14.9% |
| Here: | 21.6% |
| Indiana: | 11.4% |
| Here: | 31.7% |
| Indiana: | 22.3% |


