Aventura, FL (Florida) Houses and Residents
Estimated median house or condo value in 2022: $464,896 (it was $118,100 in 2000 )
Aventura:
$464,896Florida:
$354,100
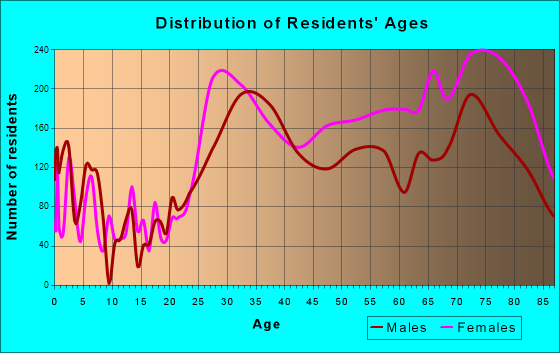
Lower value quartile - upper value quartile: $284,388 - $808,411Total population: 37,451 (Urban population: 25,267, Rural population: 0)
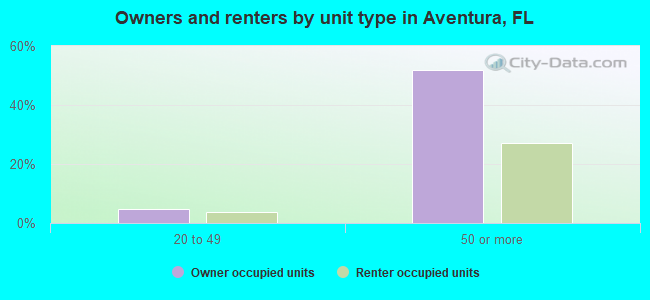
Houses: 29,020 (18,749 occupied: 12,563 owner occupied, 6,434 renter occupied )
% of renters here:
34%State:
33%
Housing density: 10,733 houses/condos per square mile
Median price asked for vacant for-sale houses and condos in 2022: $547,867.
Median contract rent in 2022: over $2,000 (lower quartile is $1,744, upper quartile is over $2,000)
Median rent asked for vacant for-rent units in 2022: $2,759
Median gross rent in Aventura, FL in 2022: over $2,000
Housing units in Aventura with a mortgage: 4,899 (547 second mortgage, 0 home equity loan, 486 both second mortgage and home equity loan )Houses without a mortgage: 151
Median household income for houses/condos with a mortgage: $133,094
Median household income for apartments without a mortgage: $72,396
Median monthly housing costs: $2,071
Data:
Median house or condo value ($)
Median house or condo value ($ change since 2000)
Median house or condo value ($) - White
Median house or condo value ($) - Black or African American
Median house or condo value ($) - Asian
Median house or condo value ($) - Hispanic or Latino
Median house or condo value ($) - American Indian and Alaska Native
Median house or condo value ($) - Multirace
Median house or condo value ($) - Other Race
Median price asked for mobile homes ($)
Household density (households per square mile)
Mean house or condo value by units in structure - 1, detached ($)
Mean house or condo value by units in structure - 1, attached ($)
Mean house or condo value by units in structure - 2 ($)
Mean house or condo value by units in structure by units in structure - 3 or 4 ($)
Mean house or condo value by units in structure - 5 or more ($)
Mean house or condo value by units in structure - Boat, RV, van, etc. ($)
Mean house or condo value by units in structure - Mobile home ($)
Median contract rent ($)
Median contract rent - Lower quartile ($)
Median contract rent - Upper quartile ($)
Median gross rent ($)
Urban houses (%)
Rural houses (%)
Houses occupied (%)
Houses occupied (% change since 2000)
Houses owner occupied (%)
Houses owner occupied (% change since 2000)
Houses renter occupied (%)
Houses renter occupied (% change since 2000)
Vacant housing units - For rent (%)
Vacant housing units - For rent (% change since 2000)
Vacant housing units - For sale only (%)
Vacant housing units - For sale only (% change since 2000)
Vacant housing units - Rented or sold, not occupied (%)
Vacant housing units - Rented or sold, not occupied (% change since 2000)
Vacant housing units - For seasonal, recreational, or occasional use (%)
Vacant housing units - For seasonal, recreational, or occasional use (% change since 2000)
Vacant housing units - For migrant workers (%)
Vacant housing units - For migrant workers (% change since 2000)
Vacant housing units - Other vacant (%)
Vacant housing units - Other vacant (% change since 2000)
Median monthly housing costs ($)
Median household income for houses/condos with a mortgage ($)
Median household income for houses/condos without a mortgage ($)
Median household income ($)
Median household income ($) - White
Median household income ($) - Black or African American
Median household income ($) - Asian
Median household income ($) - Hispanic or Latino
Median household income ($) - American Indian and Alaska Native
Median household income ($) - Multirace
Median household income ($) - Other Race
Mortgage status - with mortgage (%)
Mortgage status - with second mortgage (%)
Mortgage status - with home equity loan (%)
Mortgage status - with both second mortgage and home equity loan (%)
Mortgage status - without a mortgage (%)
Median year house/condo built
Median year apartment built
Household type by relationship - Male householder living alone (%)
Household type by relationship - Male householder not living alone (%)
Household type by relationship - Female householder living alone (%)
Household type by relationship - Female householder not living alone (%)
Household type by relationship - Opposite-Sex spouse (%)
Household type by relationship - Same-Sex spouse (%)
Household type by relationship - Opposite-Sex unmarried partner (%)
Household type by relationship - Same-Sex unmarried partner (%)
Household type by relationship - In group quarters (%)
Size of family households - 2-person household (%)
Size of family households - 3-person household (%)
Size of family households - 4-person household (%)
Size of family households - 5-person household (%)
Size of family households - 6-person household (%)
Size of family households - 7-or-more-person household (%)
Size of nonfamily households - 1-person household (%)
Size of nonfamily households - 2-person household (%)
Size of nonfamily households - 3-person household (%)
Size of nonfamily households - 4-person household (%)
Size of nonfamily households - 5-person household (%)
Size of nonfamily households - 6-person household (%)
Size of nonfamily households - 7-or-moreperson household (%)
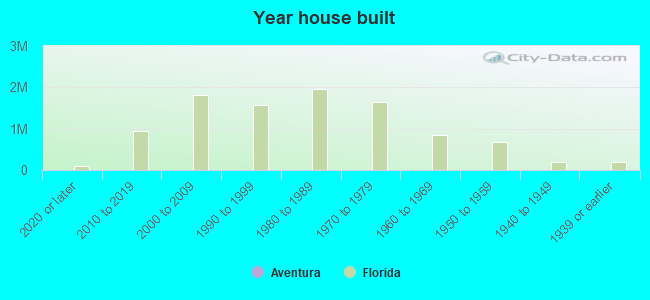
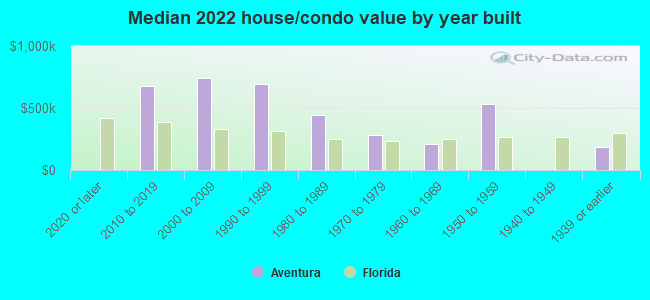
Year house built - Built 2010 or later (%)
Year house built - Built 2000 to 2009 (%)
Year house built - Built 1990 to 1999 (%)
Year house built - Built 1980 to 1989 (%)
Year house built - Built 1970 to 1979 (%)
Year house built - Built 1960 to 1969 (%)
Year house built - Built 1950 to 1959 (%)
Year house built - Built 1940 to 1949 (%)
Year house built - Built 1939 or earlier (%)
Median number of rooms in houses and condos
Median number of rooms in apartments
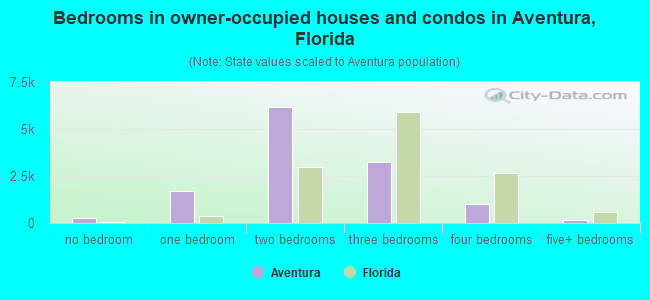
Median number of bedrooms in owner occupied houses
Mean number of bedrooms in owner occupied houses
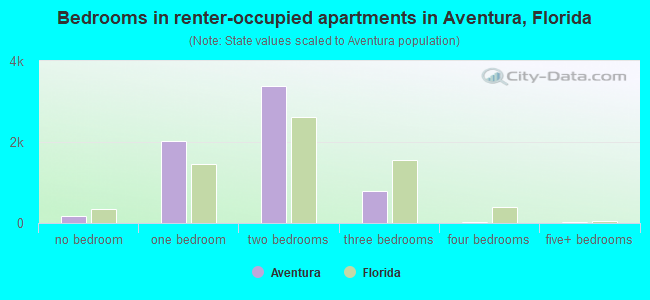
Median number of bedrooms in renter occupied houses
Mean number of bedrooms in renter occupied houses
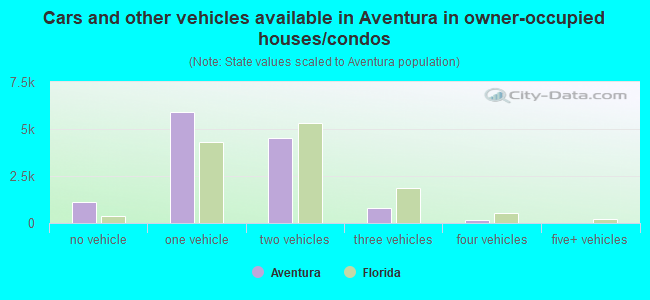
Median number of vehichles in owner occupied houses
Mean number of vehichles in owner occupied houses
Median number of vehichles in renter occupied houses
Mean number of vehichles in renter occupied houses
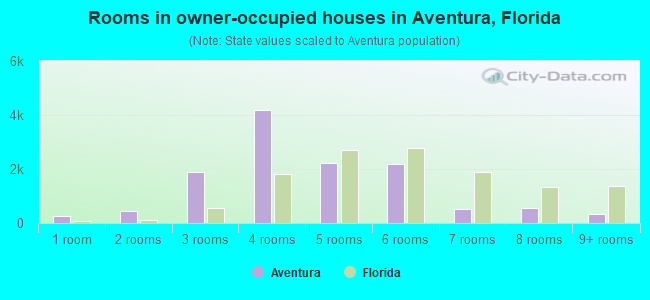
Rooms in owner-occupied houses - 1 room (%)
Rooms in owner-occupied houses - 2 rooms (%)
Rooms in owner-occupied houses - 3 rooms (%)
Rooms in owner-occupied houses - 4 rooms (%)
Rooms in owner-occupied houses - 5 rooms (%)
Rooms in owner-occupied houses - 6 rooms (%)
Rooms in owner-occupied houses - 7 rooms (%)
Rooms in owner-occupied houses - 8 rooms (%)
Rooms in owner-occupied houses - 9+ rooms (%)
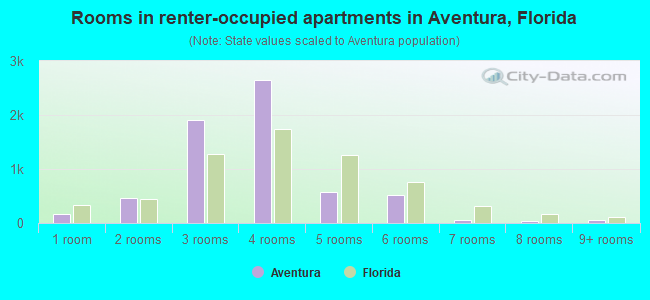
Rooms in renter-occupied houses - 1 room (%)
Rooms in renter-occupied houses - 2 rooms (%)
Rooms in renter-occupied houses - 3 rooms (%)
Rooms in renter-occupied houses - 4 rooms (%)
Rooms in renter-occupied houses - 5 rooms (%)
Rooms in renter-occupied houses - 6 rooms (%)
Rooms in renter-occupied houses - 7 rooms (%)
Rooms in renter-occupied houses - 8 rooms (%)
Rooms in renter-occupied houses - 9+ rooms (%)
Bedrooms in owner-occupied houses - no bedrooms (%)
Bedrooms in owner-occupied houses - 1 bedroom (%)
Bedrooms in owner-occupied houses - 2 bedrooms (%)
Bedrooms in owner-occupied houses - 3 bedrooms (%)
Bedrooms in owner-occupied houses - 4 bedrooms (%)
Bedrooms in owner-occupied houses - 5+ bedrooms (%)
Bedrooms in renter-occupied houses - no bedrooms (%)
Bedrooms in renter-occupied houses - 1 bedroom (%)
Bedrooms in renter-occupied houses - 2 bedrooms (%)
Bedrooms in renter-occupied houses - 3 bedrooms (%)
Bedrooms in renter-occupied houses - 4 bedrooms (%)
Bedrooms in renter-occupied houses - 5+ bedrooms (%)
Vehicles available in owner-occupied houses - no vehicle available (%)
Vehicles available in owner-occupied houses - 1 vehicle available(%)
Vehicles available in owner-occupied houses - 2 Vehicles available (%)
Vehicles available in owner-occupied houses - 3 Vehicles available (%)
Vehicles available in owner-occupied houses - 4 Vehicles available (%)
Vehicles available in owner-occupied houses - 5+ Vehicles available (%)
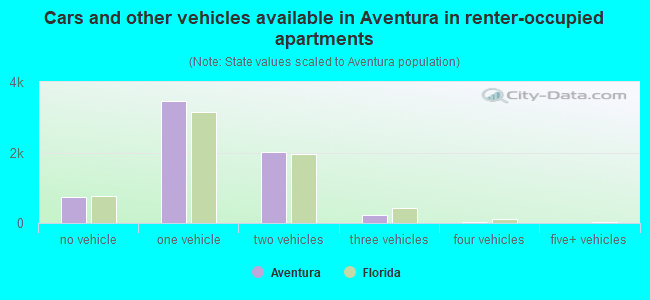
Vehicles available in renter-occupied houses - no vehicle available (%)
Vehicles available in renter-occupied houses - 1 vehicle available (%)
Vehicles available in renter-occupied houses - 2 Vehicles available (%)
Vehicles available in renter-occupied houses - 3 Vehicles available (%)
Vehicles available in renter-occupied houses - 4 Vehicles available (%)
Vehicles available in renter-occupied houses - 5+ Vehicles available (%)
Housing units in structures - 1, detached (%)
Housing units in structures - 1, attached (%)
Housing units in structures - 2 (%)
Housing units in structures - 3 or 4 (%)
Housing units in structures - 5 to 9 (%)
Housing units in structures - 10 to 19 (%)
Housing units in structures - 20 to 49 (%)
Housing units in structures - 50 or more (%)
Housing units in structures - Mobile home (%)
Housing units in structures - Boat, RV, van, etc. (%)
Housing units in structures - Owners - 1, detached (%)
Housing units in structures - Owners - 1, attached (%)
Housing units in structures - Owners - 2 (%)
Housing units in structures - Owners - 3 or 4 (%)
Housing units in structures - Owners - 5 to 9 (%)
Housing units in structures - Owners - 10 to 19 (%)
Housing units in structures - Owners - 20 to 49 (%)
Housing units in structures - Owners - 50 or more (%)
Housing units in structures - Owners - Mobile home (%)
Housing units in structures - Owners - Boat, RV, van, etc. (%)
Housing units in structures - Renters - 1, detached (%)
Housing units in structures - Renters - 1, attached (%)
Housing units in structures - Renters - 2 (%)
Housing units in structures - Renters - 3 or 4 (%)
Housing units in structures - Renters - 5 to 9 (%)
Housing units in structures - Renters - 10 to 19 (%)
Housing units in structures - Renters - 20 to 49 (%)
Housing units in structures - Renters - 50 or more (%)
Housing units in structures - Renters - Mobile home (%)
Housing units in structures - Renters - Boat, RV, van, etc. (%)
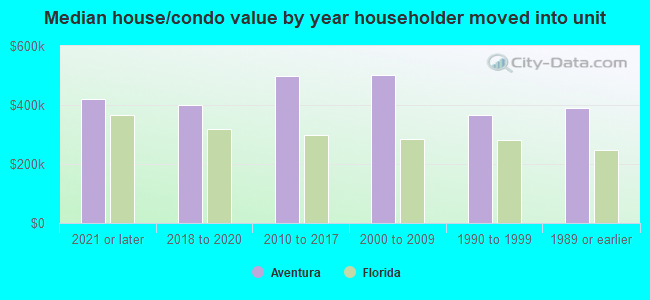
House/condo owner moved in on average (years ago)
Renter moved in on average (years ago)
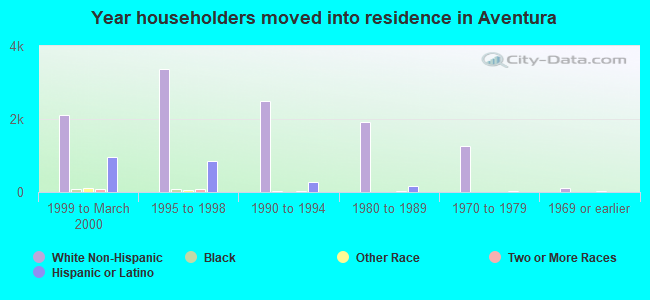
Year householder moved into unit - Moved in 1999 to March 2000 (%)
Year householder moved into unit - Moved in 1999 to March 2000 (%) - White
Year householder moved into unit - Moved in 1999 to March 2000 (%) - Black or African American
Year householder moved into unit - Moved in 1999 to March 2000 (%) - Asian
Year householder moved into unit - Moved in 1999 to March 2000 (%) - Hispanic or Latino
Year householder moved into unit - Moved in 1999 to March 2000 (%) - American Indian and Alaska Native
Year householder moved into unit - Moved in 1999 to March 2000 (%) - Multirace
Year householder moved into unit - Moved in 1999 to March 2000 (%) - Other Race
Year householder moved into unit - Moved in 1995 to 1998 (%)
Year householder moved into unit - Moved in 1995 to 1998 (%) - White
Year householder moved into unit - Moved in 1995 to 1998 (%) - Black or African American
Year householder moved into unit - Moved in 1995 to 1998 (%) - Asian
Year householder moved into unit - Moved in 1995 to 1998 (%) - Hispanic or Latino
Year householder moved into unit - Moved in 1995 to 1998 (%) - American Indian and Alaska Native
Year householder moved into unit - Moved in 1995 to 1998 (%) - Multirace
Year householder moved into unit - Moved in 1995 to 1998 (%) - Other Race
Year householder moved into unit - Moved in 1990 to 1994 (%)
Year householder moved into unit - Moved in 1990 to 1994 (%) - White
Year householder moved into unit - Moved in 1990 to 1994 (%) - Black or African American
Year householder moved into unit - Moved in 1990 to 1994 (%) - Asian
Year householder moved into unit - Moved in 1990 to 1994 (%) - Hispanic or Latino
Year householder moved into unit - Moved in 1990 to 1994 (%) - American Indian and Alaska Native
Year householder moved into unit - Moved in 1990 to 1994 (%) - Multirace
Year householder moved into unit - Moved in 1990 to 1994 (%) - Other Race
Year householder moved into unit - Moved in 1980 to 1989 (%)
Year householder moved into unit - Moved in 1980 to 1989 (%) - White
Year householder moved into unit - Moved in 1980 to 1989 (%) - Black or African American
Year householder moved into unit - Moved in 1980 to 1989 (%) - Asian
Year householder moved into unit - Moved in 1980 to 1989 (%) - Hispanic or Latino
Year householder moved into unit - Moved in 1980 to 1989 (%) - American Indian and Alaska Native
Year householder moved into unit - Moved in 1980 to 1989 (%) - Multirace
Year householder moved into unit - Moved in 1980 to 1989 (%) - Other Race
Year householder moved into unit - Moved in 1970 to 1979 (%)
Year householder moved into unit - Moved in 1970 to 1979 (%) - White
Year householder moved into unit - Moved in 1970 to 1979 (%) - Black or African American
Year householder moved into unit - Moved in 1970 to 1979 (%) - Asian
Year householder moved into unit - Moved in 1970 to 1979 (%) - Hispanic or Latino
Year householder moved into unit - Moved in 1970 to 1979 (%) - American Indian and Alaska Native
Year householder moved into unit - Moved in 1970 to 1979 (%) - Multirace
Year householder moved into unit - Moved in 1970 to 1979 (%) - Other Race
Year householder moved into unit - Moved in 1969 or earlier (%)
Year householder moved into unit - Moved in 1969 or earlier (%) - White
Year householder moved into unit - Moved in 1969 or earlier (%) - Black or African American
Year householder moved into unit - Moved in 1969 or earlier (%) - Asian
Year householder moved into unit - Moved in 1969 or earlier (%) - Hispanic or Latino
Year householder moved into unit - Moved in 1969 or earlier (%) - American Indian and Alaska Native
Year householder moved into unit - Moved in 1969 or earlier (%) - Multirace
Year householder moved into unit - Moved in 1969 or earlier (%) - Other Race
Housing units lacking complete plumbing facilities (%)
Housing units lacking complete kitchen facilities (%)
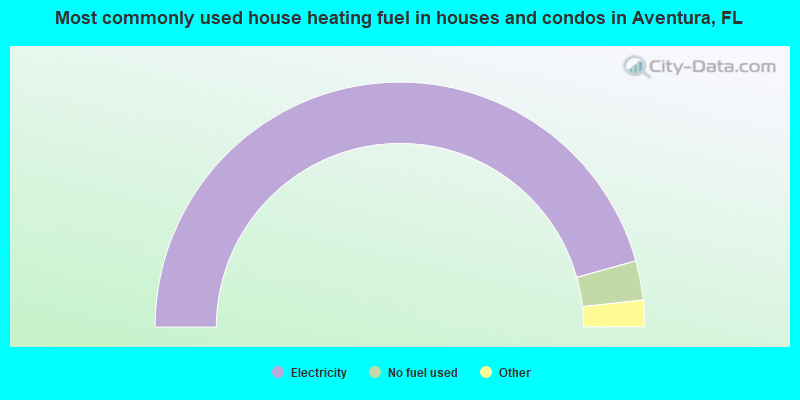
House heating fuel used in houses and condos - Utility gas (%)
House heating fuel used in houses and condos - Bottled, tank, or LP gas (%)
House heating fuel used in houses and condos - Electricity (%)
House heating fuel used in houses and condos - Fuel oil, kerosene, etc. (%)
House heating fuel used in houses and condos - Coal or coke (%)
House heating fuel used in houses and condos - Wood (%)
House heating fuel used in houses and condos - Solar energy (%)
House heating fuel used in houses and condos - Other fuel (%)
House heating fuel used in houses and condos - No fuel used (%)
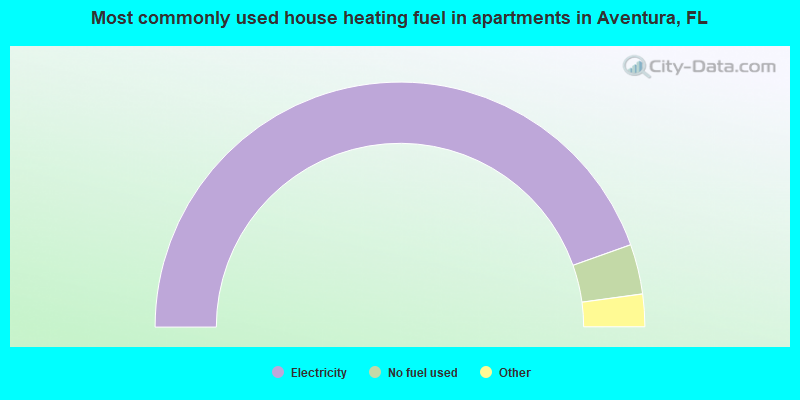
House heating fuel used in apartments - Utility gas (%)
House heating fuel used in apartments - Bottled, tank, or LP gas (%)
House heating fuel used in apartments - Electricity (%)
House heating fuel used in apartments - Fuel oil, kerosene, etc. (%)
House heating fuel used in apartments - Coal or coke (%)
House heating fuel used in apartments - Wood (%)
House heating fuel used in apartments - Solar energy (%)
House heating fuel used in apartments - Other fuel (%)
House heating fuel used in apartments - No fuel used (%)
Latest news about housing in Aventura, FL collected exclusively by city-data.com from local newspapers, TV, and radio stations
Median year house/condo built: 1987Median year apartment built: 1990Household type by relationship:
Households: 39,408
Male householders: 9,357 (2,494 living alone ), Female householders: 8,946 (4,514 living alone )8,138 spouses (8,037 opposite-sex spouses ), 933 unmarried partners , (871 opposite-sex unmarried partners ), 9,615 children (9,322 natural , 52 adopted , 239 stepchildren ), 321 grandchildren , 332 brothers or sisters , 757 parents , 0 foster children , 245 other relatives , 539 non-relatives In group quarters: 220
Size of family households: 5,784 2-persons , 2,602 3-persons , 1,556 4-persons , 494 5-persons , 115 6-persons , 7 7-or-more-persons .
Size of nonfamily households: 7,511 1-person , 934 2-persons , 54 3-persons .
5,189 married couples with children. single-parent households (565 men , 929 women ).
32.3% of residents of Aventura speak English at home. of residents speak Spanish at home (64% speak English very well , 25% speak English well , 8% speak English not well , 4% don't speak English at all ).of residents speak other Indo-European language at home (66% speak English very well , 23% speak English well , 10% speak English not well , 1% don't speak English at all ).of residents speak Asian or Pacific Island language at home (72% speak English very well , 10% speak English well , 13% speak English not well , 6% don't speak English at all ).of residents speak other language at home (70% speak English very well , 27% speak English well , 2% speak English not well ).
Foreign born population: 20,345 (51.6%)of them are naturalized citizens )
Median number of rooms in houses and condos:
Median number of rooms in apartments
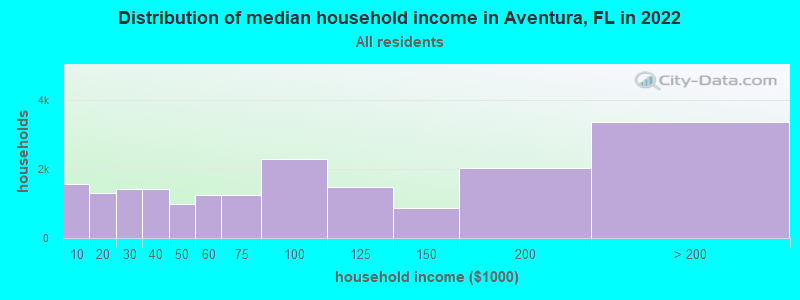
Aventura, FL household income distribution 1,578 Less than $10,0001,300 $10,000 to $19,9991,435 $20,000 to $29,9991,434 $30,000 to $39,999983 $40,000 to $49,9991,240 $50,000 to $59,9991,244 $60,000 to $74,9992,302 $75,000 to $99,9991,491 $100,000 to $124,999859 $125,000 to $149,9992,039 $150,000 to $199,9993,365 $200,000 or more
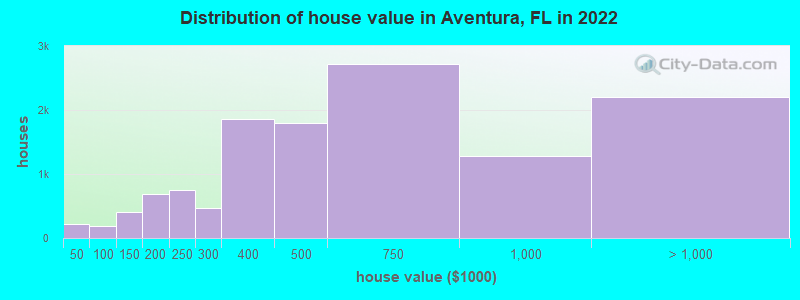
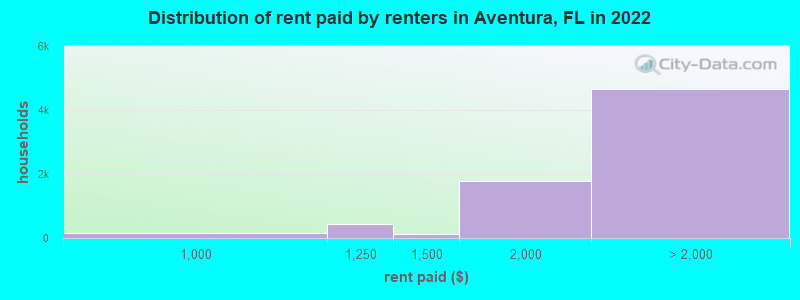
Home value of owner - occupied houses in 2022 in Aventura, FL 24 Less than $10,00017 $10,000 to $14,99936 $20,000 to $24,99991 $25,000 to $29,99940 $30,000 to $34,99913 $40,000 to $49,99916 $60,000 to $69,99969 $70,000 to $79,99932 $80,000 to $89,99951 $90,000 to $99,999131 $100,000 to $124,999266 $125,000 to $149,999469 $150,000 to $174,999219 $175,000 to $199,999752 $200,000 to $249,999470 $250,000 to $299,9991,866 $300,000 to $399,9991,794 $400,000 to $499,9992,719 $500,000 to $749,9991,289 $750,000 to $999,9991,279 $1,000,000 to $1,499,999452 $1,500,000 to $1,999,999463 $2,000,000 or moreRent paid by renters in 2022 in Aventura, FL 22 $350 to $39940 $650 to $69939 $800 to $899147 $900 to $999429 $1,000 to $1,249126 $1,250 to $1,4991,769 $1,500 to $1,9991,807 $2,000 to $2,4991,329 $2,500 to $2,999287 $3,000 to $3,499760 $3,500 or more480 No cash rent
Percentage of workers working in this county: 83.5%Number of people working at home: 5,429 (31.3% of all workers )
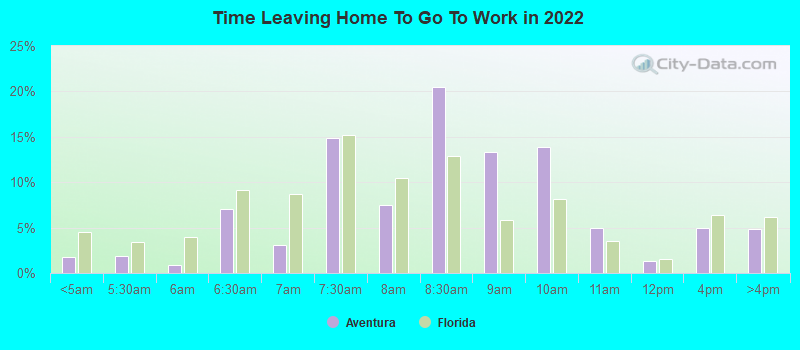
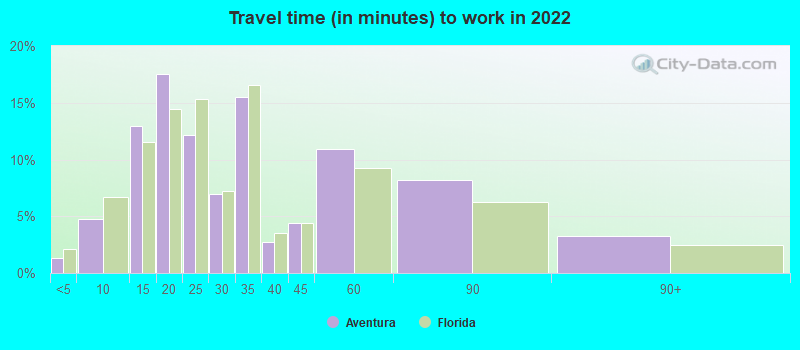
Travel time to work (commute)
Less than 5 minutes: 765 to 9 minutes: 88010 to 14 minutes: 1,84715 to 19 minutes: 1,98220 to 24 minutes: 1,62425 to 29 minutes: 62030 to 34 minutes: 1,49835 to 39 minutes: 67840 to 44 minutes: 56545 to 59 minutes: 2,09960 to 89 minutes: 1,00390 or more minutes: 176
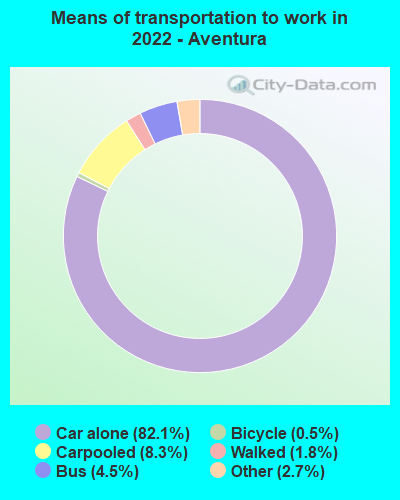
Means of transportation to work:
Drove a car alone: 16,181 (64.7%)Carpooled: 1,831 (7.3%)Bus : 842 (3.4%)Subway or elevated rail : 27 (0.1%)Long-distance train or commuter rail : 11 (0.0%)Light rail, streetcar or trolley : 12 (0.0%)Taxi: 673 (2.7%)Bicycle: 116 (0.5%)Walked: 413 (1.7%)Worked at home: 5,429 (21.7%)
Unemployment by race in 2022
Unemployment rate for White non-Hispanic residents 2.4% Males3.0% FemalesUnemployment rate for Black residents 6.6% FemalesUnemployment rate for Asian residents 7.7% Males7.7% FemalesUnemployment rate for other race residents 12.9% Males1.7% FemalesUnemployment rate for two or more race residents 0.8% Males7.7% FemalesUnemployment rate for Hispanic or Latino residents 0.6% Males3.3% Females
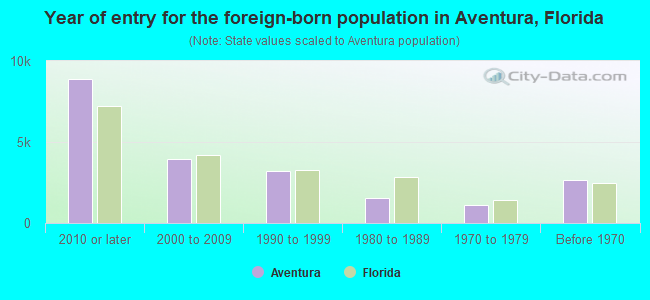
Year of entry for the foreign-born population in Aventura, Florida
8,860 2010 or later 3,978 2000 to 2009 3,205 1990 to 1999 1,558 1980 to 1989 1,091 1970 to 1979 2,664 Before 1970
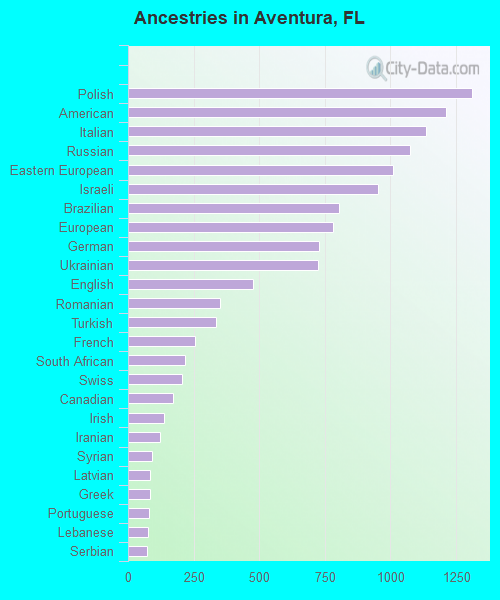
First ancestries reported:
Polish: 1,310 (5.4%)
American: 1,213 (5.0%)
Italian: 1,137 (4.7%)
Russian: 1,074 (4.4%)
Eastern European: 1,008 (4.1%)
Israeli: 952 (3.9%)
Brazilian: 805 (3.3%)
European: 781 (3.2%)
German: 727 (3.0%)
Ukrainian: 724 (3.0%)
English: 476 (2.0%)
Romanian: 352 (1.4%)
Turkish: 334 (1.4%)
French: 256 (1.1%)
South African: 216 (0.9%)
Swiss: 207 (0.9%)
Canadian: 170 (0.7%)
Irish: 137 (0.6%)
Iranian: 122 (0.5%)
Syrian: 90 (0.4%)
Latvian: 83 (0.3%)
Greek: 82 (0.3%)
Portuguese: 80 (0.3%)
Lebanese: 76 (0.3%)
Serbian: 74 (0.3%)
Hungarian: 67 (0.3%)
Austrian: 66 (0.3%)
Swedish: 66 (0.3%)
Moroccan: 57 (0.2%)
Trinidadian and Tobagonian: 51 (0.2%)
Egyptian: 36 (0.1%)
Haitian: 35 (0.1%)
Lithuanian: 34 (0.1%)
Iraqi: 31 (0.1%)
Scottish: 30 (0.1%)
Cypriot: 29 (0.1%)
Bulgarian: 27 (0.1%)
Scotch-Irish: 26 (0.1%)
Northern European: 25 (0.1%)
Slovene: 24 (0.10%)
Dutch: 24 (0.10%)
Welsh: 22 (0.09%)
Afghan: 22 (0.09%)
Australian: 22 (0.09%)
African: 16 (0.07%)
French Canadian: 16 (0.07%)
Norwegian: 15 (0.06%)
Croatian: 14 (0.06%)
Yugoslavian: 14 (0.06%)
Jordanian: 11 (0.05%)
Danish: 10 (0.04%)
British: 9 (0.04%)
Palestinian: 9 (0.04%)
Jamaican: 5 (0.02%)
Slovak: 4 (0.02%)
Most common places of birth for foreign-born residents (%): Colombia Aventura:
19.0% (3,861)Florida:
6.5% (298,669)
Venezuela Aventura:
13.8% (2,798)Florida:
5.7% (262,042)
Brazil Aventura:
8.1% (1,642)Florida:
2.7% (122,906)
Cuba Aventura:
6.9% (1,397)Florida:
22.0% (1,006,576)
Argentina Aventura:
6.4% (1,308)Florida:
1.3% (57,263)
Peru Aventura:
5.1% (1,045)Florida:
2.1% (96,693)
Israel Aventura:
4.4% (889)Florida:
0.3% (14,535)
Mexico Aventura:
3.4% (696)Florida:
5.6% (257,152)
Russia Aventura:
2.5% (511)Florida:
0.7% (31,076)
South Africa Aventura:
2.0% (413)Florida:
0.2% (11,243)
Canada Aventura:
2.0% (413)Florida:
2.4% (109,132)
Panama Aventura:
2.0% (409)Florida:
0.5% (22,972)
Ukraine Aventura:
1.8% (368)Florida:
0.5% (21,886)
Chile Aventura:
1.7% (348)Florida:
0.5% (22,715)
Germany Aventura:
1.6% (326)Florida:
1.2% (54,272)
Place of birth for U.S.-born residents:
This state: 7,755Other state: 10,338Northeast: 7,607Midwest: 1,227South: 808West: 717 88.2% of Aventura residents lived in the same house 1 years ago.
Out of people who lived in different houses, 35.4% lived in this county.
Out of people who lived in different counties, 33.0% lived in Florida.
Aventura:
88.2%State average:
86.3%
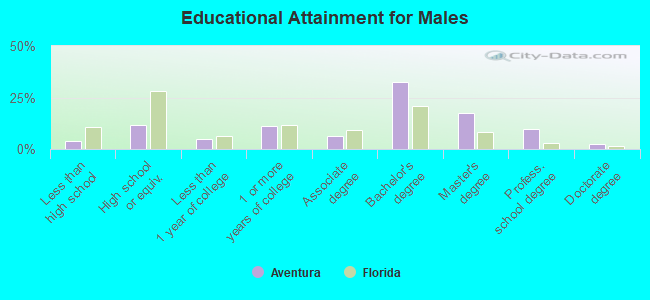
Education attainment for males 25 years and older:
No schooling: 126Nursery to 4th grade: 185th and 6th grade: 387th and 8th grade: 09th grade: 1910th grade: 5211th grade: 3012th grade, no diploma: 258High school graduate (or equivalency): 1,610Less than 1 year of college: 682Some college more than 1 year, no degree: 1,521Associate degree: 891Bachelor's degree: 4,511Master's degree: 2,416Professional school degree: 1,357Doctorate degree: 305
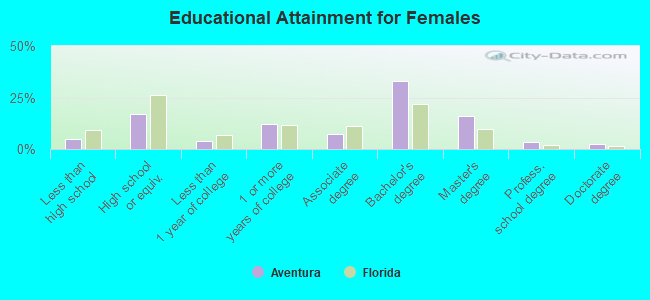
Education attainment for females 25 years and older:
No schooling: 261Nursery to 4th grade: 165th and 6th grade: 407th and 8th grade: 879th grade: 010th grade: 6111th grade: 8812th grade, no diploma: 282High school graduate (or equivalency): 2,933Less than 1 year of college: 641Some college more than 1 year, no degree: 2,071Associate degree: 1,236Bachelor's degree: 5,703Master's degree: 2,750Professional school degree: 613Doctorate degree: 418
Housing units in structures:
One, detached: 1,728One, attached: 1,003Two: 1373 or 4: 1375 to 9: 34310 to 19: 41420 to 49: 2,02250 or more: 23,164Mobile homes: 68Housing units lacking complete kitchen facilities in 2022: 0.6%House/condo owner moved in on average 8 years ago
Renter moved in on average 1 years ago
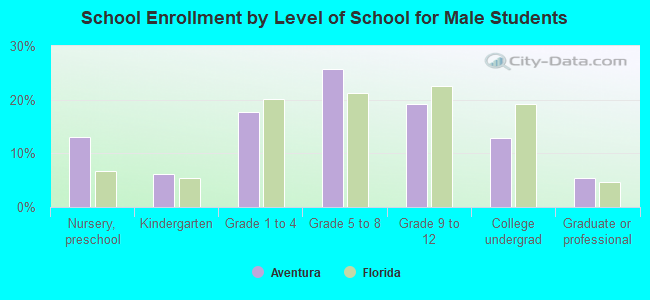
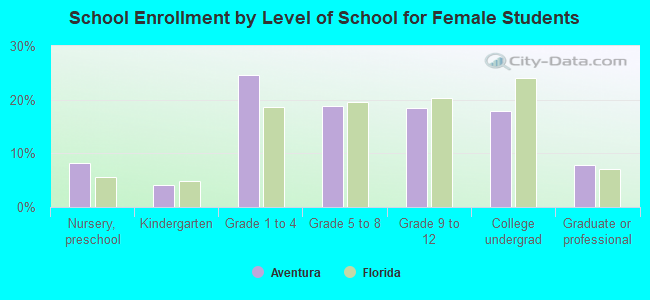
Private vs. public school enrollment:
Students in private schools in grades 1 to 8 (elementary and middle school): 645 Students in private schools in grades 9 to 12 (high school): 555 Students in private undergraduate colleges: 361