Avilla, IN (Indiana) Houses and Residents
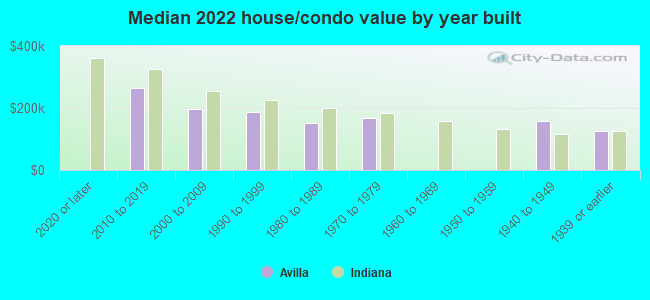
| Avilla: | $174,144 |
| Indiana: | $208,700 |
Total population: 2,411 (Urban population: 0, Rural population: 2,039 (20 farm, 2,019 nonfarm))
Houses: 1,102 (983 occupied: 776 owner occupied, 217 renter occupied)
| % of renters here: | 22% |
| State: | 29% |
Housing density: 806 houses/condos per square mile
Median price asked for vacant for-sale houses and condos in 2022: $103,766.
Median contract rent in 2022: $571 (lower quartile is $481, upper quartile is $656)
Median rent asked for vacant for-rent units in 2022: $1,115
Median gross rent in Avilla, IN in 2022: $686
Housing units in Avilla with a mortgage: 601 (48 second mortgage, 0 home equity loan, 50 both second mortgage and home equity loan)
Houses without a mortgage: 0
Median household income for houses/condos with a mortgage: $93,179
Median household income for apartments without a mortgage: $51,133
Median monthly housing costs: $862
Compare current foreclosures near Avilla, IN:
| Photo | Address | Area | Beds / Baths | Price | Details |
|---|---|---|---|---|---|

|
#1
E Baseline Rd
Avilla, IN 46710
|
1,457 sq. feet
|
1 baths 3 beds |
show details | |

|
#2
E Baseline Rd
Avilla, IN 46710
|
- sq. feet
|
- baths - beds |
show details | |

|
#3
Autumn Hills Dr Lot 66
Avilla, IN 46710
|
- sq. feet
|
- baths - beds |
show details | |

|
#4
Dominic St
Avilla, IN 46710
|
- sq. feet
|
- baths - beds |
show details | |

|
#5
Autumn Hills Dr Lot 97
Avilla, IN 46710
|
- sq. feet
|
- baths - beds |
show details | |

|
#6
N Randolph St
Garrett, IN 46738
|
1,388 sq. feet
|
1 baths 3 beds |
$68,900
|
show details |

|
#7
E Beech Ave
Columbia City, IN 46725
|
2,606 sq. feet
|
1 baths 3 beds |
show details | |

|
#8
Kodiak Trl
Auburn, IN 46706
|
1,603 sq. feet
|
3 baths 3 beds |
show details | |

|
#9
N Mulberry St
Churubusco, IN 46723
|
1,184 sq. feet
|
1 baths 3 beds |
show details | |

|
#10
Wellingham Ct
Fort Wayne, IN 46845
|
1,986 sq. feet
|
2 baths 3 beds |
show details |
| Photo | Address | Area | Beds / Baths | Price | Details |
|---|---|---|---|---|---|

|
#11
Broken Oak Rd
Fort Wayne, IN 46818
|
1,237 sq. feet
|
2 baths 3 beds |
show details | |

|
#12
S 755 E
Wolcottville, IN 46795
|
1,352 sq. feet
|
2 baths 3 beds |
show details | |

|
#13
W Us Highway 6
Wawaka, IN 46794
|
1,680 sq. feet
|
2 baths 4 beds |
show details | |

|
#14
Westwind Ct
Fort Wayne, IN 46845
|
1,720 sq. feet
|
2 baths 3 beds |
show details | |

|
#15
S 400 E
Wolcottville, IN 46795
|
1,973 sq. feet
|
1 baths 4 beds |
show details | |

|
#16
Westwind Ct
Fort Wayne, IN 46845
|
1,938 sq. feet
|
2 baths 4 beds |
show details | |

|
#17
Cedar Lake Dr
Fort Wayne, IN 46845
|
1,344 sq. feet
|
1 baths 4 beds |
show details | |

|
#18
Garman Rd
Leo, IN 46765
|
1,832 sq. feet
|
1 baths 3 beds |
show details | |

|
#19
W River Dr
Wawaka, IN 46794
|
2,128 sq. feet
|
1 baths 4 beds |
show details | |

|
#20
Southway Dr
Fort Wayne, IN 46845
|
1,288 sq. feet
|
2 baths 3 beds |
show details |
| Photo | Address | Area | Beds / Baths | Price | Details |
|---|---|---|---|---|---|

|
#21
Brightwood Ct
Fort Wayne, IN 46845
|
2,937 sq. feet
|
2 baths 4 beds |
show details | |

|
#22
Rabus Dr
Fort Wayne, IN 46825
|
1,730 sq. feet
|
2 baths 3 beds |
show details | |

|
#23
S 200 E
Wolcottville, IN 46795
|
720 sq. feet
|
1 baths 2 beds |
show details | |

|
#24
W County Line Rd
Wolcottville, IN 46795
|
1,611 sq. feet
|
1 baths 3 beds |
show details | |

|
#25
S 1025 W
Hudson, IN 46747
|
2,074 sq. feet
|
2 baths 5 beds |
show details | |

|
#26
Fox Valley Run
Fort Wayne, IN 46845
|
1,863 sq. feet
|
2 baths 3 beds |
show details | |

|
#27
Us Highway 33 N
Churubusco, IN 46723
|
1,805 sq. feet
|
2 baths 3 beds |
show details | |

|
#28
Pheasant Run Ct
Auburn, IN 46706
|
1,140 sq. feet
|
2 baths 3 beds |
show details | |

|
#29
Hidden Creek Dr
Auburn, IN 46706
|
1,390 sq. feet
|
2 baths 3 beds |
show details | |

|
#30
Kelly Street Ext
Rome City, IN 46784
|
1,424 sq. feet
|
1 baths 2 beds |
show details |
| Photo | Address | Area | Beds / Baths | Price | Details |
|---|---|---|---|---|---|

|
#31
Hollopeter Rd
Leo, IN 46765
|
2,290 sq. feet
|
2 baths 4 beds |
show details | |

|
#32
Spring Beach Dr
Rome City, IN 46784
|
720 sq. feet
|
1 baths 1 beds |
show details | |

|
#33
Peneton St
Waterloo, IN 46793
|
880 sq. feet
|
1 baths 2 beds |
show details | |

|
#34
Flowing Brook Dr
Fort Wayne, IN 46818
|
1,450 sq. feet
|
2 baths 3 beds |
show details | |

|
#35
Fox Valley Run
Fort Wayne, IN 46845
|
2,209 sq. feet
|
2 baths 4 beds |
show details | |

|
#36
Wandering Way
Fort Wayne, IN 46818
|
1,723 sq. feet
|
2 baths 3 beds |
show details | |

|
#37
Sonoma Dr
Fort Wayne, IN 46818
|
2,400 sq. feet
|
2 baths 3 beds |
show details | |

|
#38
Winding Vine Run
Fort Wayne, IN 46845
|
2,194 sq. feet
|
2 baths 3 beds |
show details | |

|
#39
W 100 N
Albion, IN 46701
|
1,728 sq. feet
|
1 baths 3 beds |
show details | |

|
#40
Pathfinder Cv
Fort Wayne, IN 46845
|
3,347 sq. feet
|
3 baths 4 beds |
show details |
| Photo | Address | Area | Beds / Baths | Price | Details |
|---|---|---|---|---|---|

|
#41
Lions Psge
Leo, IN 46765
|
2,792 sq. feet
|
3 baths 4 beds |
show details | |

|
#42
Bluff Pointe Way
Fort Wayne, IN 46845
|
2,103 sq. feet
|
3 baths 4 beds |
show details | |

|
#43
Pellston Ct
Fort Wayne, IN 46825
|
1,447 sq. feet
|
2 baths 3 beds |
show details | |

|
#44
James Dr
Leo, IN 46765
|
1,584 sq. feet
|
1 baths 3 beds |
show details | |

|
#45
Calera Dr
Fort Wayne, IN 46818
|
1,264 sq. feet
|
2 baths 3 beds |
show details | |

|
#46
High Point Run
Fort Wayne, IN 46825
|
1,280 sq. feet
|
1 baths 3 beds |
show details | |

|
#47
Bellevue Dr
Fort Wayne, IN 46825
|
2,100 sq. feet
|
1 baths 4 beds |
show details | |

|
#48
Beechmont Dr
Fort Wayne, IN 46825
|
2,072 sq. feet
|
2 baths 2 beds |
show details | |

|
#49
W 625 S
Wolcottville, IN 46795
|
1,740 sq. feet
|
2 baths 3 beds |
show details | |

|
Check over 1 million property listings on Foreclosure.com!
|
browse all offers | |||

Latest news about housing in Avilla, IN collected exclusively by city-data.com from local newspapers, TV, and radio stations

 | Considering a move to the Warsaw area in Indiana (13 replies) |
| Indiana bank ratings (7 replies) |
| Special places, hidden gems... (27 replies) |
| good schoold district in Fort wayne (2 replies) |

Median year apartment built: 1988
Household type by relationship:
Households: 2,721- Male householders: 415 (105 living alone), Female householders: 558 (132 living alone)
488 spouses (482 opposite-sex spouses), 129 unmarried partners, (129 opposite-sex unmarried partners), 811 children (753 natural, 6 adopted, 52 stepchildren), 24 grandchildren, 22 brothers or sisters, 20 parents, 0 foster children, 40 other relatives, 92 non-relatives
- In group quarters: 116
Size of family households: 258 2-persons, 106 3-persons, 212 4-persons, 54 5-persons, 11 6-persons, 6 7-or-more-persons.
Size of nonfamily households: 244 1-person, 58 2-persons, 34 3-persons.
353 married couples with children.
240 single-parent households (64 men, 176 women).
98.7% of residents of Avilla speak English at home.
0.2% of residents speak other Indo-European language at home (100% speak English very well).
Foreign born population: 14 (0.5%)
(50.0% of them are naturalized citizens)
| Here: | 6.0 |
| State: | 6.6 |
| Here: | 4.0 |
| State: | 4.3 |
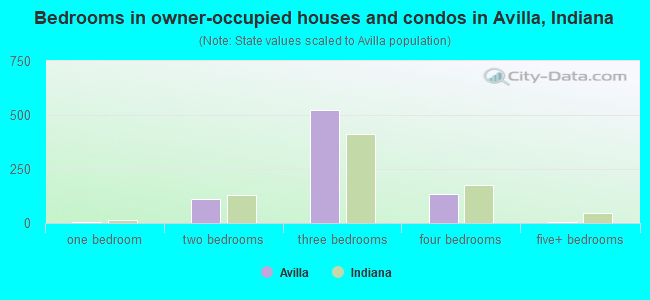
- Bedrooms in owner-occupied houses and condos in Avilla, Indiana
- 0no bedroom
- 51 bedroom
- 1102 bedrooms
- 5253 bedrooms
- 1344 bedrooms
- 35+ bedrooms
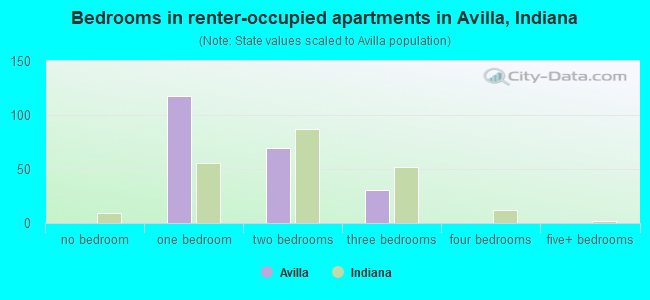
- Bedrooms in renter-occupied apartments in Avilla, Indiana
- 0no bedroom
- 1181 bedroom
- 692 bedrooms
- 313 bedrooms
- 04 bedrooms
- 05+ bedrooms
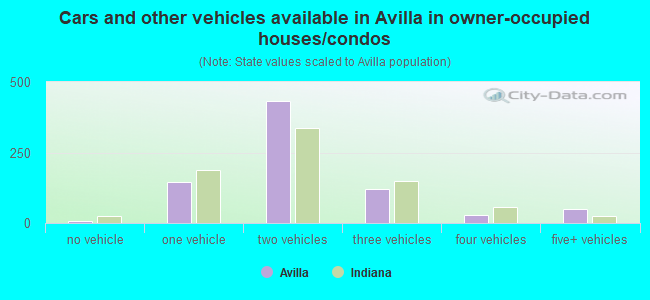
- Cars and other vehicles available in Avilla in owner-occupied houses/condos
- 6no vehicle
- 1441 vehicle
- 4322 vehicles
- 1193 vehicles
- 274 vehicles
- 495+ vehicles
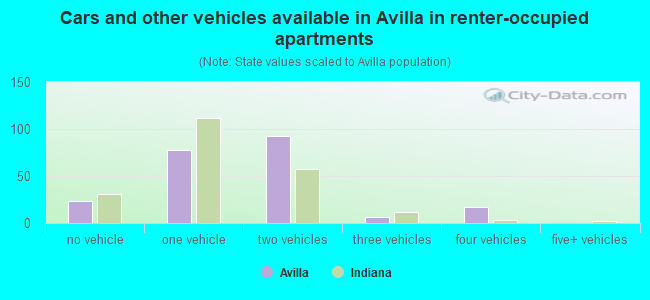
- Cars and other vehicles available in Avilla in renter-occupied apartments
- 23no vehicle
- 781 vehicle
- 932 vehicles
- 63 vehicles
- 174 vehicles
- 05+ vehicles
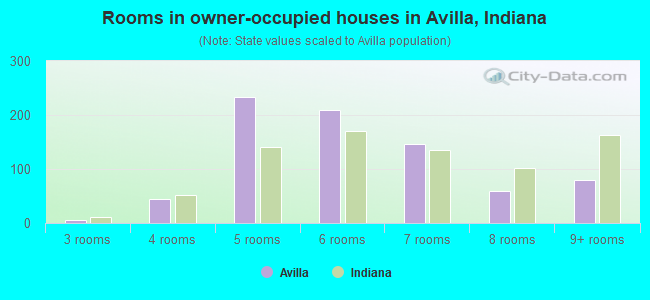
- Rooms in owner-occupied houses in Avilla, Indiana
- 01 room
- 02 rooms
- 53 rooms
- 454 rooms
- 2335 rooms
- 2096 rooms
- 1477 rooms
- 598 rooms
- 799+ rooms
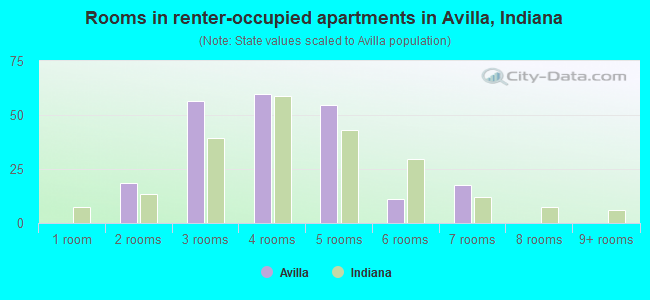
- Rooms in renter-occupied apartments in Avilla, Indiana
- 01 room
- 182 rooms
- 573 rooms
- 604 rooms
- 545 rooms
- 116 rooms
- 177 rooms
- 08 rooms
- 09+ rooms


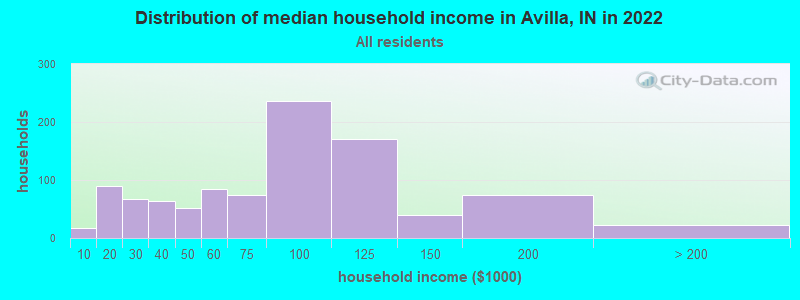
Avilla, IN household income distribution

- 18Less than $10,000
- 90$10,000 to $19,999
- 68$20,000 to $29,999
- 63$30,000 to $39,999
- 52$40,000 to $49,999
- 85$50,000 to $59,999
- 75$60,000 to $74,999
- 236$75,000 to $99,999
- 170$100,000 to $124,999
- 39$125,000 to $149,999
- 74$150,000 to $199,999
- 22$200,000 or more
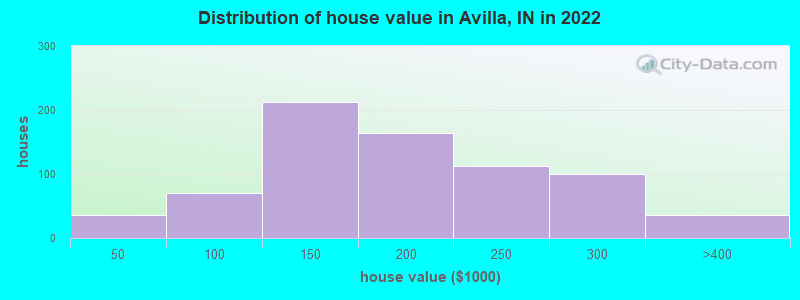
Home value of owner - occupied houses in 2022 in Avilla, IN
-
- 18Less than $10,000
- 6$15,000 to $19,999
- 4$20,000 to $24,999
- 7$35,000 to $39,999
- 45$60,000 to $69,999
- 10$70,000 to $79,999
- 5$80,000 to $89,999
- 8$90,000 to $99,999
- 126$100,000 to $124,999
- 86$125,000 to $149,999
- 72$150,000 to $174,999
- 90$175,000 to $199,999
- 111$200,000 to $249,999
- 99$250,000 to $299,999
- 36$300,000 to $399,999
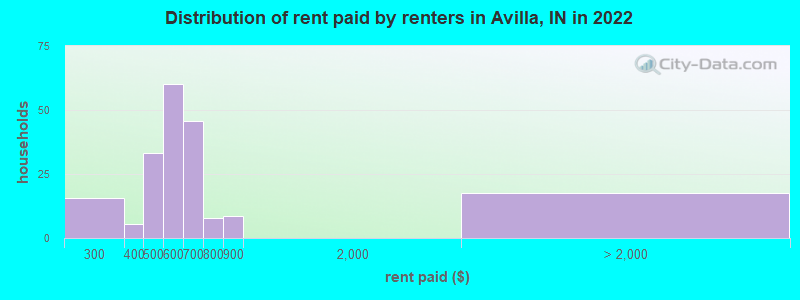
Rent paid by renters in 2022 in Avilla, IN
-
- 15$250 to $299
- 5$350 to $399
- 5$400 to $449
- 28$450 to $499
- 14$500 to $549
- 45$550 to $599
- 23$600 to $649
- 21$650 to $699
- 7$700 to $749
- 8$800 to $899
- 17No cash rent
Percentage of workers working in this county: 57.8%
Number of people working at home: 49 (3.6% of all workers)
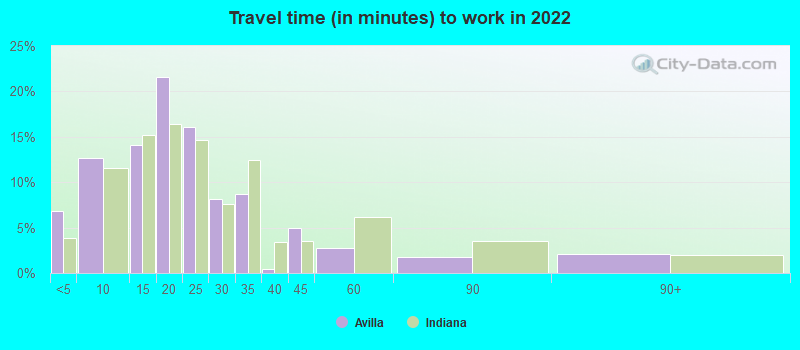
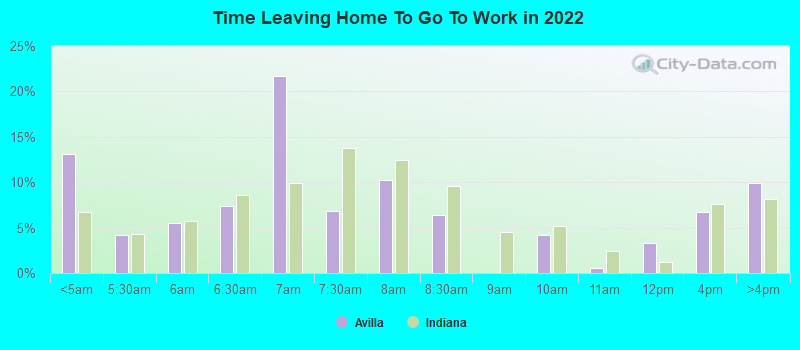
Travel time to work (commute)
- Less than 5 minutes: 80
- 5 to 9 minutes: 54
- 10 to 14 minutes: 194
- 15 to 19 minutes: 271
- 20 to 24 minutes: 124
- 25 to 29 minutes: 118
- 30 to 34 minutes: 113
- 35 to 39 minutes: 25
- 40 to 44 minutes: 53
- 45 to 59 minutes: 181
- 60 to 89 minutes: 58
- 90 or more minutes: 19
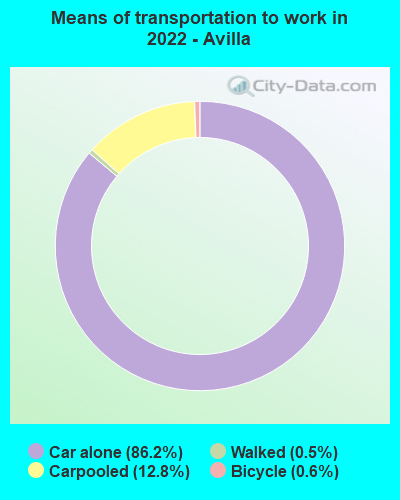
Means of transportation to work:
- Drove a car alone: 1,352 (81.0%)
- Carpooled: 221 (13.2%)
- Bicycle: 10 (0.6%)
- Walked: 7 (0.4%)
- Worked at home: 49 (2.9%)
- Unemployment by race in 2022
- Unemployment rate for White non-Hispanic residents
- 1.6%Males
- Unemployment rate for two or more race residents
- 49.7%Males
- 51.5%Females
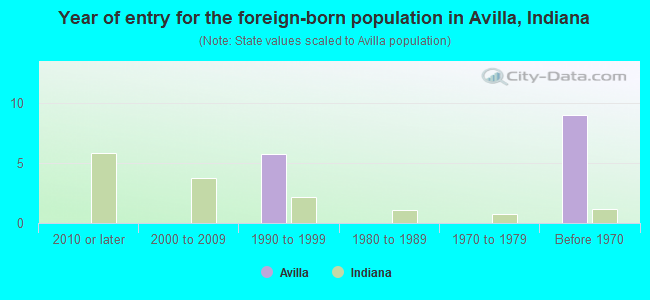
- Year of entry for the foreign-born population in Avilla, Indiana
- 02010 or later
- 02000 to 2009
- 61990 to 1999
- 01980 to 1989
- 01970 to 1979
- 9Before 1970

First ancestries reported:
- European: 331 (27.6%)
- German: 204 (17.0%)
- American: 154 (12.8%)
- English: 150 (12.5%)
- Irish: 140 (11.7%)
- Italian: 19 (1.6%)
- Polish: 19 (1.6%)
- Dutch: 15 (1.2%)
- French: 9 (0.7%)
- Swedish: 9 (0.7%)
- Lithuanian: 7 (0.6%)
- Canadian: 6 (0.5%)
- Hungarian: 6 (0.5%)
- Scottish: 4 (0.3%)
- Pennsylvania German: 2 (0.2%)
Most common places of birth for foreign-born residents (%):
| Avilla: | 42.9% (6) |
| Indiana: | 1.7% (6,439) |
| Avilla: | 42.9% (6) |
| Indiana: | 2.1% (7,834) |
Place of birth for U.S.-born residents:
- This state: 2,279
- Other state: 400
- Northeast: 39
- Midwest: 154
- South: 125
- West: 82
86.1% of Avilla residents lived in the same house 1 years ago.
Out of people who lived in different houses, 30.9% lived in this county.
Out of people who lived in different counties, 89.7% lived in Indiana.
| Avilla: | 86.1% |
| State average: | 87.1% |
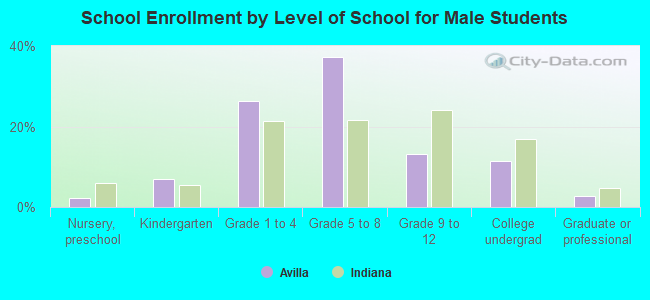
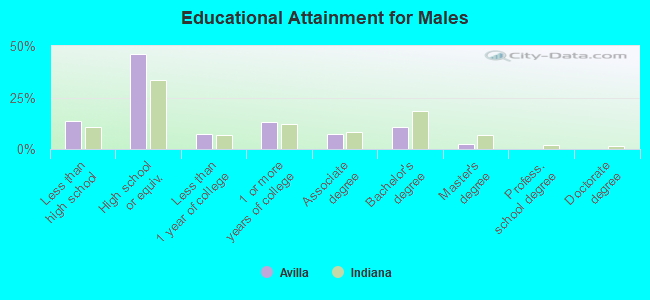
Education attainment for males 25 years and older:
- No schooling: 22
- Nursery to 4th grade: 0
- 5th and 6th grade: 24
- 7th and 8th grade: 29
- 9th grade: 0
- 10th grade: 5
- 11th grade: 6
- 12th grade, no diploma: 30
- High school graduate (or equivalency): 392
- Less than 1 year of college: 62
- Some college more than 1 year, no degree: 110
- Associate degree: 61
- Bachelor's degree: 89
- Master's degree: 21
- Professional school degree: 0
- Doctorate degree: 0
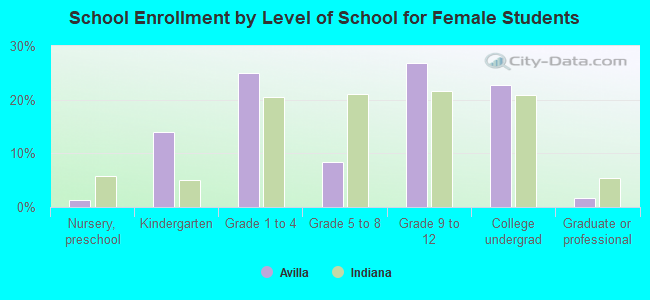
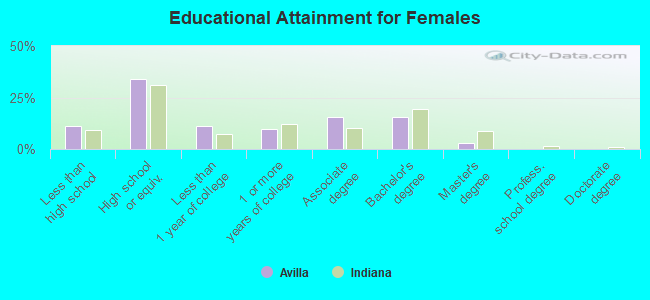
Education attainment for females 25 years and older:
- No schooling: 4
- Nursery to 4th grade: 0
- 5th and 6th grade: 0
- 7th and 8th grade: 21
- 9th grade: 10
- 10th grade: 29
- 11th grade: 32
- 12th grade, no diploma: 9
- High school graduate (or equivalency): 318
- Less than 1 year of college: 103
- Some college more than 1 year, no degree: 92
- Associate degree: 144
- Bachelor's degree: 144
- Master's degree: 26
- Professional school degree: 0
- Doctorate degree: 0


Housing units in structures:
- One, detached: 800
- One, attached: 7
- Two: 59
- 3 or 4: 12
- 5 to 9: 16
- 10 to 19: 45
- 20 to 49: 35
- 50 or more: 17
- Mobile homes: 108
Median worth of mobile homes: $11,413
Housing units lacking complete kitchen facilities in 2022: 1.7%
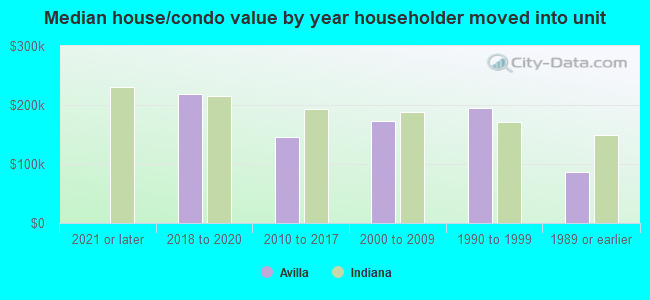
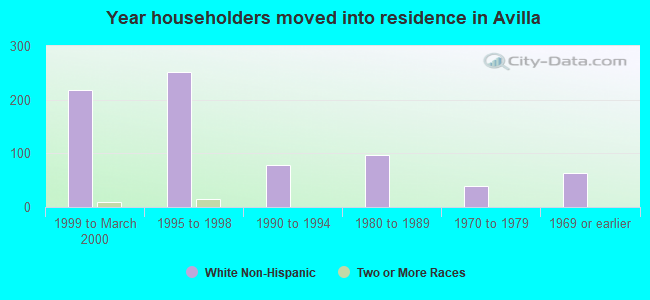
House/condo owner moved in on average 5 years ago
Renter moved in on average 4 years ago
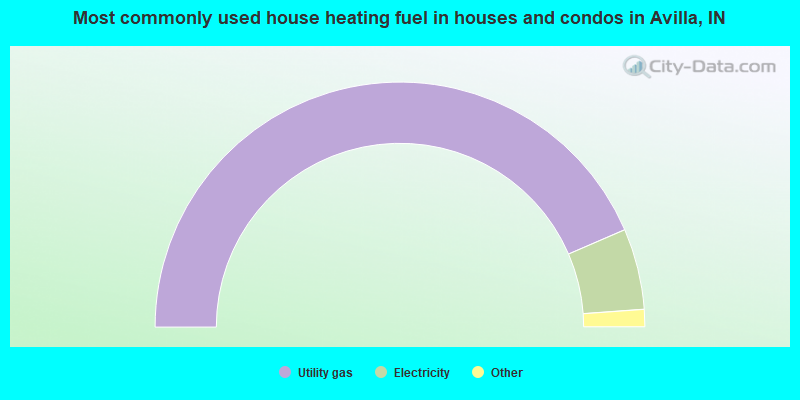
- 87.0%Utility gas
- 10.7%Electricity
- 1.3%Wood
- 0.9%Bottled, tank, or LP gas
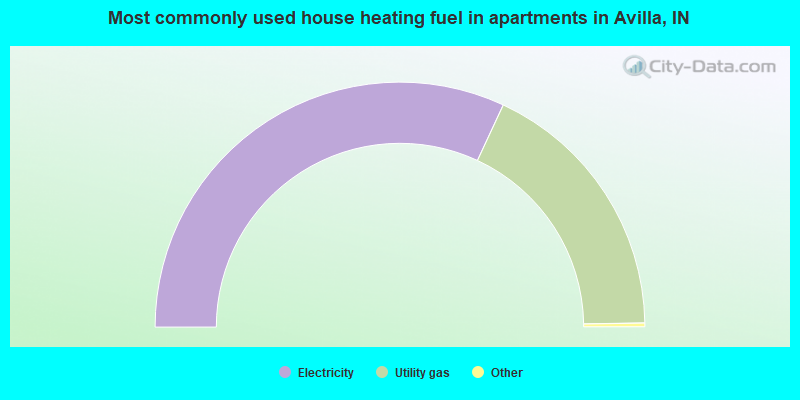
- 64.2%Electricity
- 35.8%Utility gas
Private vs. public school enrollment:
| Here: | 21.1% |
| Indiana: | 14.9% |
| Here: | 0.0% |
| Indiana: | 11.4% |
| Here: | 50.0% |
| Indiana: | 22.3% |