Avon, OH (Ohio) Houses and Residents
Estimated median house or condo value in 2022: $394,239 (it was $177,400 in 2000 )
Avon:
$394,239Ohio:
$204,100
Lower value quartile - upper value quartile: $289,044 - $500,162Total population: 22,302 (Urban population: 8,982, Rural population: 2,464 (65 farm, 2,399 nonfarm ))
Houses: 9,740 (9,269 occupied: 8,077 owner occupied, 1,197 renter occupied )
% of renters here:
13%State:
33%
Housing density: 467 houses/condos per square mile
Median price asked for vacant for-sale houses and condos in 2022 in this county: $147,194.
Median contract rent in 2022: $1,305 (lower quartile is $820, upper quartile is $1,553)
Median rent asked for vacant for-rent units in 2022: $985
Median gross rent in Avon, OH in 2022: $1,333
Housing units in Avon with a mortgage: 5,202 (902 second mortgage, 0 home equity loan, 796 both second mortgage and home equity loan )Houses without a mortgage: 101
Median household income for houses/condos with a mortgage: $181,160
Median household income for apartments without a mortgage: $100,527
Median monthly housing costs: $1,644
Data:
Median house or condo value ($)
Median house or condo value ($ change since 2000)
Median house or condo value ($) - White
Median house or condo value ($) - Black or African American
Median house or condo value ($) - Asian
Median house or condo value ($) - Hispanic or Latino
Median house or condo value ($) - American Indian and Alaska Native
Median house or condo value ($) - Multirace
Median house or condo value ($) - Other Race
Median price asked for mobile homes ($)
Household density (households per square mile)
Mean house or condo value by units in structure - 1, detached ($)
Mean house or condo value by units in structure - 1, attached ($)
Mean house or condo value by units in structure - 2 ($)
Mean house or condo value by units in structure by units in structure - 3 or 4 ($)
Mean house or condo value by units in structure - 5 or more ($)
Mean house or condo value by units in structure - Boat, RV, van, etc. ($)
Mean house or condo value by units in structure - Mobile home ($)
Median contract rent ($)
Median contract rent - Lower quartile ($)
Median contract rent - Upper quartile ($)
Median gross rent ($)
Urban houses (%)
Rural houses (%)
Houses occupied (%)
Houses occupied (% change since 2000)
Houses owner occupied (%)
Houses owner occupied (% change since 2000)
Houses renter occupied (%)
Houses renter occupied (% change since 2000)
Vacant housing units - For rent (%)
Vacant housing units - For rent (% change since 2000)
Vacant housing units - For sale only (%)
Vacant housing units - For sale only (% change since 2000)
Vacant housing units - Rented or sold, not occupied (%)
Vacant housing units - Rented or sold, not occupied (% change since 2000)
Vacant housing units - For seasonal, recreational, or occasional use (%)
Vacant housing units - For seasonal, recreational, or occasional use (% change since 2000)
Vacant housing units - For migrant workers (%)
Vacant housing units - For migrant workers (% change since 2000)
Vacant housing units - Other vacant (%)
Vacant housing units - Other vacant (% change since 2000)
Median monthly housing costs ($)
Median household income for houses/condos with a mortgage ($)
Median household income for houses/condos without a mortgage ($)
Median household income ($)
Median household income ($) - White
Median household income ($) - Black or African American
Median household income ($) - Asian
Median household income ($) - Hispanic or Latino
Median household income ($) - American Indian and Alaska Native
Median household income ($) - Multirace
Median household income ($) - Other Race
Mortgage status - with mortgage (%)
Mortgage status - with second mortgage (%)
Mortgage status - with home equity loan (%)
Mortgage status - with both second mortgage and home equity loan (%)
Mortgage status - without a mortgage (%)
Median year house/condo built
Median year apartment built
Household type by relationship - Male householder living alone (%)
Household type by relationship - Male householder not living alone (%)
Household type by relationship - Female householder living alone (%)
Household type by relationship - Female householder not living alone (%)
Household type by relationship - Opposite-Sex spouse (%)
Household type by relationship - Same-Sex spouse (%)
Household type by relationship - Opposite-Sex unmarried partner (%)
Household type by relationship - Same-Sex unmarried partner (%)
Household type by relationship - In group quarters (%)
Size of family households - 2-person household (%)
Size of family households - 3-person household (%)
Size of family households - 4-person household (%)
Size of family households - 5-person household (%)
Size of family households - 6-person household (%)
Size of family households - 7-or-more-person household (%)
Size of nonfamily households - 1-person household (%)
Size of nonfamily households - 2-person household (%)
Size of nonfamily households - 3-person household (%)
Size of nonfamily households - 4-person household (%)
Size of nonfamily households - 5-person household (%)
Size of nonfamily households - 6-person household (%)
Size of nonfamily households - 7-or-moreperson household (%)
Year house built - Built 2010 or later (%)
Year house built - Built 2000 to 2009 (%)
Year house built - Built 1990 to 1999 (%)
Year house built - Built 1980 to 1989 (%)
Year house built - Built 1970 to 1979 (%)
Year house built - Built 1960 to 1969 (%)
Year house built - Built 1950 to 1959 (%)
Year house built - Built 1940 to 1949 (%)
Year house built - Built 1939 or earlier (%)
Median number of rooms in houses and condos
Median number of rooms in apartments
Median number of bedrooms in owner occupied houses
Mean number of bedrooms in owner occupied houses
Median number of bedrooms in renter occupied houses
Mean number of bedrooms in renter occupied houses
Median number of vehichles in owner occupied houses
Mean number of vehichles in owner occupied houses
Median number of vehichles in renter occupied houses
Mean number of vehichles in renter occupied houses
Rooms in owner-occupied houses - 1 room (%)
Rooms in owner-occupied houses - 2 rooms (%)
Rooms in owner-occupied houses - 3 rooms (%)
Rooms in owner-occupied houses - 4 rooms (%)
Rooms in owner-occupied houses - 5 rooms (%)
Rooms in owner-occupied houses - 6 rooms (%)
Rooms in owner-occupied houses - 7 rooms (%)
Rooms in owner-occupied houses - 8 rooms (%)
Rooms in owner-occupied houses - 9+ rooms (%)
Rooms in renter-occupied houses - 1 room (%)
Rooms in renter-occupied houses - 2 rooms (%)
Rooms in renter-occupied houses - 3 rooms (%)
Rooms in renter-occupied houses - 4 rooms (%)
Rooms in renter-occupied houses - 5 rooms (%)
Rooms in renter-occupied houses - 6 rooms (%)
Rooms in renter-occupied houses - 7 rooms (%)
Rooms in renter-occupied houses - 8 rooms (%)
Rooms in renter-occupied houses - 9+ rooms (%)
Bedrooms in owner-occupied houses - no bedrooms (%)
Bedrooms in owner-occupied houses - 1 bedroom (%)
Bedrooms in owner-occupied houses - 2 bedrooms (%)
Bedrooms in owner-occupied houses - 3 bedrooms (%)
Bedrooms in owner-occupied houses - 4 bedrooms (%)
Bedrooms in owner-occupied houses - 5+ bedrooms (%)
Bedrooms in renter-occupied houses - no bedrooms (%)
Bedrooms in renter-occupied houses - 1 bedroom (%)
Bedrooms in renter-occupied houses - 2 bedrooms (%)
Bedrooms in renter-occupied houses - 3 bedrooms (%)
Bedrooms in renter-occupied houses - 4 bedrooms (%)
Bedrooms in renter-occupied houses - 5+ bedrooms (%)
Vehicles available in owner-occupied houses - no vehicle available (%)
Vehicles available in owner-occupied houses - 1 vehicle available(%)
Vehicles available in owner-occupied houses - 2 Vehicles available (%)
Vehicles available in owner-occupied houses - 3 Vehicles available (%)
Vehicles available in owner-occupied houses - 4 Vehicles available (%)
Vehicles available in owner-occupied houses - 5+ Vehicles available (%)
Vehicles available in renter-occupied houses - no vehicle available (%)
Vehicles available in renter-occupied houses - 1 vehicle available (%)
Vehicles available in renter-occupied houses - 2 Vehicles available (%)
Vehicles available in renter-occupied houses - 3 Vehicles available (%)
Vehicles available in renter-occupied houses - 4 Vehicles available (%)
Vehicles available in renter-occupied houses - 5+ Vehicles available (%)
Housing units in structures - 1, detached (%)
Housing units in structures - 1, attached (%)
Housing units in structures - 2 (%)
Housing units in structures - 3 or 4 (%)
Housing units in structures - 5 to 9 (%)
Housing units in structures - 10 to 19 (%)
Housing units in structures - 20 to 49 (%)
Housing units in structures - 50 or more (%)
Housing units in structures - Mobile home (%)
Housing units in structures - Boat, RV, van, etc. (%)
Housing units in structures - Owners - 1, detached (%)
Housing units in structures - Owners - 1, attached (%)
Housing units in structures - Owners - 2 (%)
Housing units in structures - Owners - 3 or 4 (%)
Housing units in structures - Owners - 5 to 9 (%)
Housing units in structures - Owners - 10 to 19 (%)
Housing units in structures - Owners - 20 to 49 (%)
Housing units in structures - Owners - 50 or more (%)
Housing units in structures - Owners - Mobile home (%)
Housing units in structures - Owners - Boat, RV, van, etc. (%)
Housing units in structures - Renters - 1, detached (%)
Housing units in structures - Renters - 1, attached (%)
Housing units in structures - Renters - 2 (%)
Housing units in structures - Renters - 3 or 4 (%)
Housing units in structures - Renters - 5 to 9 (%)
Housing units in structures - Renters - 10 to 19 (%)
Housing units in structures - Renters - 20 to 49 (%)
Housing units in structures - Renters - 50 or more (%)
Housing units in structures - Renters - Mobile home (%)
Housing units in structures - Renters - Boat, RV, van, etc. (%)
House/condo owner moved in on average (years ago)
Renter moved in on average (years ago)
Year householder moved into unit - Moved in 1999 to March 2000 (%)
Year householder moved into unit - Moved in 1999 to March 2000 (%) - White
Year householder moved into unit - Moved in 1999 to March 2000 (%) - Black or African American
Year householder moved into unit - Moved in 1999 to March 2000 (%) - Asian
Year householder moved into unit - Moved in 1999 to March 2000 (%) - Hispanic or Latino
Year householder moved into unit - Moved in 1999 to March 2000 (%) - American Indian and Alaska Native
Year householder moved into unit - Moved in 1999 to March 2000 (%) - Multirace
Year householder moved into unit - Moved in 1999 to March 2000 (%) - Other Race
Year householder moved into unit - Moved in 1995 to 1998 (%)
Year householder moved into unit - Moved in 1995 to 1998 (%) - White
Year householder moved into unit - Moved in 1995 to 1998 (%) - Black or African American
Year householder moved into unit - Moved in 1995 to 1998 (%) - Asian
Year householder moved into unit - Moved in 1995 to 1998 (%) - Hispanic or Latino
Year householder moved into unit - Moved in 1995 to 1998 (%) - American Indian and Alaska Native
Year householder moved into unit - Moved in 1995 to 1998 (%) - Multirace
Year householder moved into unit - Moved in 1995 to 1998 (%) - Other Race
Year householder moved into unit - Moved in 1990 to 1994 (%)
Year householder moved into unit - Moved in 1990 to 1994 (%) - White
Year householder moved into unit - Moved in 1990 to 1994 (%) - Black or African American
Year householder moved into unit - Moved in 1990 to 1994 (%) - Asian
Year householder moved into unit - Moved in 1990 to 1994 (%) - Hispanic or Latino
Year householder moved into unit - Moved in 1990 to 1994 (%) - American Indian and Alaska Native
Year householder moved into unit - Moved in 1990 to 1994 (%) - Multirace
Year householder moved into unit - Moved in 1990 to 1994 (%) - Other Race
Year householder moved into unit - Moved in 1980 to 1989 (%)
Year householder moved into unit - Moved in 1980 to 1989 (%) - White
Year householder moved into unit - Moved in 1980 to 1989 (%) - Black or African American
Year householder moved into unit - Moved in 1980 to 1989 (%) - Asian
Year householder moved into unit - Moved in 1980 to 1989 (%) - Hispanic or Latino
Year householder moved into unit - Moved in 1980 to 1989 (%) - American Indian and Alaska Native
Year householder moved into unit - Moved in 1980 to 1989 (%) - Multirace
Year householder moved into unit - Moved in 1980 to 1989 (%) - Other Race
Year householder moved into unit - Moved in 1970 to 1979 (%)
Year householder moved into unit - Moved in 1970 to 1979 (%) - White
Year householder moved into unit - Moved in 1970 to 1979 (%) - Black or African American
Year householder moved into unit - Moved in 1970 to 1979 (%) - Asian
Year householder moved into unit - Moved in 1970 to 1979 (%) - Hispanic or Latino
Year householder moved into unit - Moved in 1970 to 1979 (%) - American Indian and Alaska Native
Year householder moved into unit - Moved in 1970 to 1979 (%) - Multirace
Year householder moved into unit - Moved in 1970 to 1979 (%) - Other Race
Year householder moved into unit - Moved in 1969 or earlier (%)
Year householder moved into unit - Moved in 1969 or earlier (%) - White
Year householder moved into unit - Moved in 1969 or earlier (%) - Black or African American
Year householder moved into unit - Moved in 1969 or earlier (%) - Asian
Year householder moved into unit - Moved in 1969 or earlier (%) - Hispanic or Latino
Year householder moved into unit - Moved in 1969 or earlier (%) - American Indian and Alaska Native
Year householder moved into unit - Moved in 1969 or earlier (%) - Multirace
Year householder moved into unit - Moved in 1969 or earlier (%) - Other Race
Housing units lacking complete plumbing facilities (%)
Housing units lacking complete kitchen facilities (%)
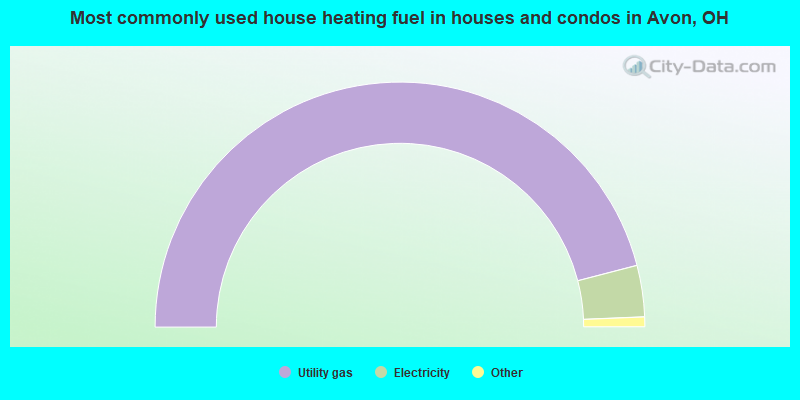
House heating fuel used in houses and condos - Utility gas (%)
House heating fuel used in houses and condos - Bottled, tank, or LP gas (%)
House heating fuel used in houses and condos - Electricity (%)
House heating fuel used in houses and condos - Fuel oil, kerosene, etc. (%)
House heating fuel used in houses and condos - Coal or coke (%)
House heating fuel used in houses and condos - Wood (%)
House heating fuel used in houses and condos - Solar energy (%)
House heating fuel used in houses and condos - Other fuel (%)
House heating fuel used in houses and condos - No fuel used (%)
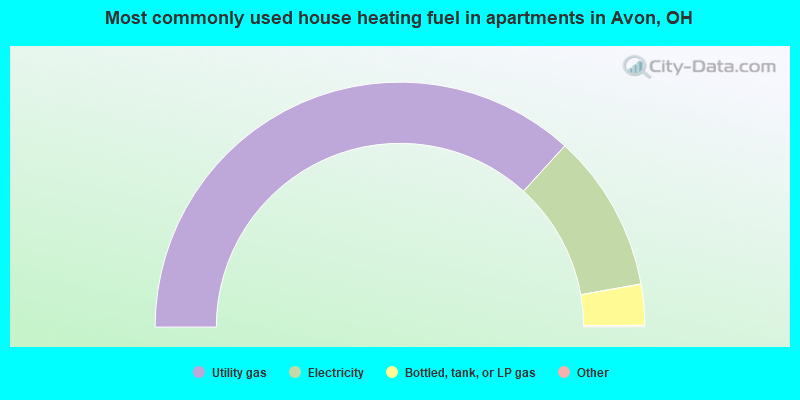
House heating fuel used in apartments - Utility gas (%)
House heating fuel used in apartments - Bottled, tank, or LP gas (%)
House heating fuel used in apartments - Electricity (%)
House heating fuel used in apartments - Fuel oil, kerosene, etc. (%)
House heating fuel used in apartments - Coal or coke (%)
House heating fuel used in apartments - Wood (%)
House heating fuel used in apartments - Solar energy (%)
House heating fuel used in apartments - Other fuel (%)
House heating fuel used in apartments - No fuel used (%)
Latest news about housing in Avon, OH collected exclusively by city-data.com from local newspapers, TV, and radio stations
Median year house/condo built: 2002Median year apartment built: 1995Household type by relationship:
Households: 25,073
Male householders: 4,824 (603 living alone ), Female householders: 4,397 (1,431 living alone )5,866 spouses (5,845 opposite-sex spouses ), 266 unmarried partners , (266 opposite-sex unmarried partners ), 8,663 children (8,197 natural , 51 adopted , 415 stepchildren ), 196 grandchildren , 126 brothers or sisters , 178 parents , 0 foster children , 144 other relatives , 125 non-relatives In group quarters: 282
Size of family households: 2,842 2-persons , 1,323 3-persons , 1,936 4-persons , 618 5-persons , 75 6-persons , 41 7-or-more-persons .
Size of nonfamily households: 2,099 1-person , 262 2-persons .
5,675 married couples with children. single-parent households (188 men , 844 women ).
94.5% of residents of Avon speak English at home. of residents speak Spanish at home (59% speak English very well , 41% speak English well ).of residents speak other Indo-European language at home (92% speak English very well , 3% speak English well , 5% speak English not well ).of residents speak Asian or Pacific Island language at home (73% speak English very well , 17% speak English well , 10% speak English not well ).of residents speak other language at home (100% speak English very well ).
Foreign born population: 741 (3.0%)of them are naturalized citizens )
Median number of rooms in houses and condos:
Median number of rooms in apartments
Avon, OH household income distribution 340 Less than $10,000346 $10,000 to $19,999212 $20,000 to $29,999503 $30,000 to $39,999268 $40,000 to $49,999313 $50,000 to $59,999747 $60,000 to $74,999625 $75,000 to $99,9991,170 $100,000 to $124,999709 $125,000 to $149,9991,447 $150,000 to $199,9992,564 $200,000 or more
Home value of owner - occupied houses in 2022 in Avon, OH 48 Less than $10,00021 $10,000 to $14,99922 $15,000 to $19,99918 $20,000 to $24,99910 $30,000 to $34,99912 $80,000 to $89,999186 $100,000 to $124,999289 $125,000 to $149,999520 $150,000 to $174,999177 $175,000 to $199,999579 $200,000 to $249,999427 $250,000 to $299,9992,783 $300,000 to $399,9992,488 $400,000 to $499,9991,337 $500,000 to $749,999324 $750,000 to $999,99917 $1,000,000 to $1,499,999Rent paid by renters in 2022 in Avon, OH 90 $300 to $34920 $500 to $54915 $700 to $74914 $750 to $799286 $800 to $89943 $1,000 to $1,249331 $1,250 to $1,499254 $1,500 to $1,99971 $2,000 to $2,49985 $2,500 to $2,99983 No cash rent
Percentage of workers working in this county: 54.5%Number of people working at home: 4,080 (32.1% of all workers )
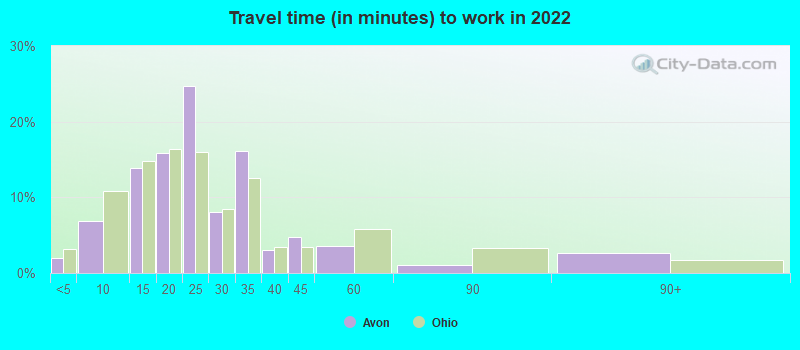
Travel time to work (commute)
Less than 5 minutes: 2505 to 9 minutes: 74510 to 14 minutes: 1,30915 to 19 minutes: 1,13920 to 24 minutes: 1,22425 to 29 minutes: 1,03830 to 34 minutes: 1,94435 to 39 minutes: 46440 to 44 minutes: 25745 to 59 minutes: 50460 to 89 minutes: 47090 or more minutes: 301
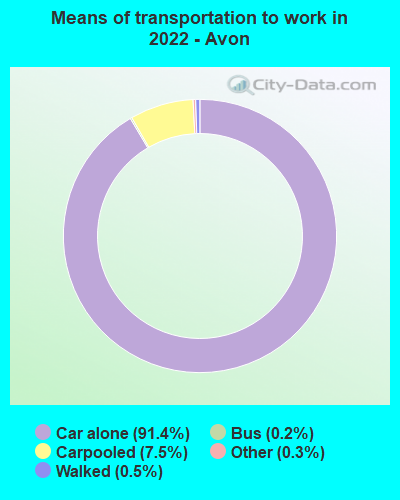
Means of transportation to work:
Drove a car alone: 13,444 (74.4%)Carpooled: 1,011 (5.6%)Bus : 35 (0.2%)Taxi: 37 (0.2%)Walked: 66 (0.4%)Worked at home: 4,080 (22.6%)
Unemployment by race in 2022
Unemployment rate for White non-Hispanic residents 4.0% Males2.6% Females
Year of entry for the foreign-born population in Avon, Ohio
133 2010 or later 270 2000 to 2009 148 1990 to 1999 61 1980 to 1989 51 1970 to 1979 197 Before 1970
First ancestries reported:
German: 2,123 (20.2%)
American: 1,191 (11.3%)
Irish: 776 (7.4%)
Italian: 739 (7.0%)
European: 635 (6.0%)
English: 536 (5.1%)
Slovak: 425 (4.0%)
Polish: 403 (3.8%)
Scottish: 205 (1.9%)
Hungarian: 130 (1.2%)
Croatian: 117 (1.1%)
Lebanese: 92 (0.9%)
Russian: 70 (0.7%)
Palestinian: 56 (0.5%)
Syrian: 40 (0.4%)
French: 40 (0.4%)
British: 37 (0.4%)
Greek: 37 (0.4%)
French Canadian: 34 (0.3%)
Latvian: 32 (0.3%)
Eastern European: 27 (0.3%)
Romanian: 27 (0.3%)
Czechoslovakian: 26 (0.2%)
Welsh: 23 (0.2%)
Slovene: 21 (0.2%)
Portuguese: 18 (0.2%)
Ukrainian: 18 (0.2%)
Northern European: 16 (0.2%)
Austrian: 15 (0.1%)
Czech: 15 (0.1%)
Pennsylvania German: 14 (0.1%)
Swedish: 14 (0.1%)
Macedonian: 13 (0.1%)
Slavic: 11 (0.1%)
Swiss: 10 (0.10%)
African: 1 (0.01%) Most common places of birth for foreign-born residents (%): India Avon:
30.0% (247)Ohio:
11.6% (66,525)
Canada Avon:
10.0% (82)Ohio:
2.6% (14,988)
Lebanon Avon:
7.7% (63)Ohio:
0.7% (3,862)
Russia Avon:
6.7% (55)Ohio:
1.5% (8,452)
Malaysia Avon:
6.3% (52)Ohio:
0.2% (1,372)
Philippines Avon:
6.3% (52)Ohio:
3.1% (17,818)
China, excluding Hong Kong and Taiwan Avon:
4.3% (35)Ohio:
6.2% (35,703)
England Avon:
3.8% (31)Ohio:
1.0% (5,979)
Croatia Avon:
3.5% (29)Ohio:
0.4% (2,185)
Mexico Avon:
2.8% (23)Ohio:
7.8% (44,796)
Japan Avon:
2.6% (21)Ohio:
1.4% (8,101)
Germany Avon:
2.3% (19)Ohio:
2.2% (12,846)
Place of birth for U.S.-born residents:
This state: 18,731Other state: 5,402Northeast: 2,174Midwest: 1,274South: 1,733West: 296 91.0% of Avon residents lived in the same house 1 years ago.
Out of people who lived in different houses, 13.3% lived in this county.
Out of people who lived in different counties, 74.8% lived in Ohio.
Avon:
91.0%State average:
87.8%
Education attainment for males 25 years and older:
No schooling: 19Nursery to 4th grade: 05th and 6th grade: 07th and 8th grade: 09th grade: 010th grade: 1411th grade: 612th grade, no diploma: 65High school graduate (or equivalency): 1,134Less than 1 year of college: 264Some college more than 1 year, no degree: 516Associate degree: 423Bachelor's degree: 3,303Master's degree: 1,892Professional school degree: 505Doctorate degree: 156
Education attainment for females 25 years and older:
No schooling: 151Nursery to 4th grade: 55th and 6th grade: 107th and 8th grade: 09th grade: 010th grade: 5111th grade: 1612th grade, no diploma: 30High school graduate (or equivalency): 1,399Less than 1 year of college: 572Some college more than 1 year, no degree: 867Associate degree: 559Bachelor's degree: 3,151Master's degree: 1,761Professional school degree: 514Doctorate degree: 139
Housing units in structures:
One, detached: 7,537One, attached: 1,279Two: 1373 or 4: 2325 to 9: 22720 to 49: 9050 or more: 218Mobile homes: 18Housing units lacking complete kitchen facilities in 2022: 0.5%House/condo owner moved in on average 10 years ago
Renter moved in on average 1 years ago
Private vs. public school enrollment:
Students in private schools in grades 1 to 8 (elementary and middle school): 649 Students in private schools in grades 9 to 12 (high school): 312 Students in private undergraduate colleges: 73