Balch Springs, TX (Texas) Houses and Residents
| Balch Springs: | $217,465 |
| Texas: | $275,400 |
Total population: 25,120 (Urban population: 19,437, Rural population: 0)
Houses: 9,061 (8,382 occupied: 5,247 owner occupied, 3,242 renter occupied)
| % of renters here: | 38% |
| State: | 38% |
Housing density: 1,125 houses/condos per square mile
Median price asked for vacant for-sale houses and condos in 2022: $130,604.
Median contract rent in 2022: $1,077 (lower quartile is $792, upper quartile is $1,309)
Median rent asked for vacant for-rent units in 2022: $1,084
Median gross rent in Balch Springs, TX in 2022: $1,215
Housing units in Balch Springs with a mortgage: 2,756 (0 second mortgage, 0 home equity loan, 0 both second mortgage and home equity loan)
Houses without a mortgage: 82
Median household income for houses/condos with a mortgage: $84,266
Median household income for apartments without a mortgage: $74,142
Median monthly housing costs: $1,159
Compare current foreclosures near Balch Springs, TX:
| Photo | Address | Area | Beds / Baths | Price | Details |
|---|---|---|---|---|---|

|
#1
Tavistock Road
Forney, TX 75126
|
2,857 sq. feet
|
2 baths 4 beds |
$364,900
|
show details |

|
#2
Blue Quail Run
Red Oak, TX 75154
|
2,876 sq. feet
|
3 baths 4 beds |
show details | |

|
#3
Walnut St
Dallas, TX 75243
|
662 sq. feet
|
1 baths 1 beds |
show details | |

|
#4
W 10th St # 703
Dallas, TX 75208
|
2,025 sq. feet
|
2 baths 2 beds |
show details | |

|
#5
Donlee Rd
Lancaster, TX 75134
|
1,510 sq. feet
|
2 baths 3 beds |
show details | |

|
#6
Perch Drive
Forney, TX 75126
|
1,235 sq. feet
|
2 baths 3 beds |
show details | |

|
#7
Wrangler Way
Dallas, TX 75253
|
- sq. feet
|
2 baths 3 beds |
show details | |

|
#8
Prairie Lakes Ln
Forney, TX 75126
|
2,854 sq. feet
|
3 baths 4 beds |
show details | |

|
#9
Victory Ln
Rockwall, TX 75032
|
1,897 sq. feet
|
2 baths 3 beds |
show details | |

|
#10
Slay St
Dallas, TX 75217
|
864 sq. feet
|
1 baths 2 beds |
show details |
| Photo | Address | Area | Beds / Baths | Price | Details |
|---|---|---|---|---|---|

|
#11
S Galloway Ave
Mesquite, TX 75149
|
1,906 sq. feet
|
2 baths 3 beds |
show details | |

|
#12
Vandervort Dr
Dallas, TX 75216
|
1,623 sq. feet
|
2 baths 3 beds |
show details | |

|
#13
Lewiston Ave
Dallas, TX 75227
|
1,288 sq. feet
|
1 baths 3 beds |
show details | |

|
#14
Willowbrook Ct
Lancaster, TX 75134
|
1,242 sq. feet
|
1 baths 3 beds |
show details | |

|
#15
Hayworth Ave
Duncanville, TX 75137
|
1,511 sq. feet
|
2 baths 3 beds |
show details | |

|
#16
Serenade Ln
Dallas, TX 75241
|
2,381 sq. feet
|
2 baths 3 beds |
show details | |

|
#17
Bantry Ln
Forney, TX 75126
|
2,392 sq. feet
|
2 baths 3 beds |
show details | |

|
#18
Highmont Dr
Garland, TX 75041
|
1,302 sq. feet
|
2 baths 3 beds |
show details | |

|
#19
Wintergreen Dr
Forney, TX 75126
|
- sq. feet
|
2 baths 3 beds |
show details | |

|
#20
Oleander Trl
Mesquite, TX 75150
|
2,315 sq. feet
|
1 baths 3 beds |
show details |
| Photo | Address | Area | Beds / Baths | Price | Details |
|---|---|---|---|---|---|

|
#21
N Nachita Dr
Dallas, TX 75217
|
1,164 sq. feet
|
2 baths 3 beds |
show details | |

|
#22
Max Goldblatt Dr
Dallas, TX 75227
|
1,303 sq. feet
|
2 baths 3 beds |
show details | |

|
#23
Club Oak Dr
Forney, TX 75126
|
2,457 sq. feet
|
2 baths 3 beds |
show details | |

|
#24
Ranch Dr
Garland, TX 75041
|
2,213 sq. feet
|
2 baths 3 beds |
show details | |

|
#25
Peninsula Dr
Dallas, TX 75218
|
1,190 sq. feet
|
1 baths 3 beds |
show details | |

|
#26
Minert St # 2809
Dallas, TX 75219
|
1,023 sq. feet
|
1 baths 2 beds |
show details | |

|
#27
Woodthorpe Dr
Mesquite, TX 75181
|
3,205 sq. feet
|
2 baths 4 beds |
show details | |

|
#28
Sunset Ave
Dallas, TX 75211
|
1,464 sq. feet
|
1 baths 3 beds |
show details | |

|
#29
Blanton St
Dallas, TX 75227
|
2,062 sq. feet
|
2 baths 3 beds |
show details | |

|
#30
Drakestone Ave
Rowlett, TX 75088
|
1,506 sq. feet
|
2 baths 3 beds |
show details |
| Photo | Address | Area | Beds / Baths | Price | Details |
|---|---|---|---|---|---|

|
#31
Rochdale St
Garland, TX 75040
|
2,238 sq. feet
|
3 baths 4 beds |
show details | |

|
#32
Elderberry Street
Forney, TX 75126
|
2,724 sq. feet
|
2 baths 5 beds |
show details | |

|
#33
Bondstone Dr
Dallas, TX 75218
|
1,825 sq. feet
|
2 baths 4 beds |
show details | |

|
#34
Rockefeller Blvd
Dallas, TX 75203
|
- sq. feet
|
1 baths 2 beds |
show details | |

|
#35
E Harvard Dr
Garland, TX 75041
|
1,626 sq. feet
|
2 baths 4 beds |
show details | |

|
#36
Audelia Rd Apt
Dallas, TX 75243
|
- sq. feet
|
1 baths 2 beds |
show details | |

|
#37
Osage Dr
Rowlett, TX 75088
|
1,728 sq. feet
|
2 baths 4 beds |
show details | |

|
#38
Clear Springs Dr
Forney, TX 75126
|
1,654 sq. feet
|
2 baths 3 beds |
show details | |

|
#39
Candelilla Dr
Desoto, TX 75115
|
3,076 sq. feet
|
3 baths 4 beds |
show details | |

|
#40
Post Oak Dr
Seagoville, TX 75159
|
2,420 sq. feet
|
2 baths 4 beds |
show details |
| Photo | Address | Area | Beds / Baths | Price | Details |
|---|---|---|---|---|---|

|
#41
Gayle Dr
Garland, TX 75044
|
1,877 sq. feet
|
3 baths 3 beds |
show details | |

|
#42
Willow Ridge Cir
Rockwall, TX 75032
|
1,556 sq. feet
|
2 baths 2 beds |
show details | |

|
#43
Cardinal Dr
Forney, TX 75126
|
3,661 sq. feet
|
3 baths 5 beds |
show details | |

|
#44
Wood Valley Dr
Dallas, TX 75211
|
1,344 sq. feet
|
1 baths 2 beds |
show details | |

|
#45
Elam Rd
Dallas, TX 75217
|
1,776 sq. feet
|
3 baths 3 beds |
show details | |

|
#46
Graybar Dr
Garland, TX 75040
|
1,719 sq. feet
|
2 baths 3 beds |
show details | |

|
#47
N Masters Dr
Dallas, TX 75227
|
1,362 sq. feet
|
2 baths 4 beds |
show details | |

|
#48
& 415 Graham Avenue
Dallas, TX 75223
|
- sq. feet
|
2 baths 2 beds |
show details | |

|
#49
Main St
Dallas, TX 75202
|
- sq. feet
|
1 baths 1 beds |
show details | |

|
Check over 1 million property listings on Foreclosure.com!
|
browse all offers | |||


 | Purchasing a Land vs 2nd home (51 replies) |
| Inflated home prices (280 replies) |
| Inexpensive Apartments (17 replies) |
| Are cheap houses really bad?? (35 replies) |
| 1,000-home community valued at $300 million coming to Forney. (20 replies) |
| Texas will become California (351 replies) |

Median year apartment built: 1988
Household type by relationship:
Households: 27,288- Male householders: 3,375 (582 living alone), Female householders: 4,815 (971 living alone)
3,826 spouses (3,793 opposite-sex spouses), 641 unmarried partners, (577 opposite-sex unmarried partners), 10,309 children (9,807 natural, 152 adopted, 348 stepchildren), 1,656 grandchildren, 706 brothers or sisters, 618 parents, 15 foster children, 675 other relatives, 528 non-relatives
- In group quarters: 119
Size of family households: 1,471 2-persons, 1,635 3-persons, 1,616 4-persons, 778 5-persons, 415 6-persons, 277 7-or-more-persons.
Size of nonfamily households: 1,661 1-person, 455 2-persons, 30 3-persons, 19 4-persons.
4,163 married couples with children.
2,549 single-parent households (280 men, 2,269 women).
52.8% of residents of Balch Springs speak English at home.
45.5% of residents speak Spanish at home (54% speak English very well, 17% speak English well, 19% speak English not well, 10% don't speak English at all).
0.1% of residents speak other Indo-European language at home (100% speak English very well).
0.9% of residents speak other language at home (86% speak English very well, 10% speak English well, 4% speak English not well).
Foreign born population: 6,380 (23.4%)
(25.3% of them are naturalized citizens)
| Here: | 5.6 |
| State: | 6.3 |
| Here: | 4.2 |
| State: | 4.0 |
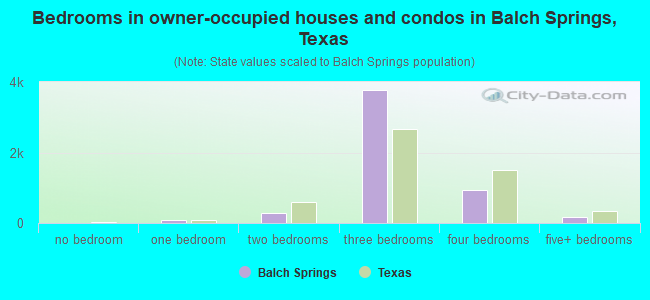
- Bedrooms in owner-occupied houses and condos in Balch Springs, Texas
- 0no bedroom
- 981 bedroom
- 2822 bedrooms
- 3,7623 bedrooms
- 9324 bedrooms
- 1745+ bedrooms
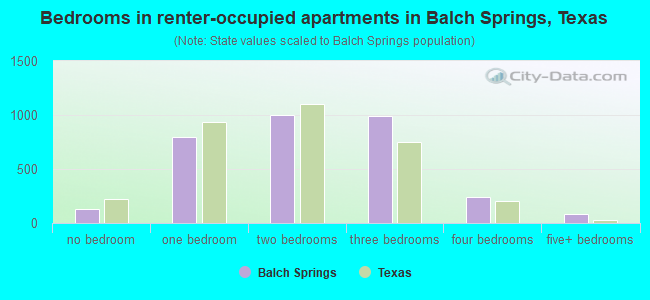
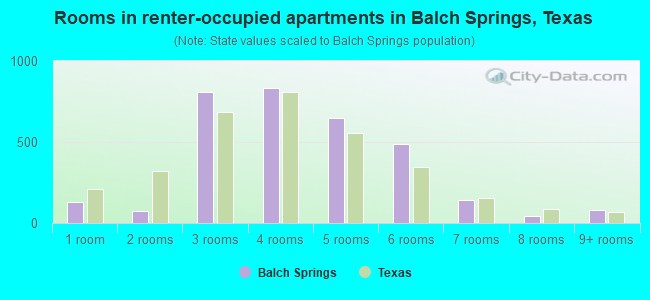
- Bedrooms in renter-occupied apartments in Balch Springs, Texas
- 129no bedroom
- 7931 bedroom
- 1,0042 bedrooms
- 9893 bedrooms
- 2454 bedrooms
- 825+ bedrooms
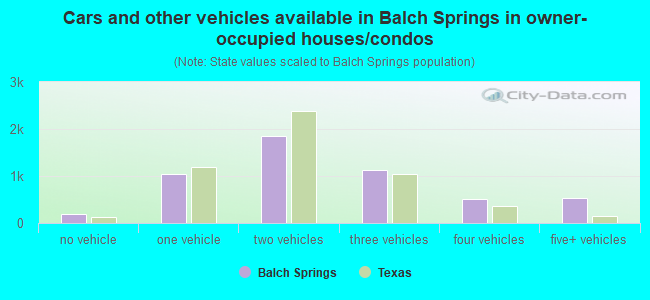
- Cars and other vehicles available in Balch Springs in owner-occupied houses/condos
- 202no vehicle
- 1,0441 vehicle
- 1,8502 vehicles
- 1,1183 vehicles
- 5114 vehicles
- 5235+ vehicles
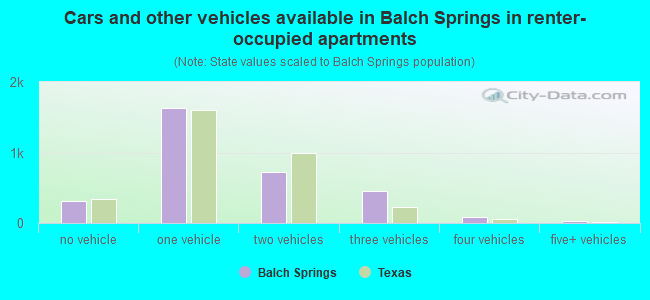
- Cars and other vehicles available in Balch Springs in renter-occupied apartments
- 317no vehicle
- 1,6381 vehicle
- 7272 vehicles
- 4483 vehicles
- 854 vehicles
- 285+ vehicles
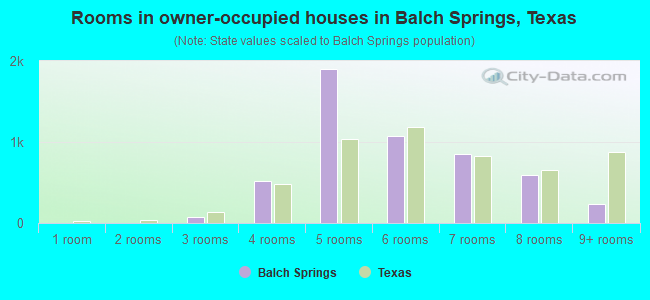
- Rooms in owner-occupied houses in Balch Springs, Texas
- 01 room
- 02 rooms
- 743 rooms
- 5224 rooms
- 1,8985 rooms
- 1,0746 rooms
- 8517 rooms
- 5978 rooms
- 2339+ rooms
- Rooms in renter-occupied apartments in Balch Springs, Texas
- 1291 room
- 742 rooms
- 8093 rooms
- 8314 rooms
- 6465 rooms
- 4876 rooms
- 1407 rooms
- 458 rooms
- 839+ rooms

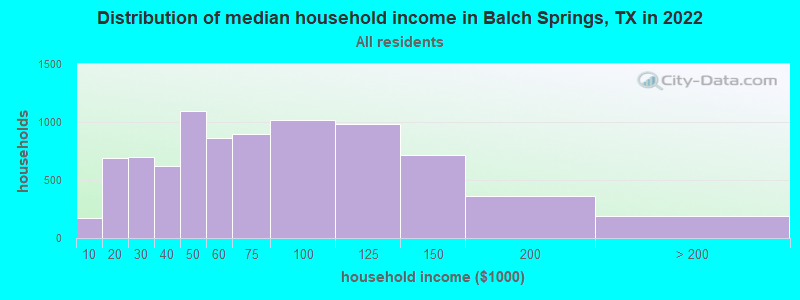
Balch Springs, TX household income distribution

- 174Less than $10,000
- 687$10,000 to $19,999
- 699$20,000 to $29,999
- 621$30,000 to $39,999
- 1,097$40,000 to $49,999
- 864$50,000 to $59,999
- 898$60,000 to $74,999
- 1,016$75,000 to $99,999
- 980$100,000 to $124,999
- 714$125,000 to $149,999
- 364$150,000 to $199,999
- 189$200,000 or more
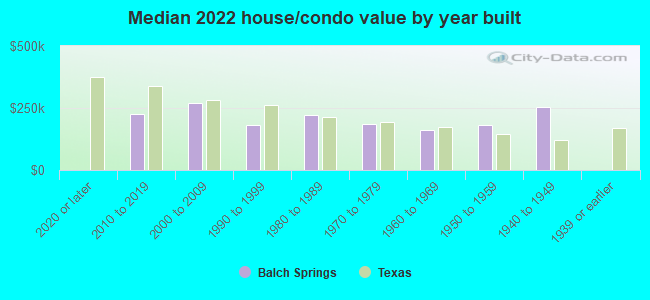
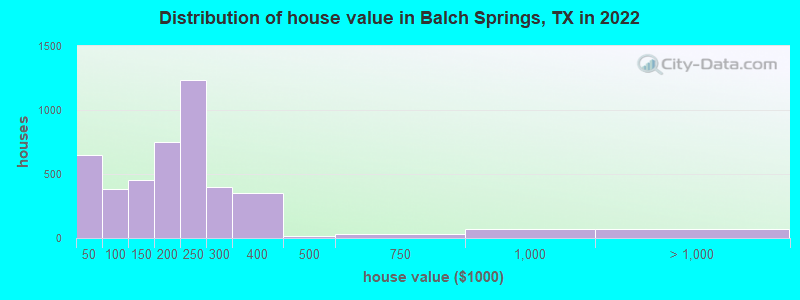
Home value of owner - occupied houses in 2022 in Balch Springs, TX
-
- 253Less than $10,000
- 216$10,000 to $14,999
- 54$15,000 to $19,999
- 54$25,000 to $29,999
- 35$30,000 to $34,999
- 12$35,000 to $39,999
- 18$40,000 to $49,999
- 6$50,000 to $59,999
- 79$60,000 to $69,999
- 69$70,000 to $79,999
- 79$80,000 to $89,999
- 132$90,000 to $99,999
- 293$100,000 to $124,999
- 157$125,000 to $149,999
- 317$150,000 to $174,999
- 434$175,000 to $199,999
- 1,238$200,000 to $249,999
- 397$250,000 to $299,999
- 355$300,000 to $399,999
- 15$400,000 to $499,999
- 32$500,000 to $749,999
- 70$750,000 to $999,999
- 47$1,000,000 to $1,499,999
- 25$2,000,000 or more
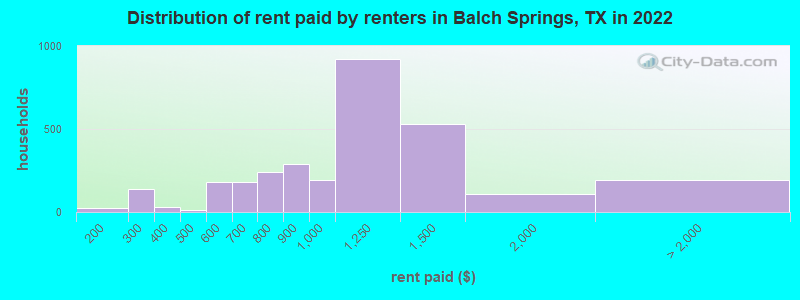
Rent paid by renters in 2022 in Balch Springs, TX
-
- 22$100 to $149
- 47$200 to $249
- 93$250 to $299
- 28$350 to $399
- 11$450 to $499
- 138$500 to $549
- 41$550 to $599
- 123$600 to $649
- 54$650 to $699
- 79$700 to $749
- 163$750 to $799
- 286$800 to $899
- 191$900 to $999
- 920$1,000 to $1,249
- 529$1,250 to $1,499
- 106$1,500 to $1,999
- 192No cash rent
Percentage of workers working in this county: 83.1%
Number of people working at home: 911 (7.6% of all workers)
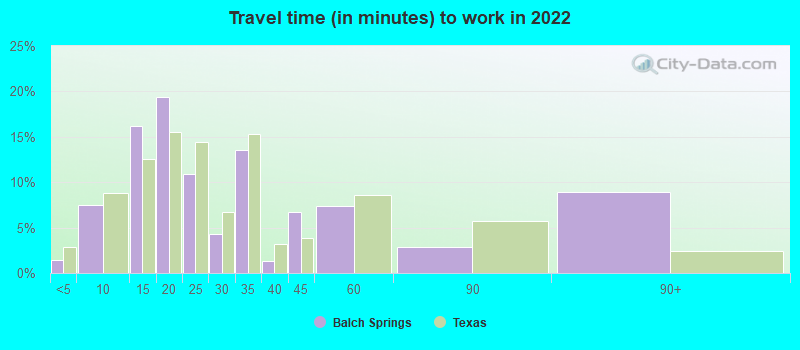
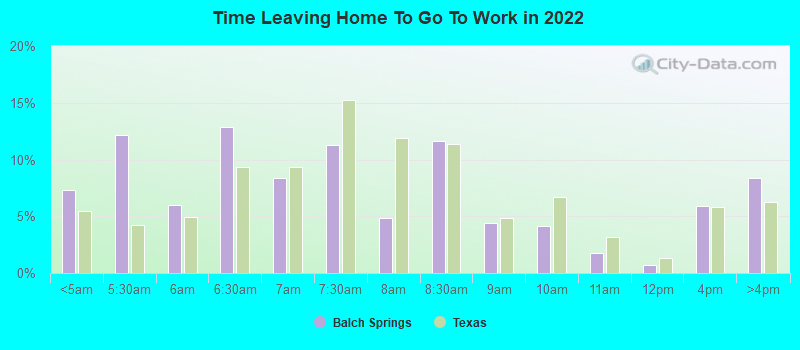
Travel time to work (commute)
- Less than 5 minutes: 127
- 5 to 9 minutes: 352
- 10 to 14 minutes: 790
- 15 to 19 minutes: 1,456
- 20 to 24 minutes: 1,204
- 25 to 29 minutes: 658
- 30 to 34 minutes: 1,699
- 35 to 39 minutes: 276
- 40 to 44 minutes: 472
- 45 to 59 minutes: 1,330
- 60 to 89 minutes: 1,826
- 90 or more minutes: 482
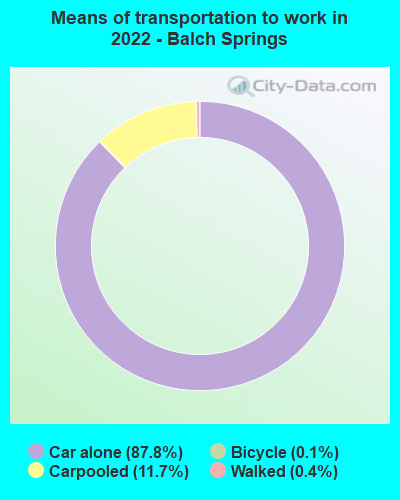
Means of transportation to work:
- Drove a car alone: 5,075 (76.0%)
- Carpooled: 696 (10.4%)
- Bicycle: 7 (0.1%)
- Walked: 23 (0.3%)
- Worked at home: 911 (13.6%)
- Unemployment by race in 2022
- Unemployment rate for White non-Hispanic residents
- 0.7%Males
- 3.4%Females
- Unemployment rate for Black residents
- 24.5%Males
- 11.3%Females
- Unemployment rate for other race residents
- 0.6%Males
- 4.8%Females
- Unemployment rate for two or more race residents
- 5.3%Females
- Unemployment rate for Hispanic or Latino residents
- 1.5%Males
- 3.0%Females
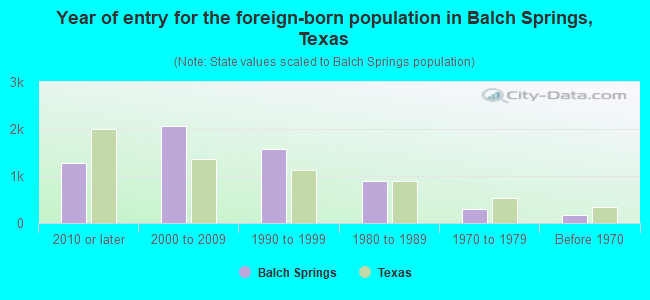
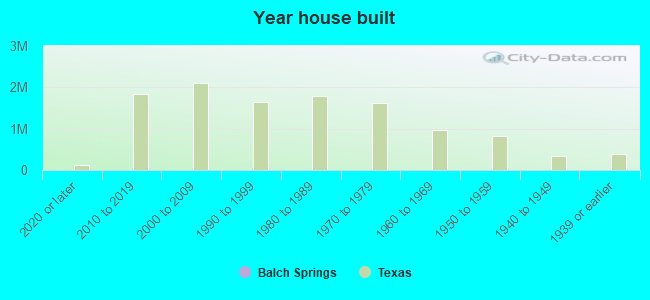
- Year of entry for the foreign-born population in Balch Springs, Texas
- 1,2682010 or later
- 2,0642000 to 2009
- 1,5761990 to 1999
- 8871980 to 1989
- 2901970 to 1979
- 162Before 1970
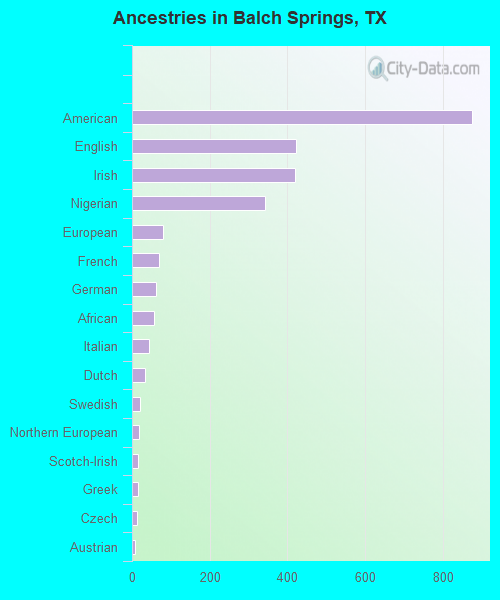
First ancestries reported:
- American: 875 (4.6%)
- English: 422 (2.2%)
- Irish: 420 (2.2%)
- Nigerian: 342 (1.8%)
- European: 80 (0.4%)
- French: 69 (0.4%)
- German: 62 (0.3%)
- African: 57 (0.3%)
- Italian: 43 (0.2%)
- Dutch: 34 (0.2%)
- Swedish: 21 (0.1%)
- Northern European: 18 (0.10%)
- Scotch-Irish: 16 (0.08%)
- Greek: 15 (0.08%)
- Czech: 14 (0.07%)
- Austrian: 9 (0.05%)
Most common places of birth for foreign-born residents (%):
| Balch Springs: | 79.9% (5,364) |
| Texas: | 48.4% (2,411,723) |
| Balch Springs: | 7.9% (530) |
| Texas: | 4.5% (224,455) |
| Balch Springs: | 3.1% (207) |
| Texas: | 1.9% (96,110) |
| Balch Springs: | 1.7% (114) |
| Texas: | 3.0% (147,182) |
Place of birth for U.S.-born residents:
- This state: 17,402
- Other state: 3,177
- Northeast: 107
- Midwest: 836
- South: 1,605
- West: 599
87.1% of Balch Springs residents lived in the same house 1 years ago.
Out of people who lived in different houses, 45.8% lived in this county.
Out of people who lived in different counties, 56.5% lived in Texas.
| Balch Springs: | 87.1% |
| State average: | 85.7% |
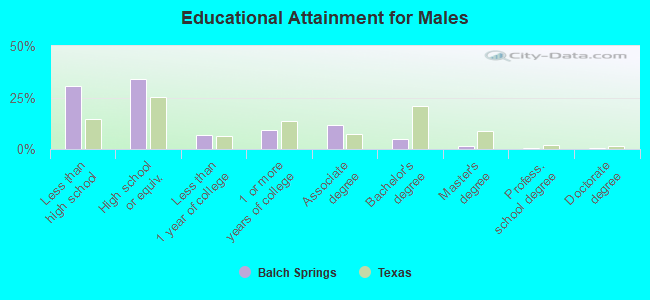
Education attainment for males 25 years and older:
- No schooling: 241
- Nursery to 4th grade: 196
- 5th and 6th grade: 662
- 7th and 8th grade: 179
- 9th grade: 552
- 10th grade: 121
- 11th grade: 246
- 12th grade, no diploma: 182
- High school graduate (or equivalency): 2,621
- Less than 1 year of college: 537
- Some college more than 1 year, no degree: 724
- Associate degree: 919
- Bachelor's degree: 374
- Master's degree: 96
- Professional school degree: 43
- Doctorate degree: 41
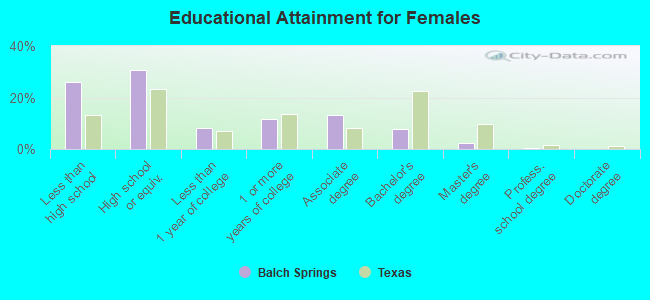
Education attainment for females 25 years and older:
- No schooling: 214
- Nursery to 4th grade: 112
- 5th and 6th grade: 262
- 7th and 8th grade: 192
- 9th grade: 602
- 10th grade: 286
- 11th grade: 132
- 12th grade, no diploma: 321
- High school graduate (or equivalency): 2,491
- Less than 1 year of college: 658
- Some college more than 1 year, no degree: 953
- Associate degree: 1,067
- Bachelor's degree: 640
- Master's degree: 185
- Professional school degree: 31
- Doctorate degree: 0


Housing units in structures:
- One, detached: 6,150
- One, attached: 185
- Two: 202
- 3 or 4: 258
- 5 to 9: 608
- 10 to 19: 705
- 20 to 49: 155
- 50 or more: 398
- Mobile homes: 397
Housing units lacking complete kitchen facilities in 2022: 0.7%
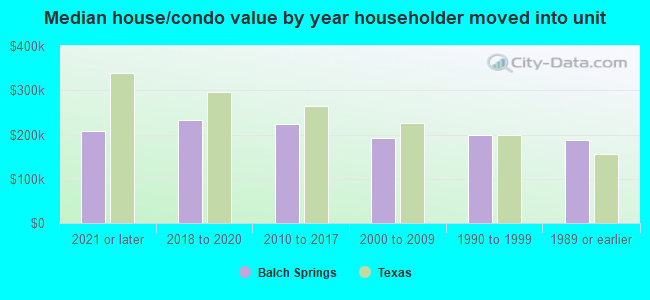
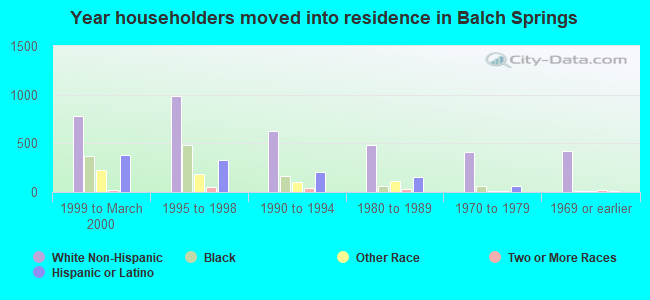
House/condo owner moved in on average 9 years ago
Renter moved in on average 5 years ago
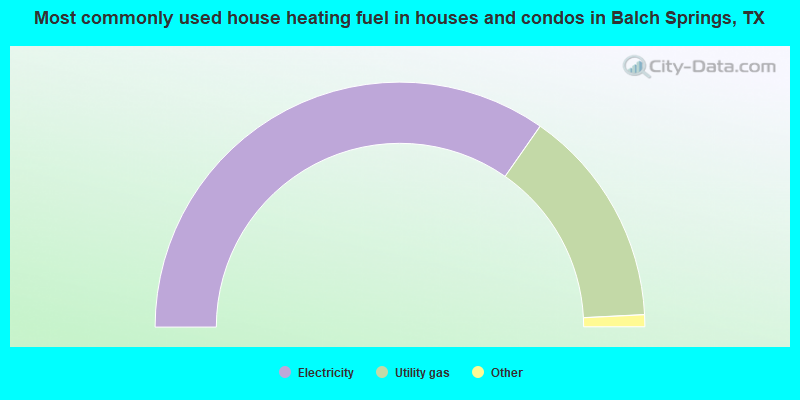
- 69.4%Electricity
- 29.0%Utility gas
- 0.8%No fuel used
- 0.4%Bottled, tank, or LP gas
- 0.3%Wood
- 0.1%Solar energy
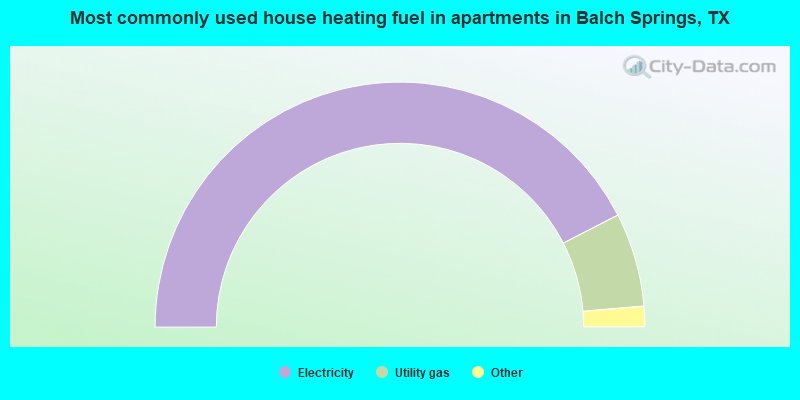
- 84.9%Electricity
- 12.4%Utility gas
- 2.2%No fuel used
- 0.5%Other fuel
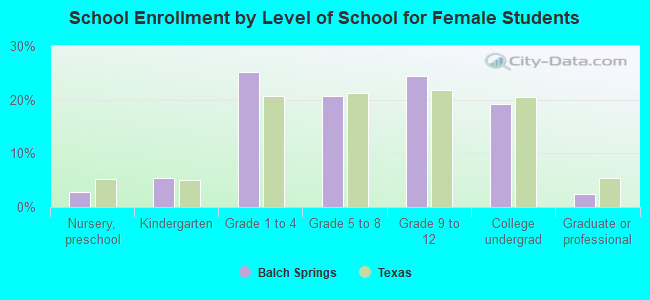
Private vs. public school enrollment:
| Here: | 7.1% |
| Texas: | 8.8% |
| Here: | 2.9% |
| Texas: | 8.0% |
| Here: | 16.5% |
| Texas: | 16.2% |